Plant ScienceLearning Visual
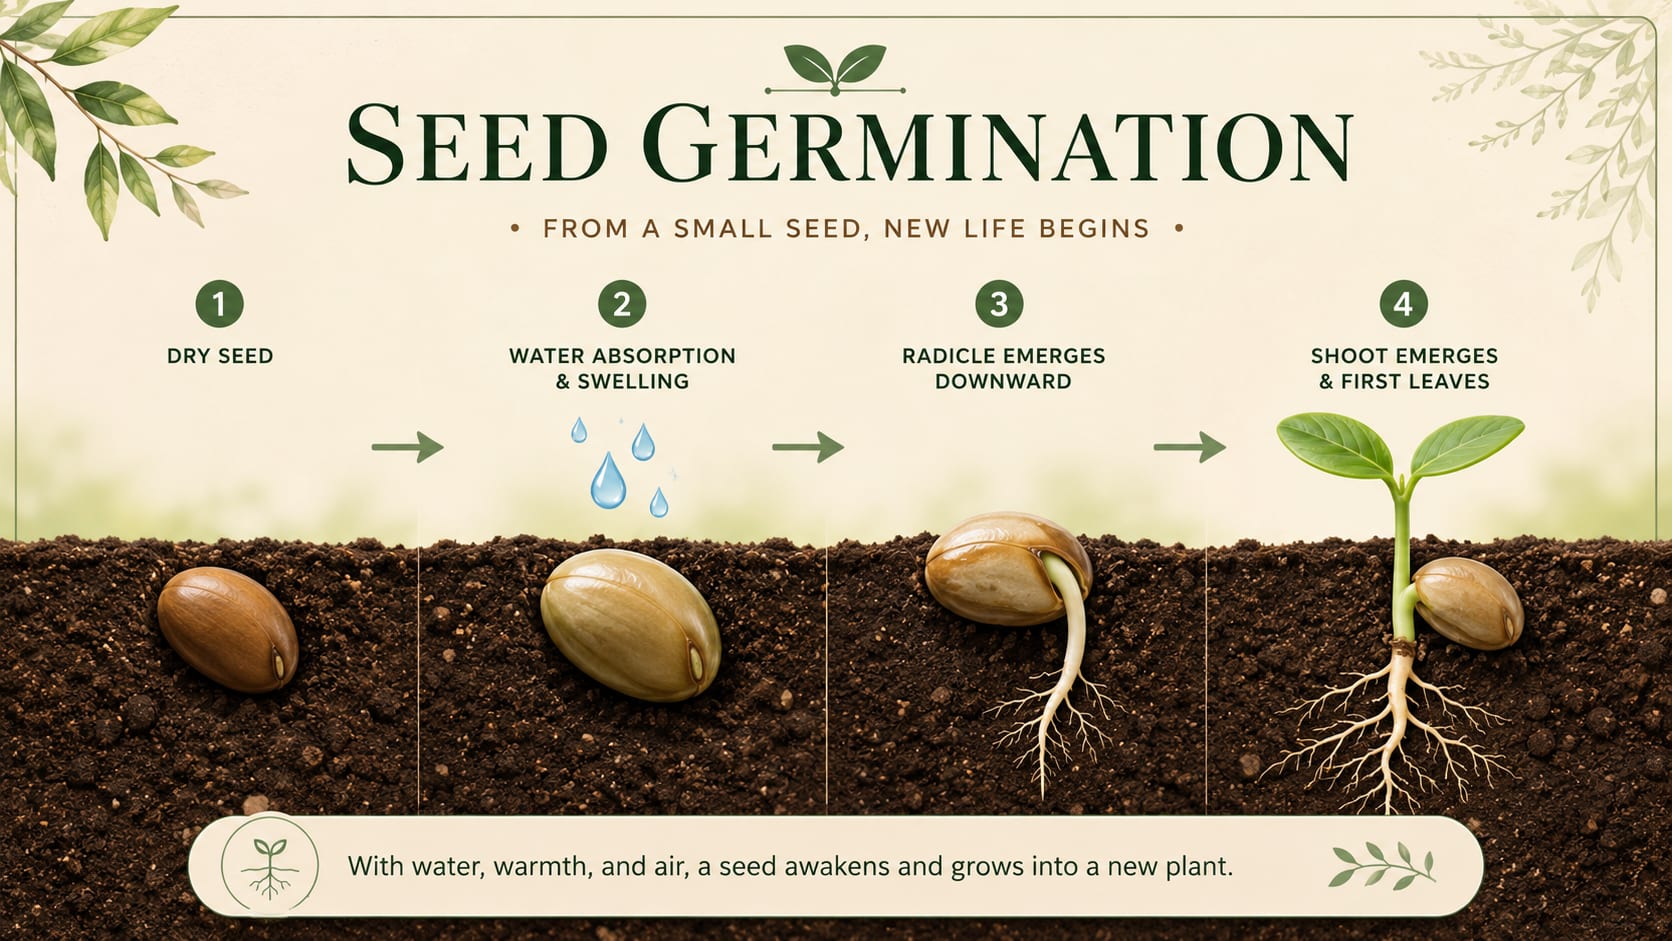
Seed Germination: From Seed to Sprout
A clear learning visual that shows how water, warmth, and air help a dry seed swell, root downward, and grow its first leaves.
Create SimilarSTRUCTURED KNOWLEDGE VISUALS
Turn topics, notes, or plain text into clear, structured infographics with readable labels, sections, and visual hierarchy.
Explore infographics, posters, and visual summaries created from topics, notes, and short text prompts.
A clear learning visual that shows how water, warmth, and air help a dry seed swell, root downward, and grow its first leaves.
Create Similar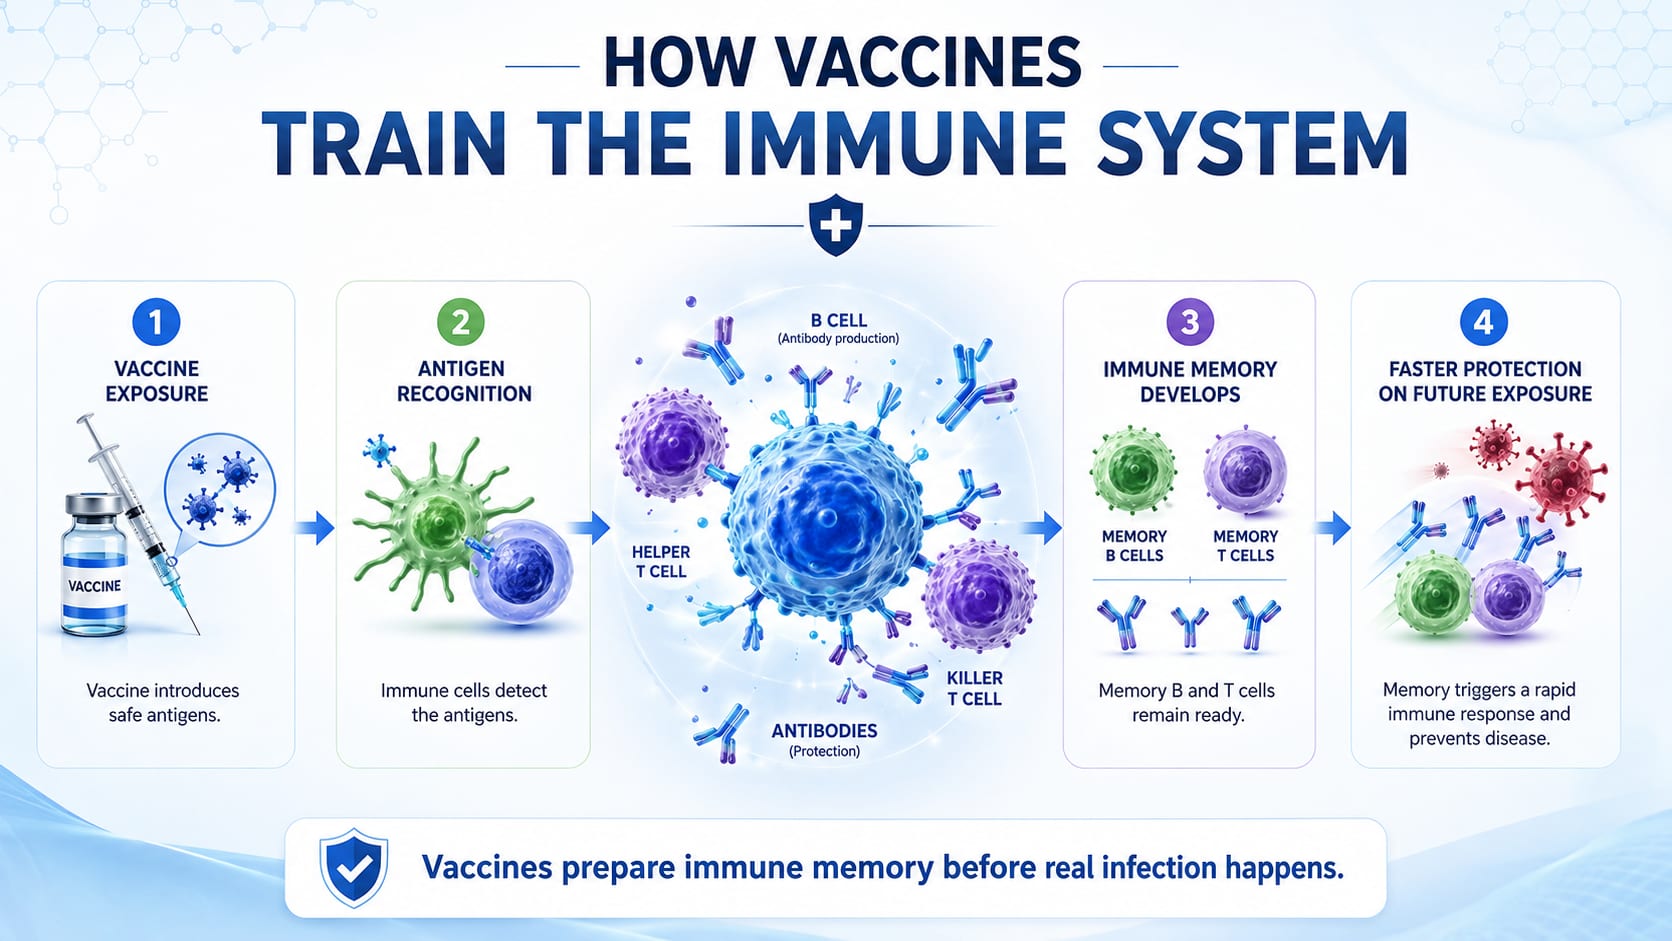
A health science infographic that breaks vaccine exposure, antigen recognition, antibody response, immune memory, and faster future protection into simple steps.
Create Similar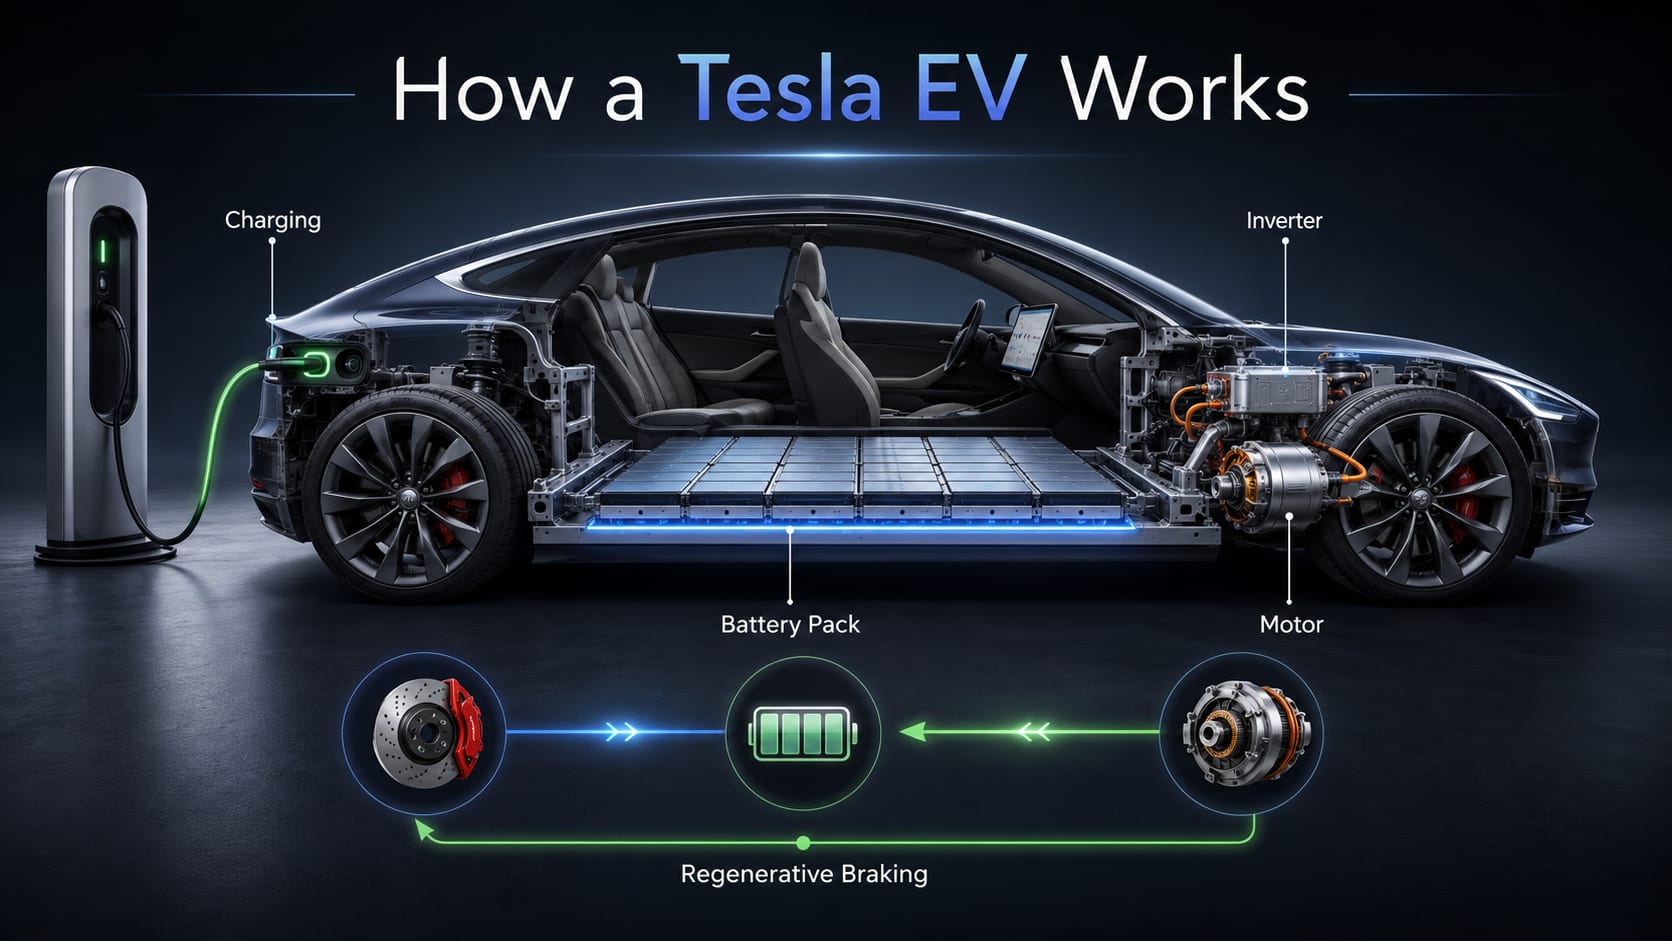
A technology infographic that labels the battery pack, motor, inverter, charging path, and regenerative braking system in one scan-friendly layout.
Create Similar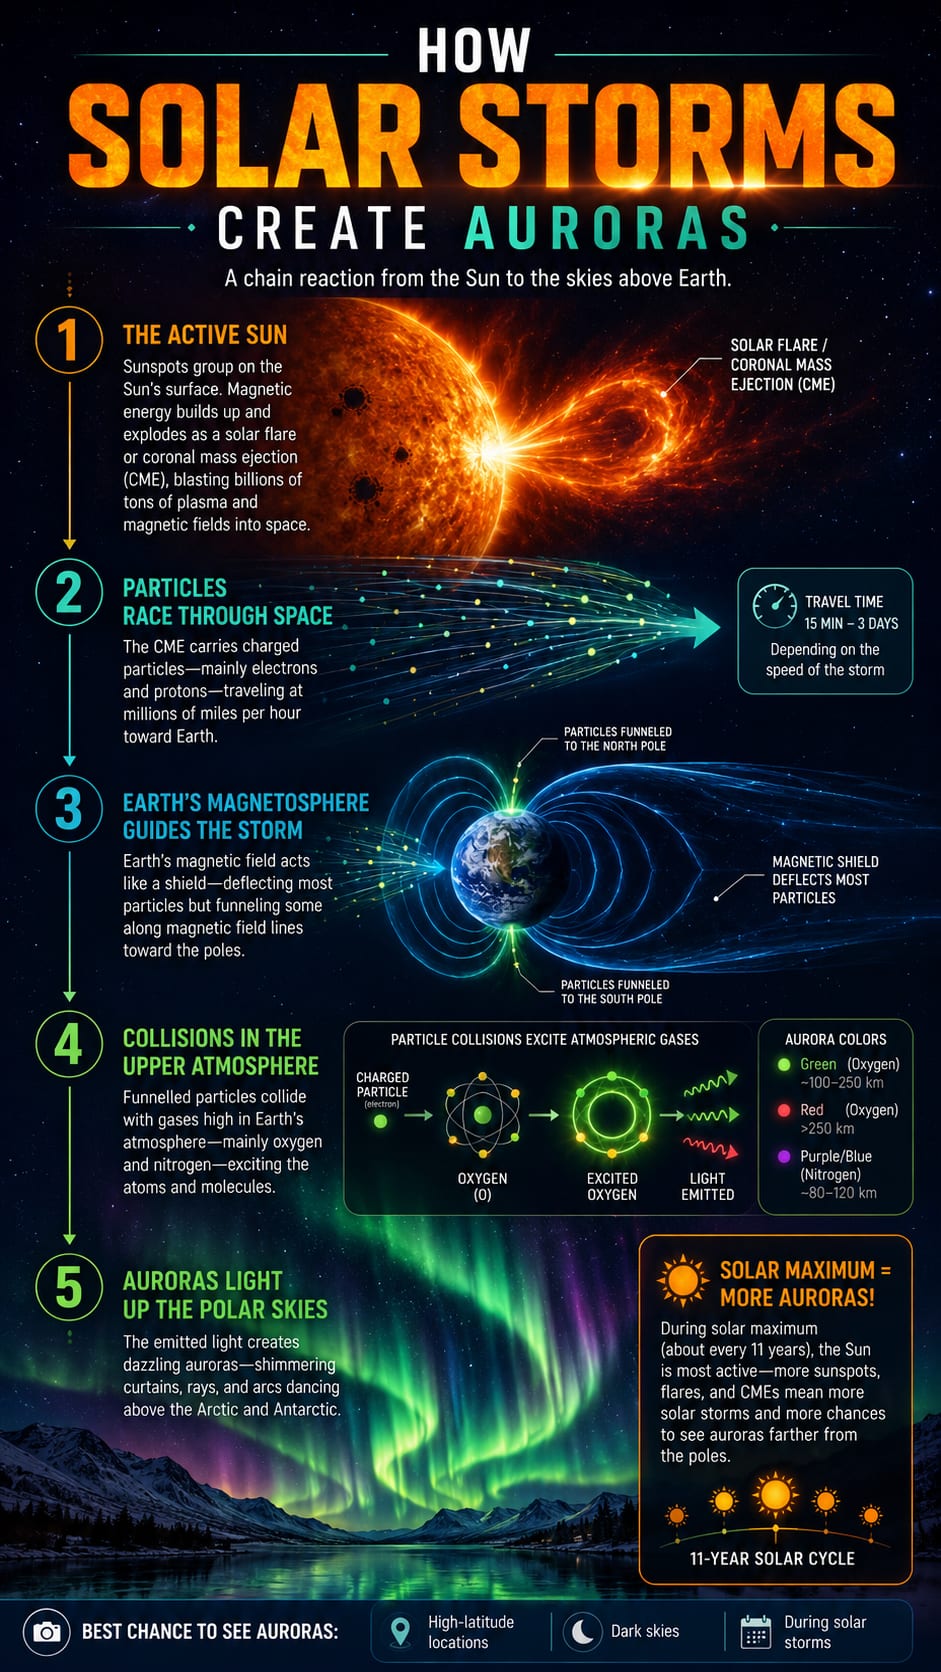
A vertical science infographic that follows charged particles from the Sun through Earth's magnetosphere to glowing auroras in the upper atmosphere.
Create Similar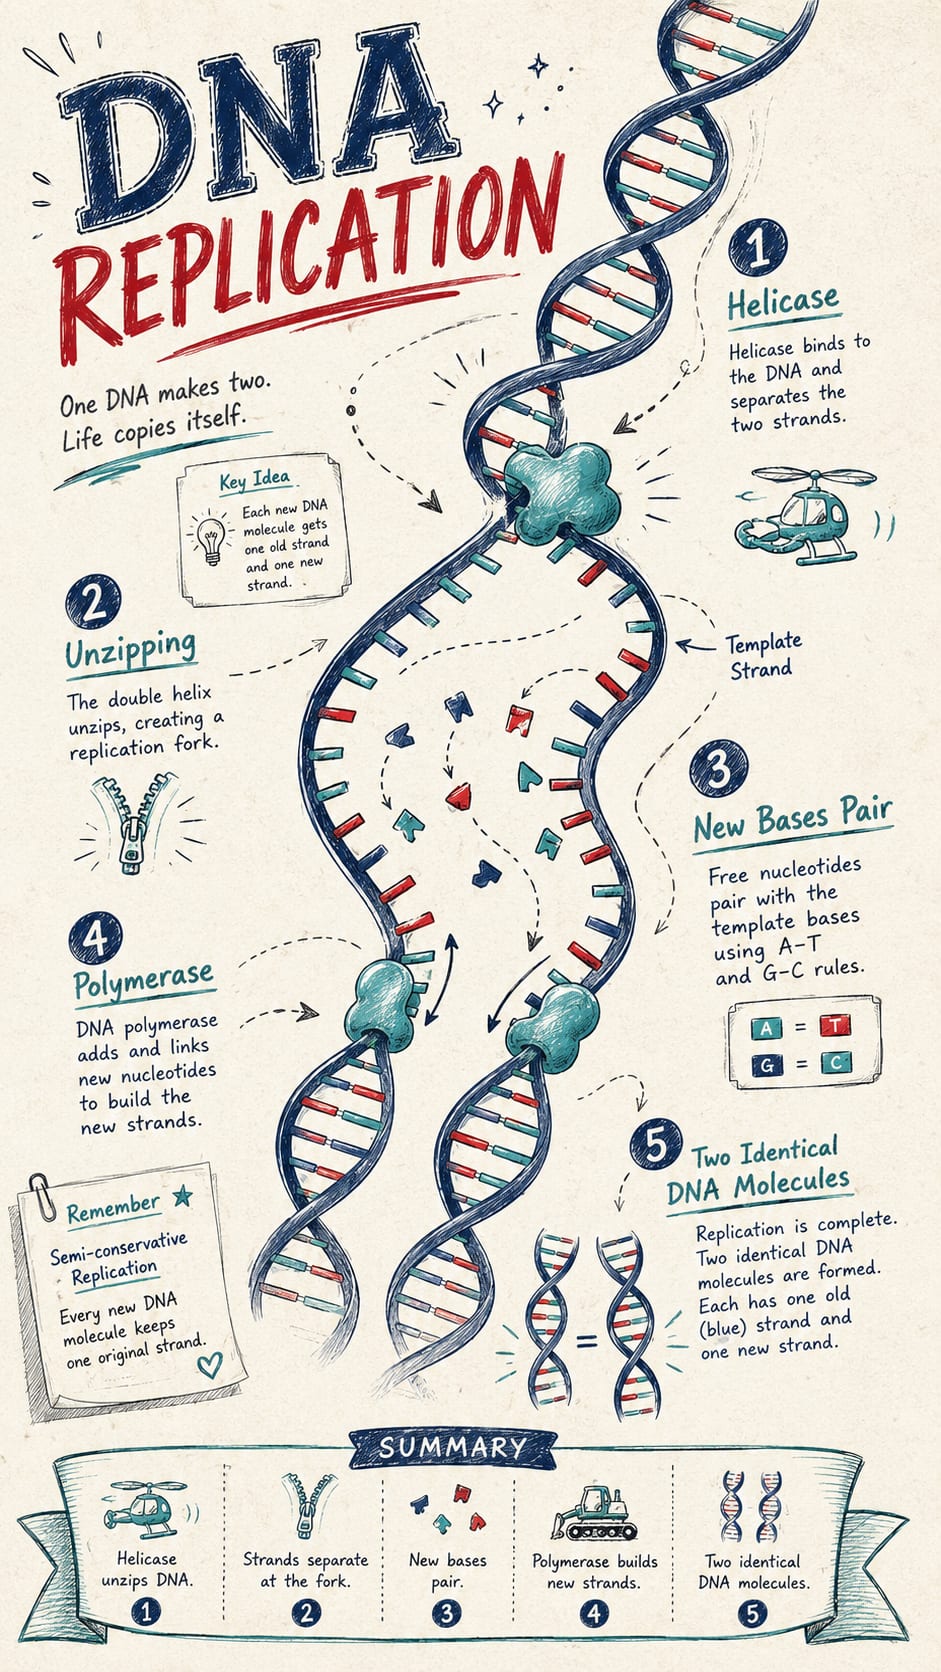
A biology infographic that explains helicase unzipping, base pairing, polymerase building new strands, and the result of two matching DNA molecules.
Create Similar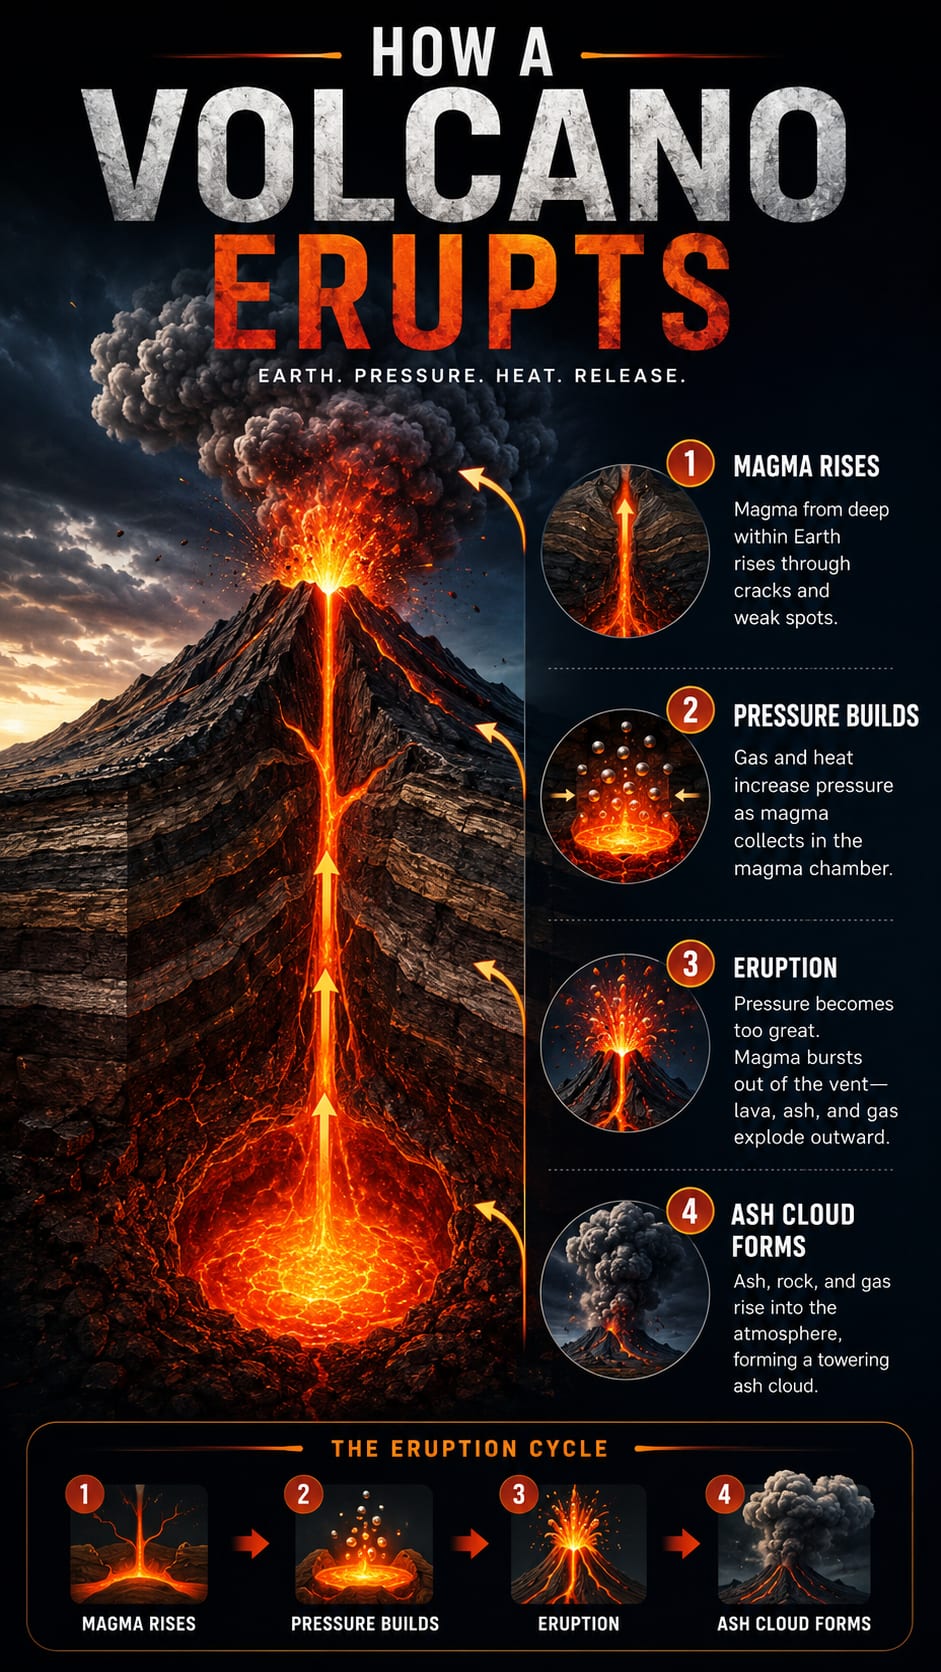
A dramatic earth science visual that shows magma rising, pressure building, eruption through the vent, ash cloud formation, and the eruption cycle.
Create SimilarAn AI infographic generator turns topics, notes, and plain text into structured visual information. KnowLens helps organize your message into sections, key points, readable labels, and a clear visual hierarchy before creating an infographic-style visual.
Use KnowLens to turn simple text into structured visual content for learning, explaining, and sharing.
Turn lesson topics, study notes, and short explanations into classroom-ready visuals.
Explain science concepts with clear sections, labels, diagrams, and visual structure.
Transform plain text or rough notes into a clean visual summary.
Create infographic posters for presentations, social media, and quick explanations.
Break one idea into clear visual sections that are easy to share.
Turn short ideas into simple, readable knowledge visuals.
KnowLens is built for information-heavy visuals, not generic AI art.
Create visuals with clear labels, headings, and short text blocks that are easier to scan.
Organize your idea into sections, steps, comparisons, or key points before the visual is created.
Emphasize the most important ideas with layout, spacing, titles, and visual grouping.
Start from your message instead of a blank canvas or decorative prompt.
Create visuals for teaching, learning, explaining concepts, and sharing knowledge.
HOW IT WORKS
Start with a topic, notes, or plain text. KnowLens helps organize your message and turn it into a clear visual output.
Paste a topic, study notes, a short explanation, recipe steps, or a product idea. You do not need a polished prompt.
KnowLens organizes your content into key points, sections, labels, and a visual hierarchy that is easier to understand.
Create a clear infographic, visual summary, poster-style graphic, or carousel-style visual for learning, teaching, presenting, or sharing.
Use KnowLens when an idea needs to be explained clearly, visually, and quickly.
Turn class notes, definitions, and difficult concepts into visual study guides that are easier to review before exams or presentations.
Study guides
Convert lesson topics into classroom-ready infographics with clear sections, labels, and examples students can understand at a glance.
Lesson visuals
Explain complex science, health, environment, and technology topics with structured visuals that make cause and effect easier to follow.
Science communication
Repurpose one idea into a compact visual summary for posts, newsletters, blogs, and social media threads.
Social content
Create quick knowledge visuals for product notes, internal updates, process explanations, and team communication without waiting on design support.
Team visuals
Turn product ideas, campaign messages, feature benefits, or customer education topics into clean visuals for sharing and explaining.
Campaign visuals
Common questions about creating infographics and visual summaries with KnowLens.
An AI infographic generator turns a topic, notes, or plain text into a visual layout that explains the idea clearly. KnowLens helps organize your message into sections, labels, key points, and visual structure.
Yes. You can paste plain text, notes, a topic, or a short explanation, and KnowLens will help turn it into an infographic-style visual.
You can start with a topic, notes, plain text, or a short explanation.
No. KnowLens helps structure your content and generate a clear visual layout, so you do not need to start from a blank canvas or design template.
No. You can create visuals for science, education, product ideas, recipes, study notes, social media, and general knowledge topics.
Yes. KnowLens can generate infographic-style visuals, poster-style graphics, visual summaries, and carousel-style visuals from text.
A normal infographic maker usually starts with templates. KnowLens starts with your topic or text, organizes the message, and turns it into structured visual information.
Generic AI image tools often focus on decorative images. KnowLens focuses on structured visual information, readable labels, clear sections, and infographic-style layouts.
Yes. KnowLens is useful for creating educational infographics, science visuals, classroom visuals, and study guides from notes or short explanations.
Yes. You can create infographic-style visuals, posters, and carousel-style visuals for social platforms, blogs, presentations, and quick sharing.
Start with a topic, notes, or plain text. Generate a structured infographic, visual summary, or poster-style design in minutes.