Plant ScienceLearning Visual
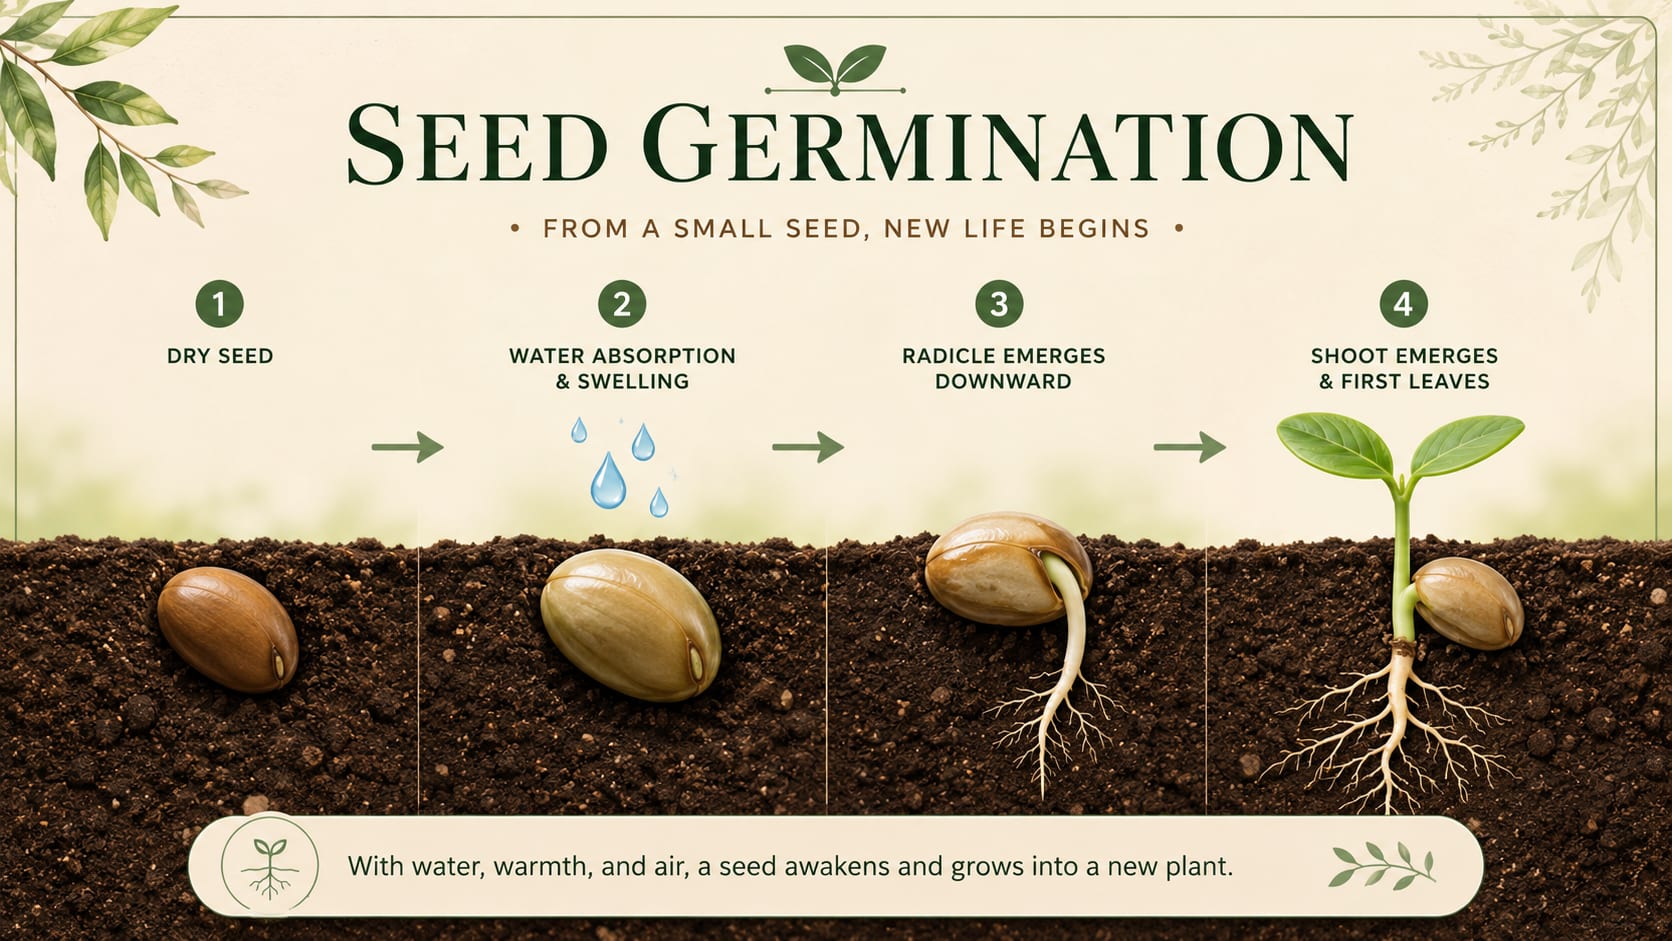
Seed Germination Steps
A 16:9 learning visual that explains how a seed absorbs water, grows roots, and sends up its first leaves.
Create SimilarTurn plain text, notes, topics, or outlines into clear infographics, visual summaries, posters, and carousel-style visuals in minutes.
Built for learning, science explainers, social posts, and clear visual communication.
Explore examples created from topics, notes, short explanations, and plain text prompts.
A 16:9 learning visual that explains how a seed absorbs water, grows roots, and sends up its first leaves.
Create Similar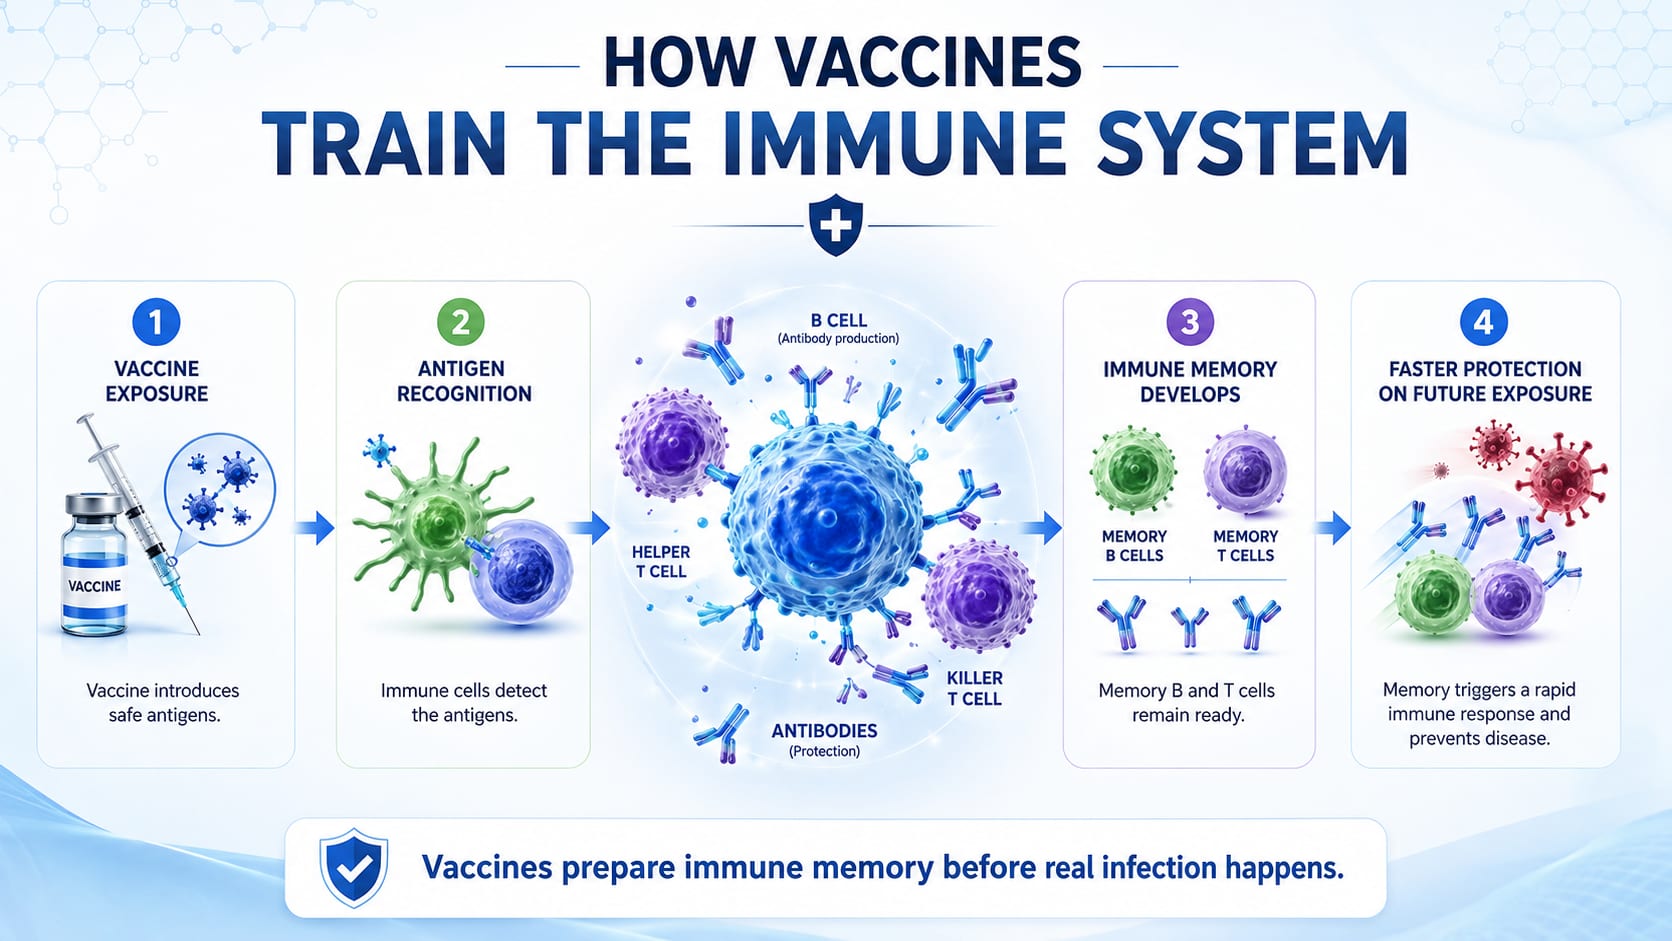
A 16:9 health science visual that turns immune response steps into a simple sequence.
Create Similar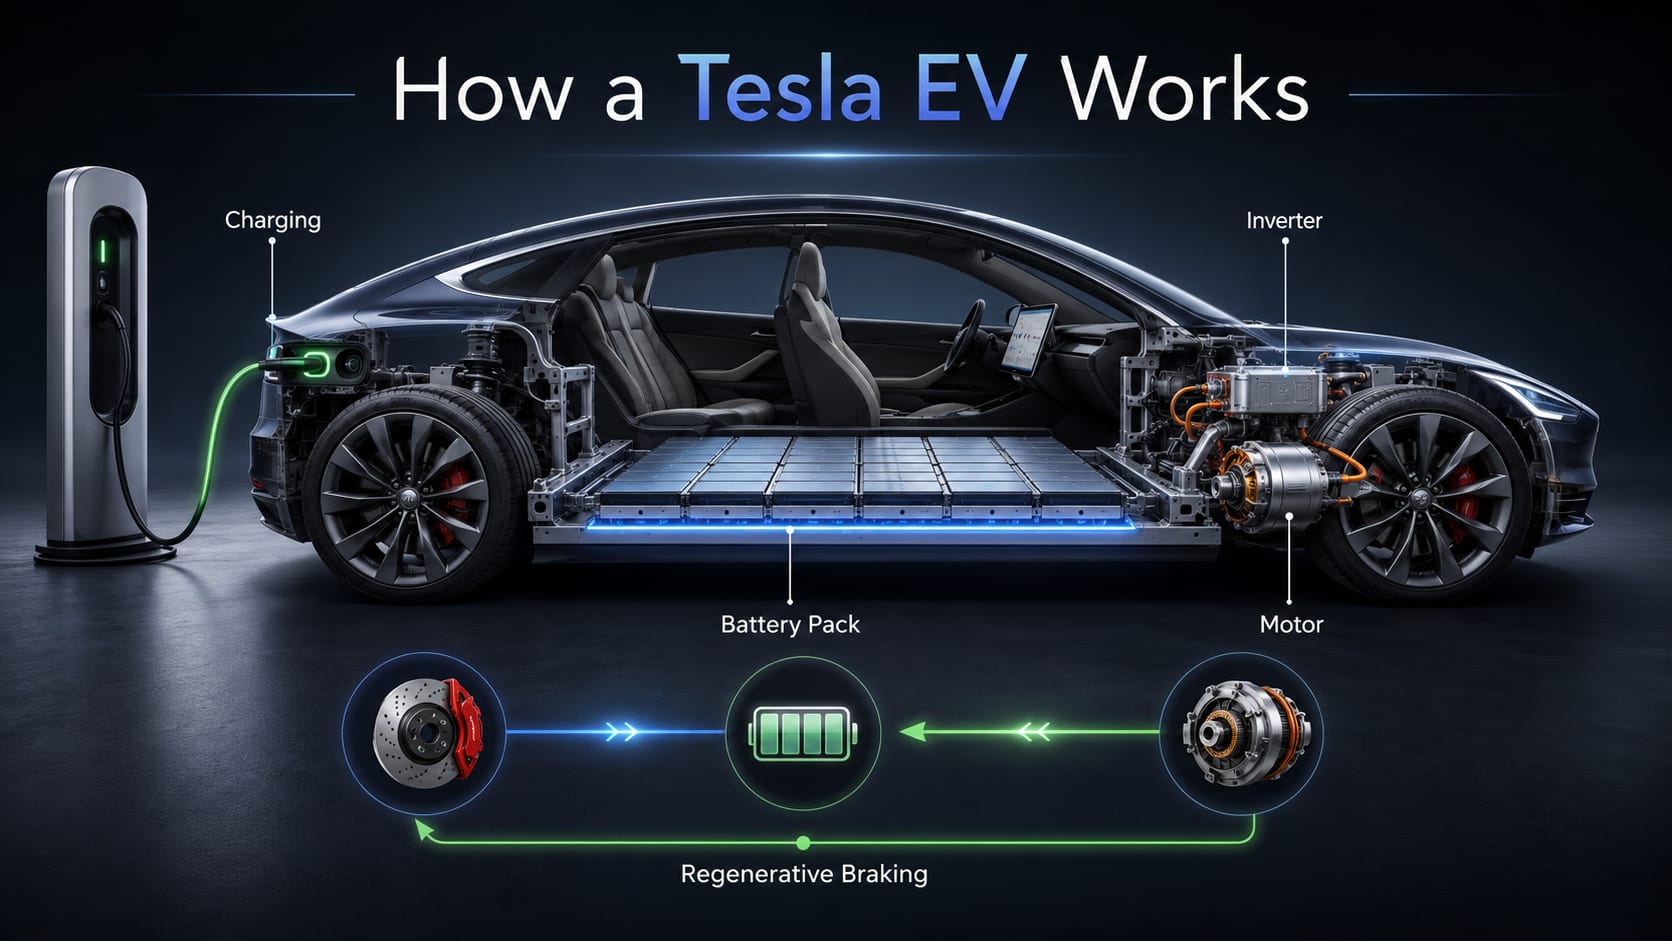
A 16:9 technical infographic that labels charging, the battery pack, inverter, motor, and regenerative braking.
Create Similar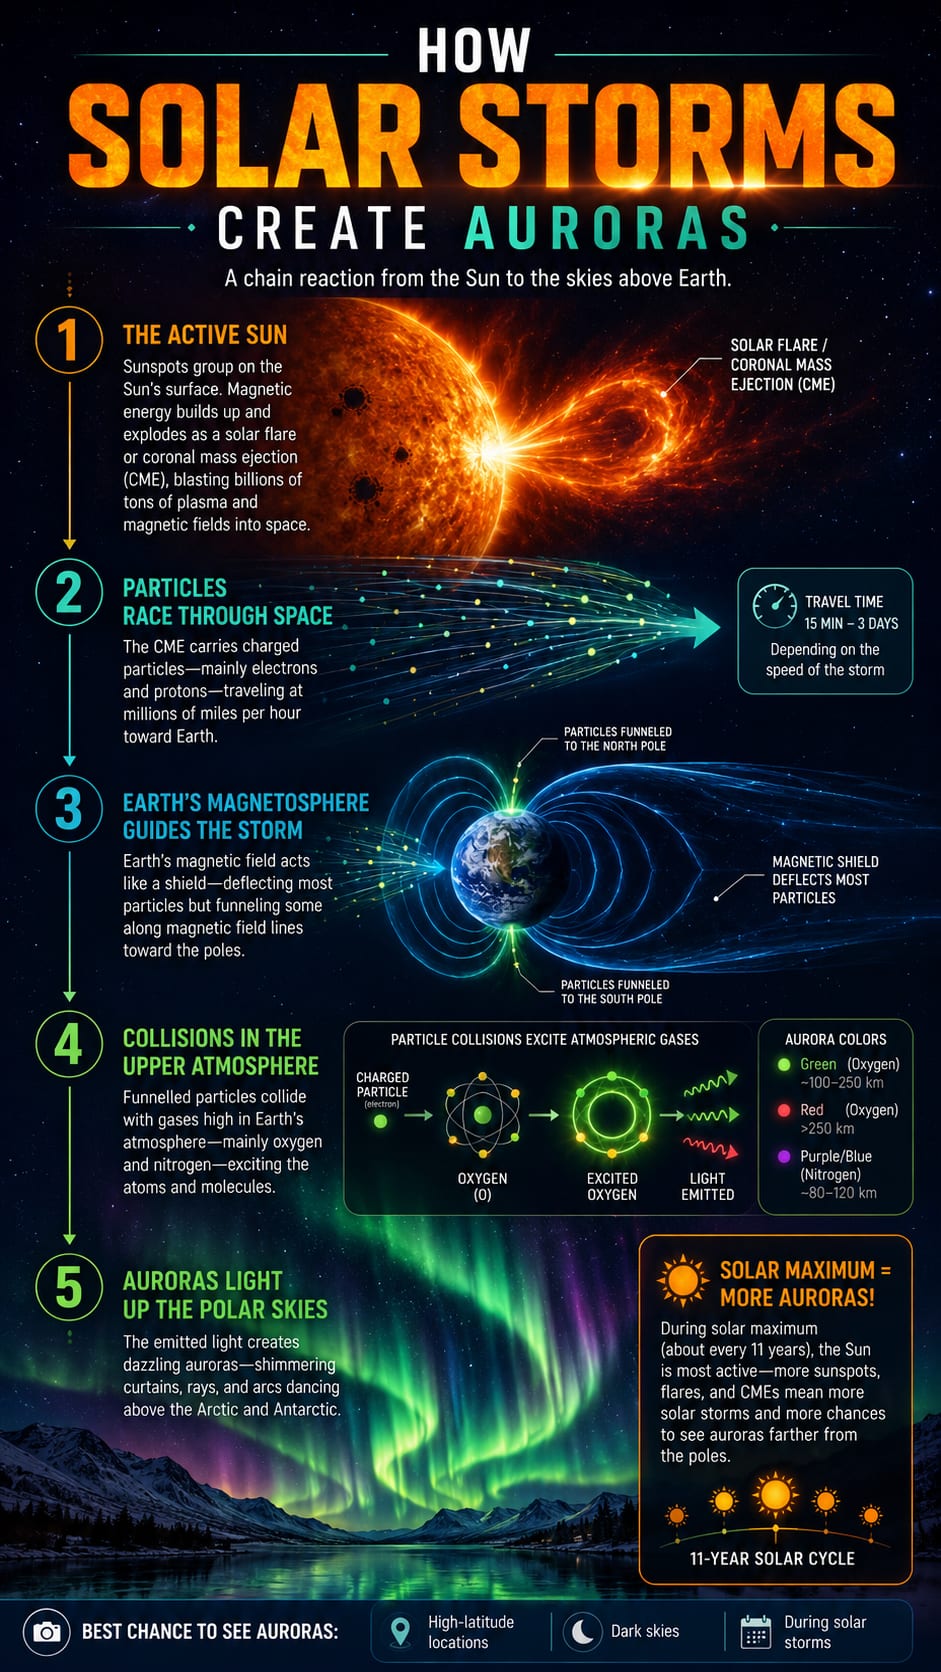
A vertical science infographic that follows charged particles from the Sun to glowing auroras.
Create Similar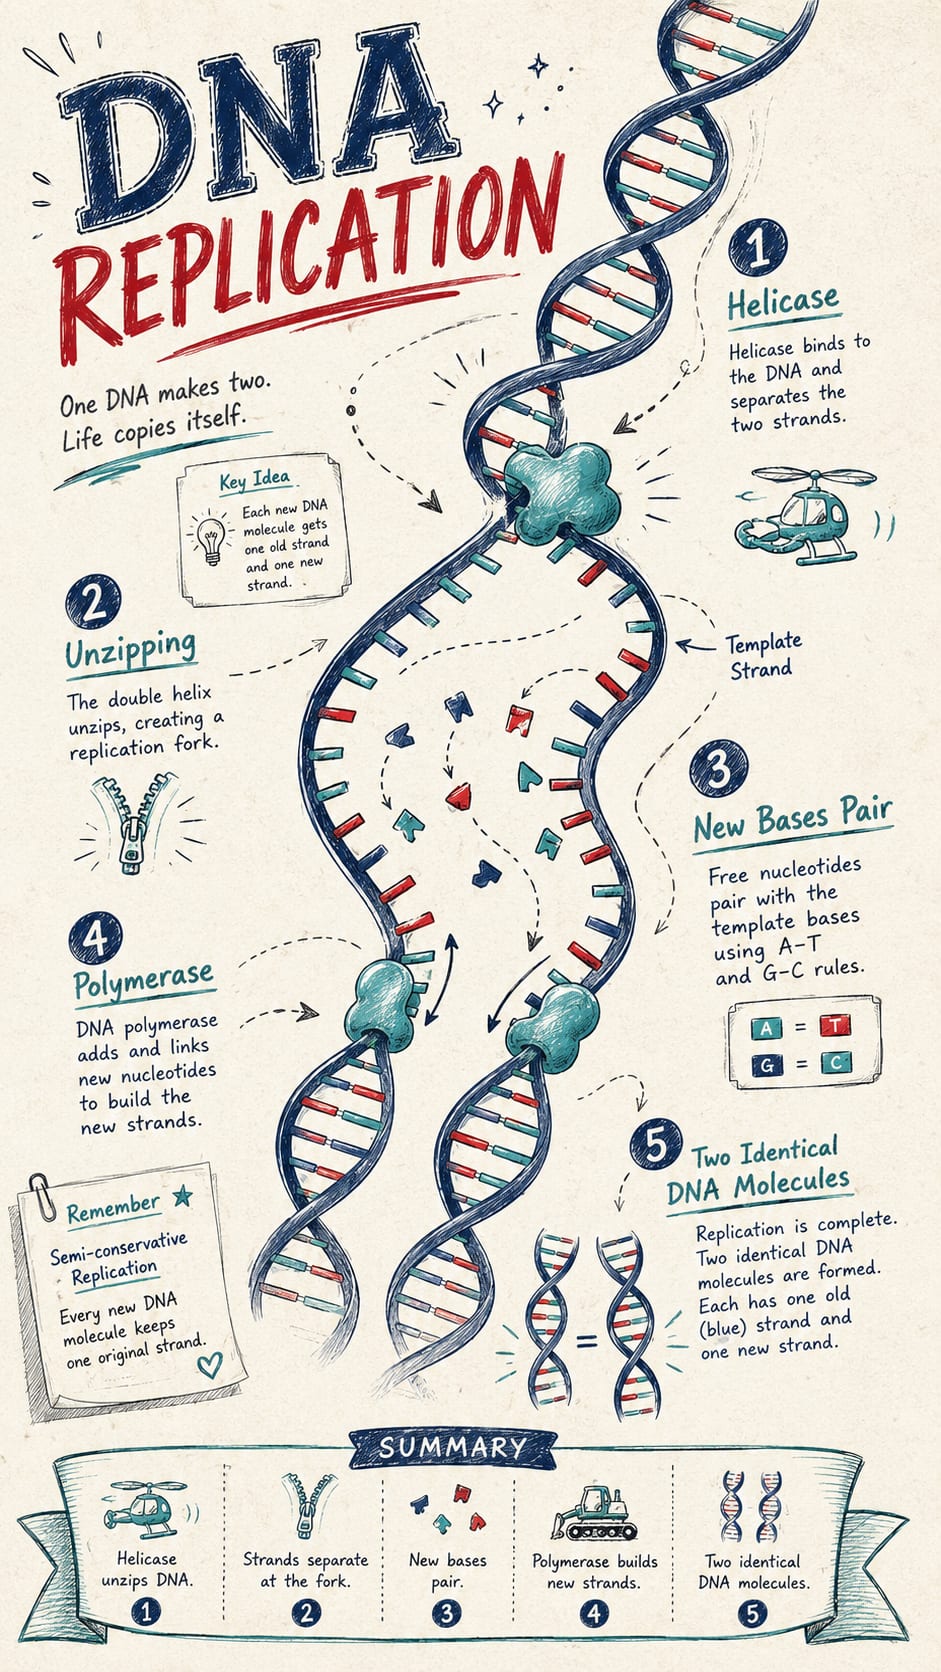
A vertical biology infographic that explains helicase, base pairing, polymerase, and matching DNA copies.
Create Similar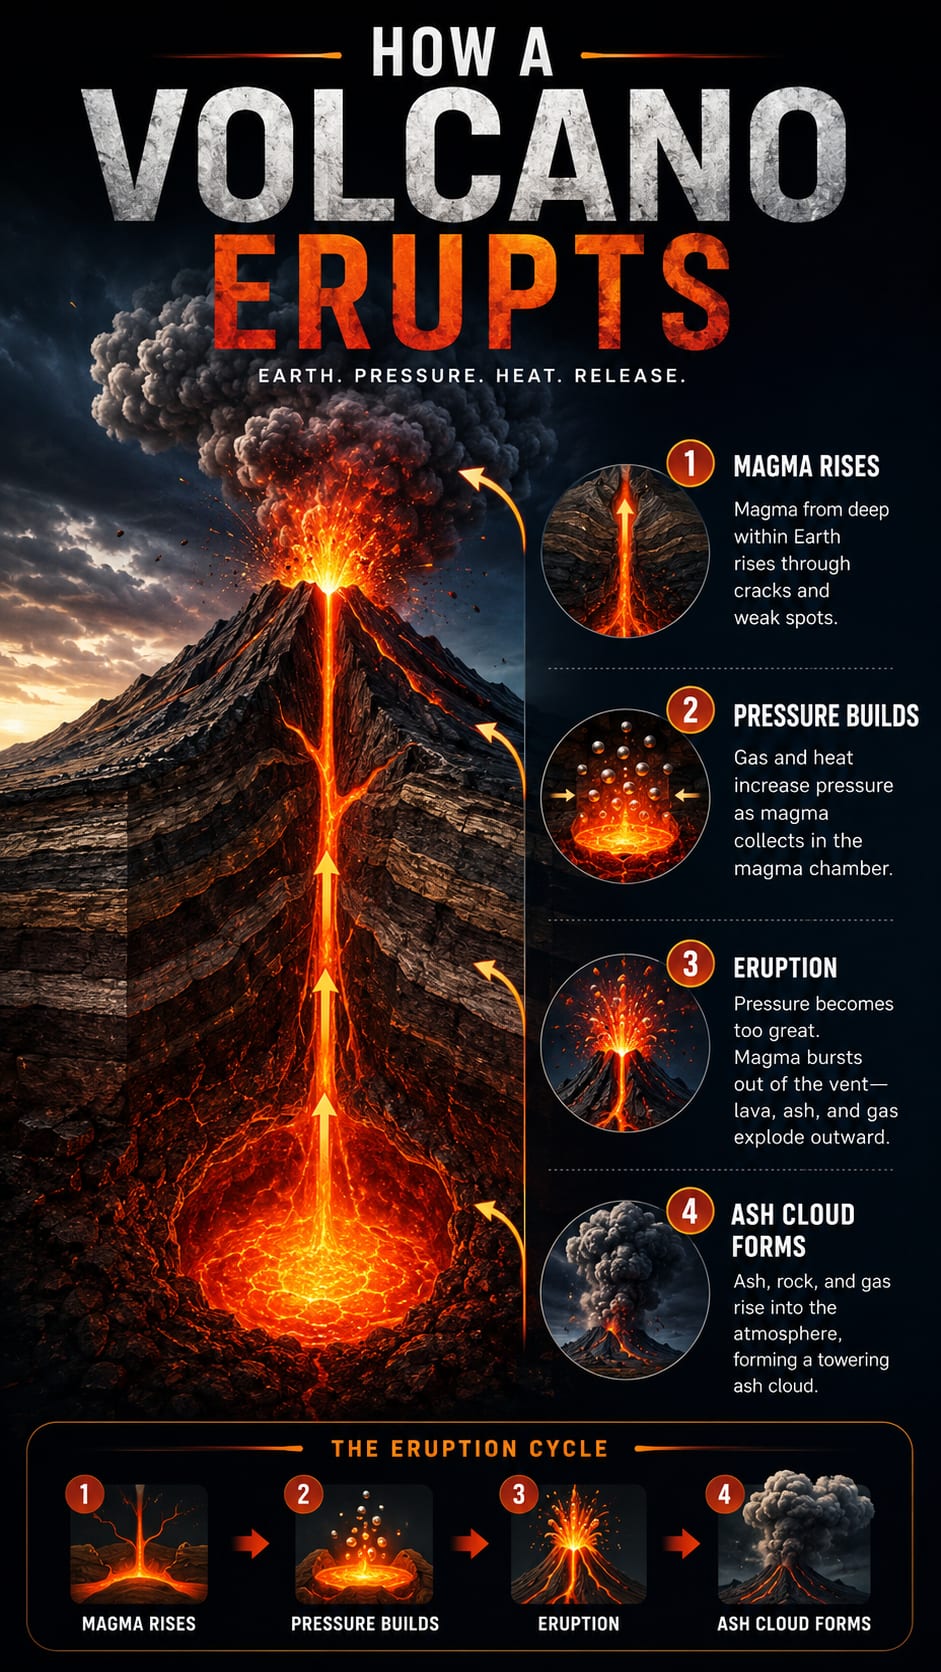
A vertical earth science visual that explains magma, pressure, vents, ash clouds, and lava flow.
Create SimilarText to infographic means turning plain text, notes, topics, or outlines into a visual layout that explains the idea clearly. KnowLens helps organize the message into sections, key points, and visual structure before creating an infographic-style visual.
Use KnowLens to turn simple text into structured visual content for learning, explaining, and sharing.
Turn lesson topics, study notes, and short explanations into classroom-ready visuals.
Explain science concepts with clear sections, labels, and visual structure.
Turn rough notes or plain text into a structured visual summary.
Create poster-style graphics for learning, presentations, and social media.
Break one idea into clear visual sections for sharing.
Turn short ideas into simple knowledge visuals that are easy to understand.
HOW IT WORKS
Start with text. KnowLens helps organize the message and generate a clear infographic-style visual.
Start with plain text, notes, a topic, a short explanation, or a rough outline.
KnowLens organizes your content into sections, key points, and a visual hierarchy.
Create an infographic, visual summary, poster-style graphic, or carousel-style visual.
Create infographic-style visuals from text for education, science communication, social media, and quick knowledge sharing.
Turn study notes and concepts into visual study guides.
Create educational infographics from lesson topics and outlines.
Explain complex topics with clear visual summaries.
Turn ideas and explanations into shareable visual content.
Create quick knowledge visuals without a designer.
Turn product ideas and campaign messages into simple visual summaries.
KnowLens starts with your text and helps structure the message before creating the visual.
Begin with plain text, notes, a topic, or an outline instead of a blank canvas.
KnowLens organizes your message into sections, key points, and visual hierarchy.
Generate infographic-style visuals, poster-style graphics, and visual summaries for different uses.
You provide the idea. KnowLens helps create a clear visual layout.
Common questions about turning text into infographics with KnowLens.
A text to infographic generator turns plain text, notes, topics, or outlines into infographic-style visuals. KnowLens helps structure your message into sections and key points before creating the visual.
Yes. You can start with plain text, notes, a topic, or a short explanation and generate an infographic, visual summary, poster-style graphic, or carousel-style visual.
You can use plain text, notes, a short explanation, a topic, or a rough outline.
No. KnowLens helps organize your text and turn it into a clear visual layout.
Yes. KnowLens can help create educational infographics, science visuals, visual study guides, and classroom-ready summaries.
Yes. You can create poster-style visuals and carousel-style graphics for social platforms, blogs, and presentations.
A normal infographic maker usually starts with templates. KnowLens starts with your text, organizes the message, and turns it into structured visual information.
No. You can use it for education, science, product ideas, recipes, study notes, business concepts, and general knowledge topics.
Start with plain text, notes, a topic, or an outline. Generate a clear infographic, poster, or visual summary in minutes.