
SCIENCE VISUAL LEARNING
Science Infographic Generator for Clear Visuals
Turn science topics, notes, or plain text into clear science infographics with readable labels, structured sections, and visual hierarchy.
Start with notes or a topic. KnowLens structures the visual.
Science Infographic Examples
Explore science infographics and visual summaries created from topics, notes, and short text prompts.
Biology Infographic16:9
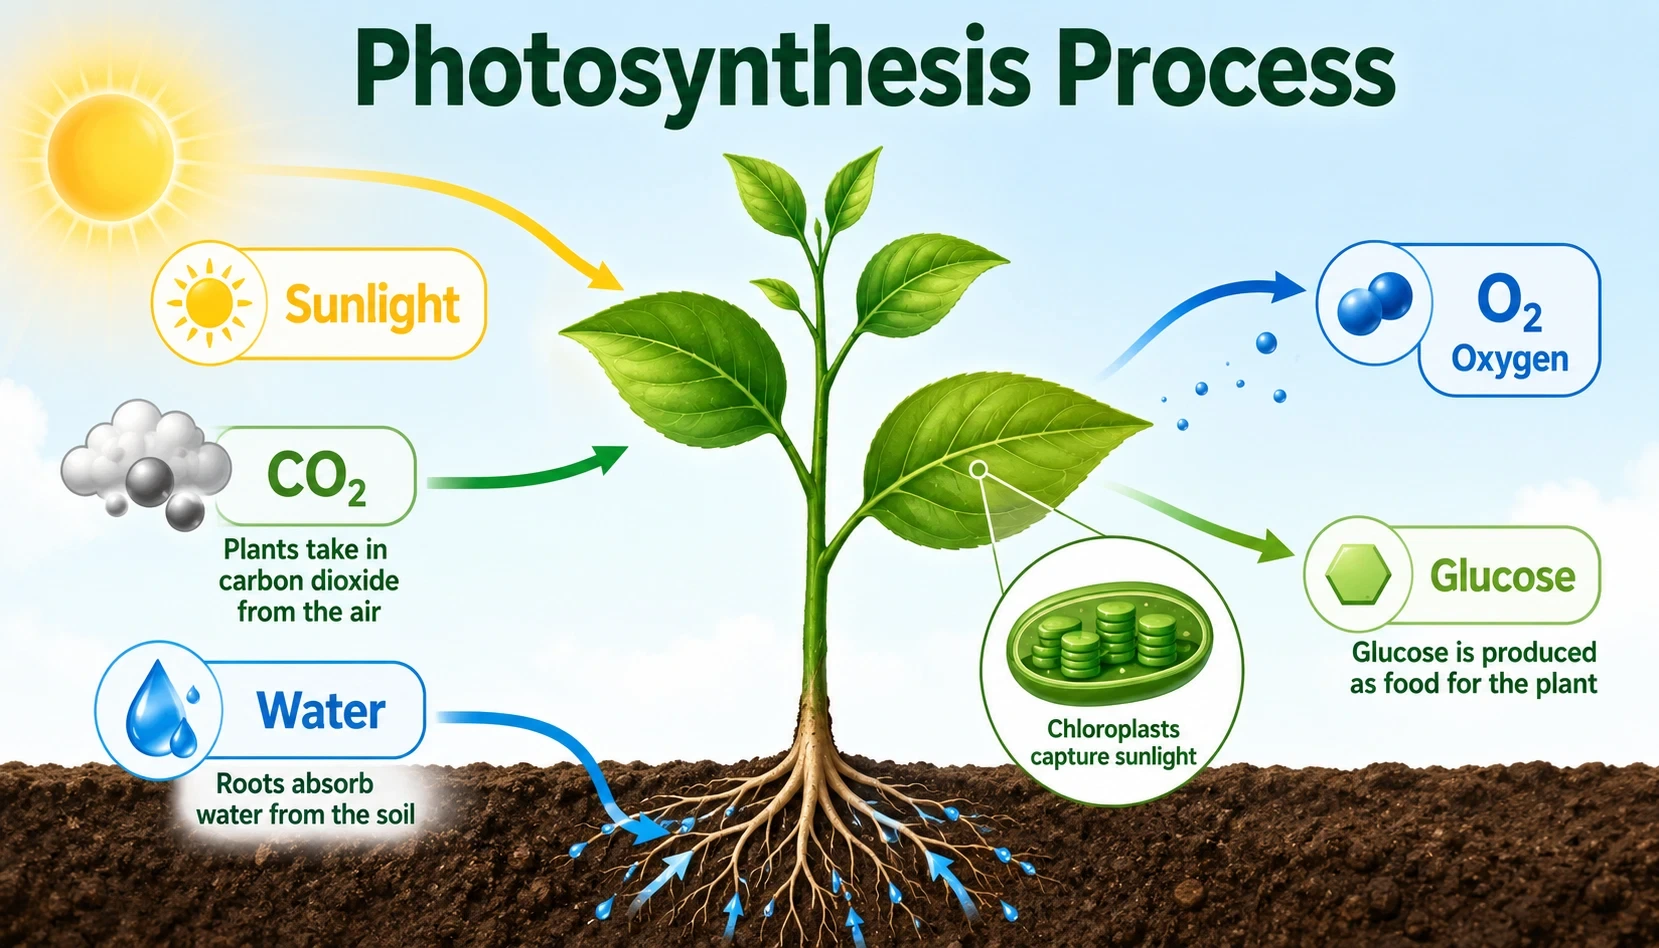
Photosynthesis Process
A biology infographic showing sunlight, water, carbon dioxide, chloroplasts, glucose, and oxygen outputs.
Create Similar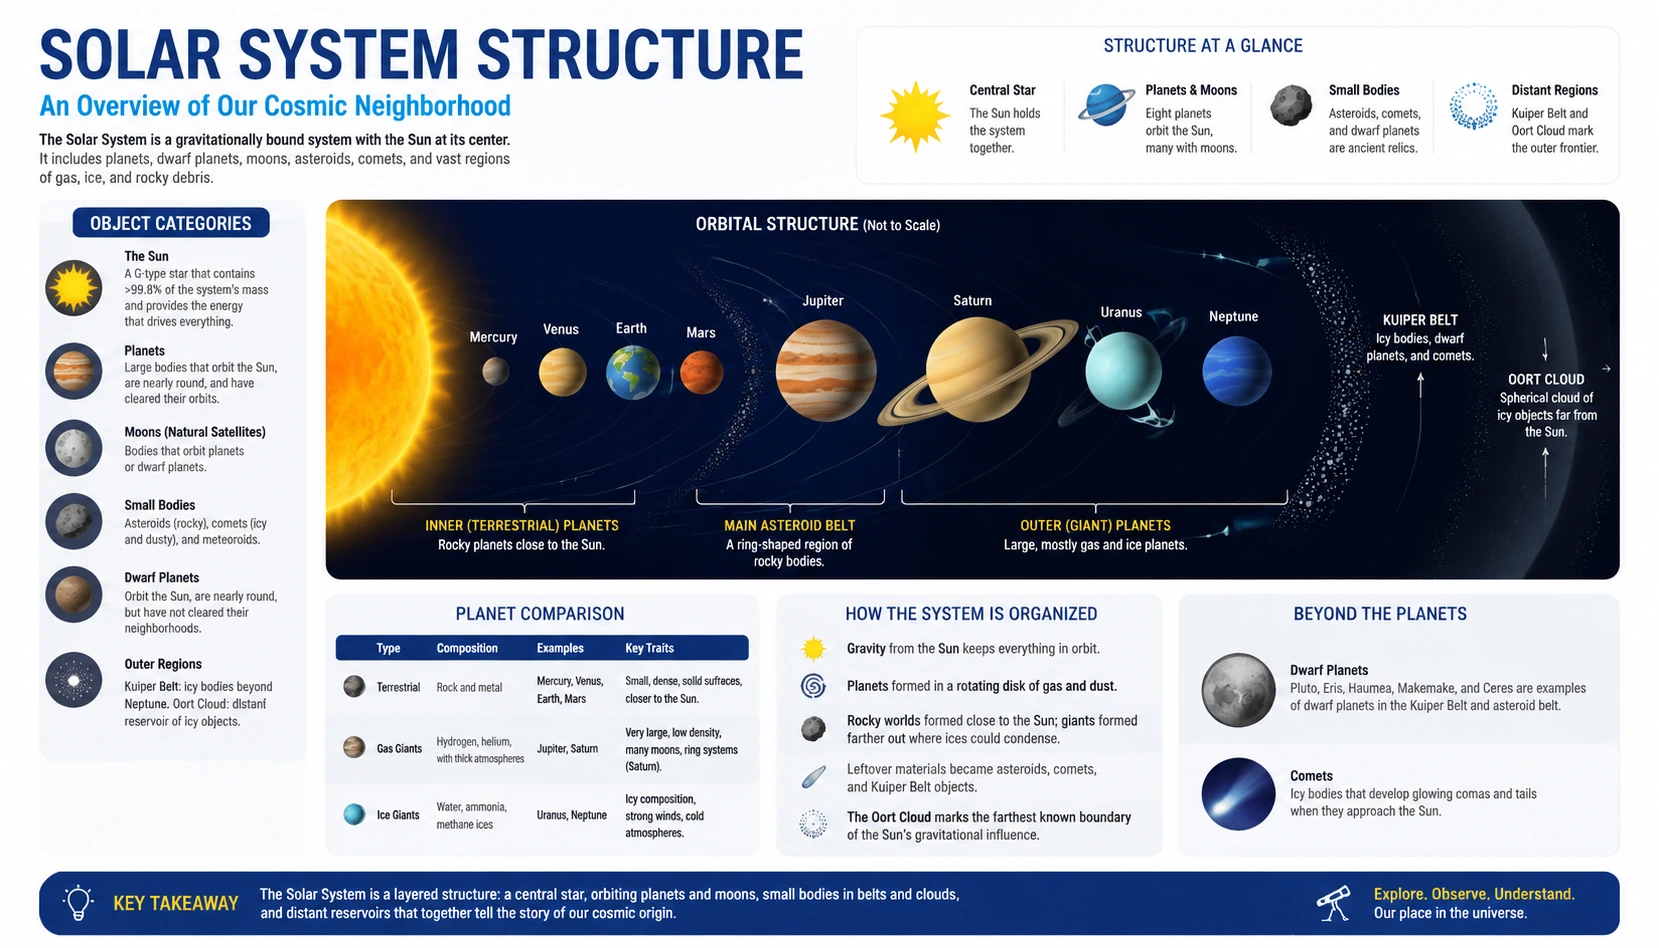
Astronomy Infographic16:9
Solar System Structure
An astronomy visual that organizes the Sun, inner planets, outer planets, orbits, and relative space relationships.
Create Similar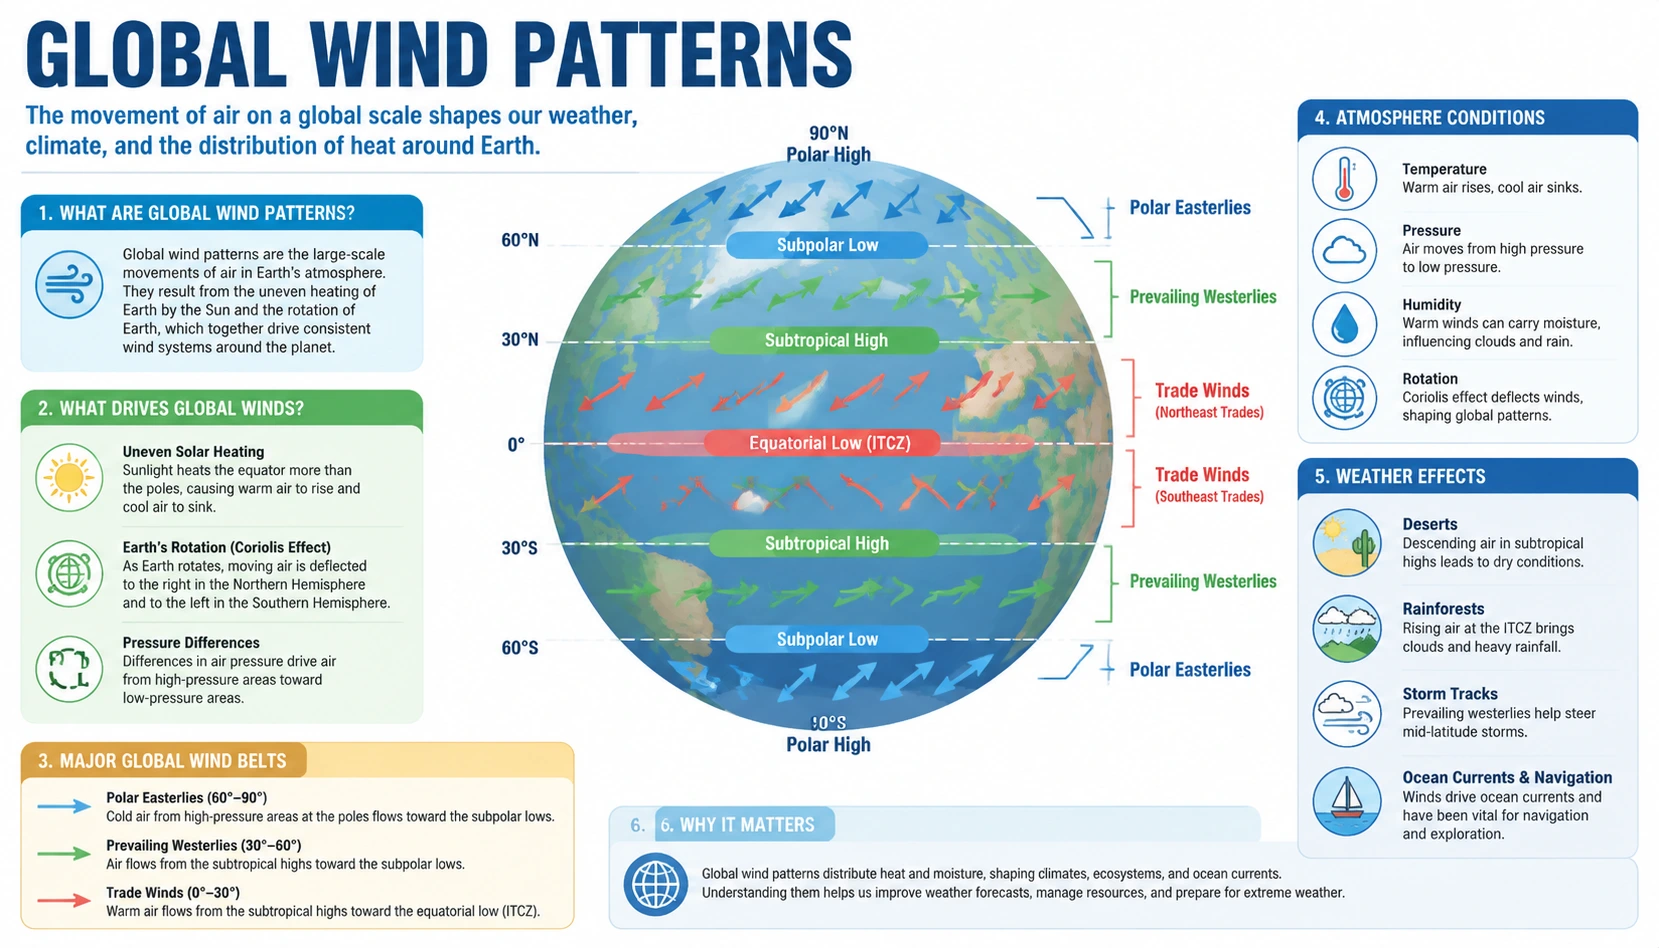
Earth Science16:9
Global Wind Patterns
An earth science infographic explaining trade winds, westerlies, polar easterlies, pressure belts, and circulation bands.
Create Similar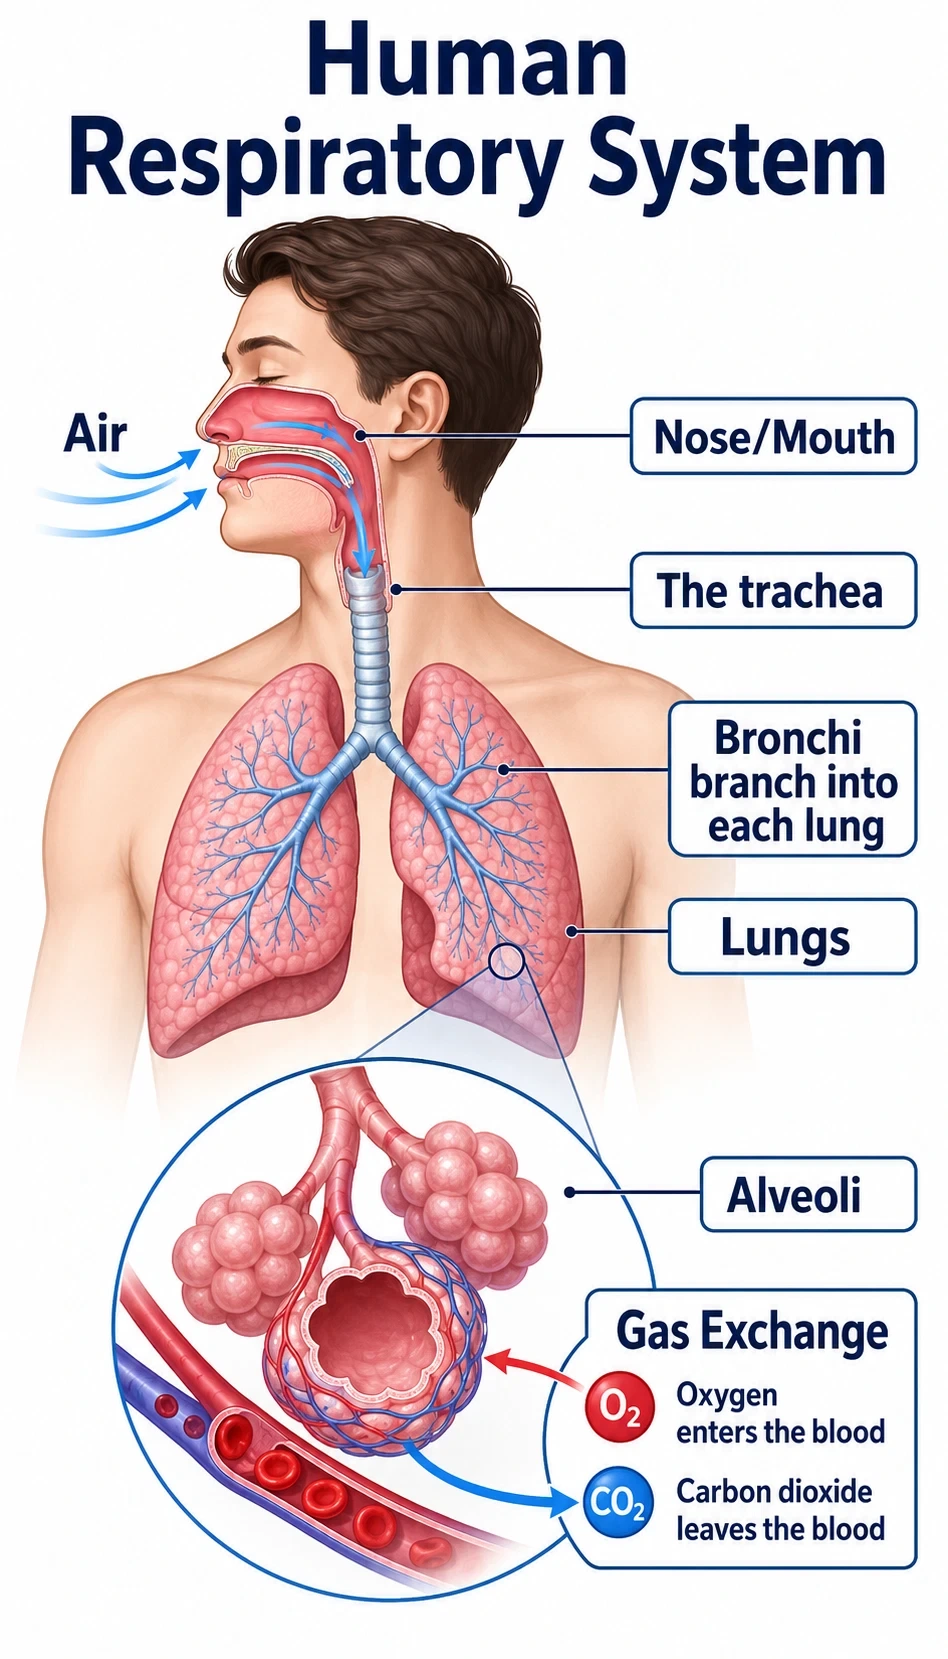
Biology Infographic9:16
Human Respiratory System
A biology guide showing airflow through the nose, trachea, bronchi, lungs, alveoli, and gas exchange.
Create Similar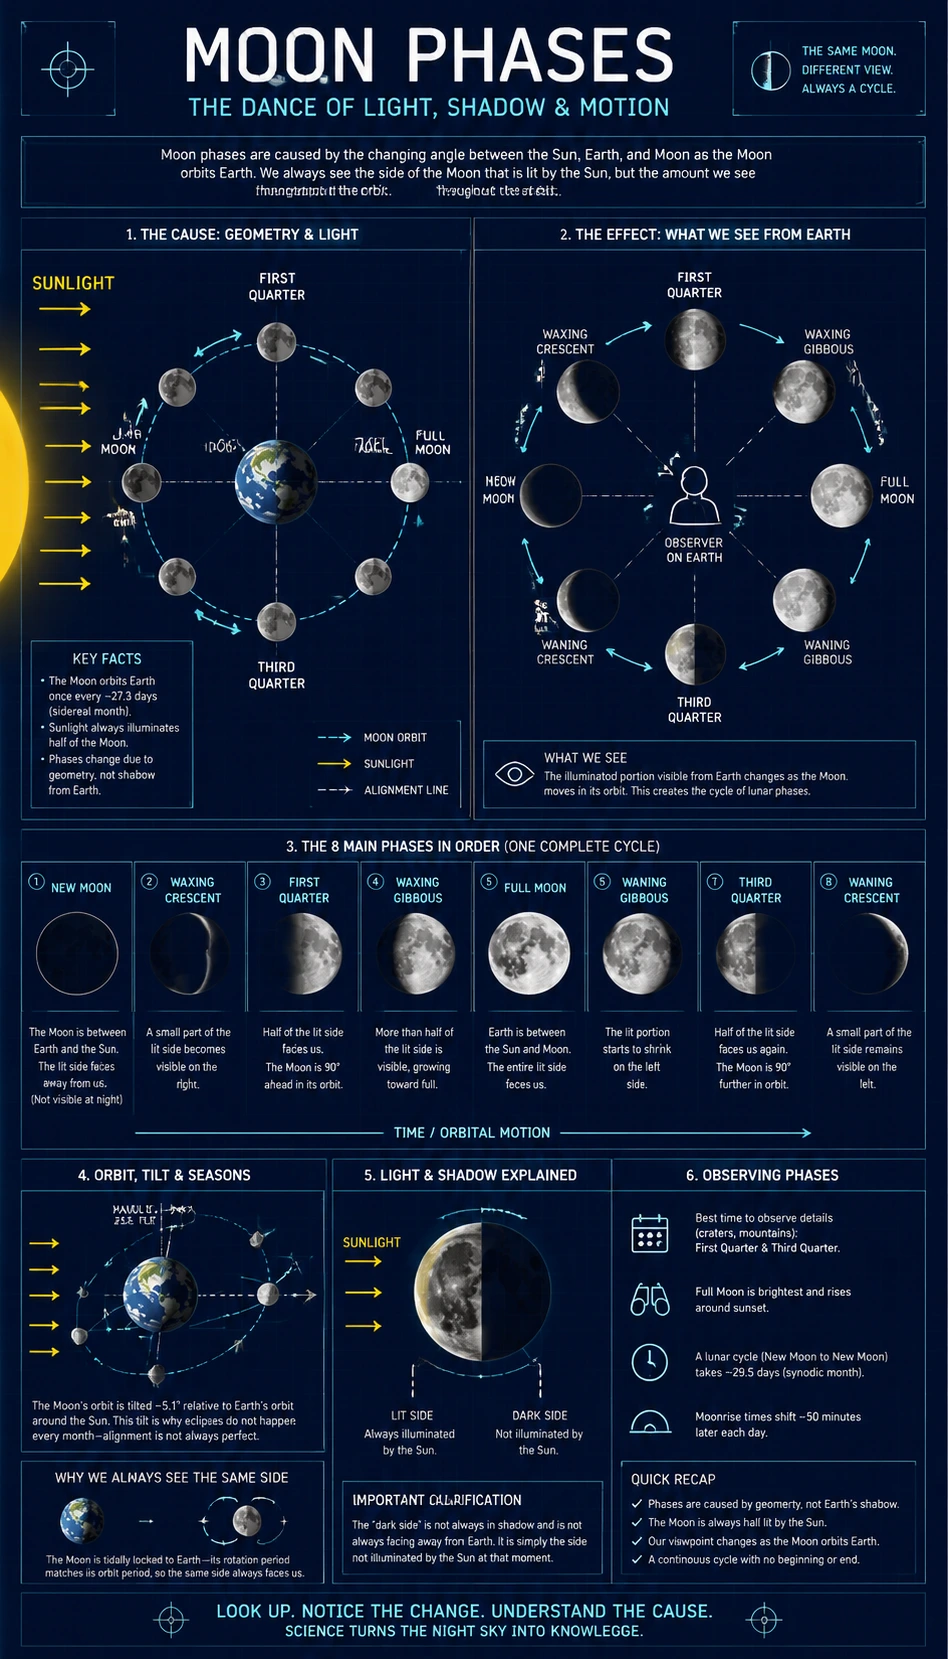
Astronomy Infographic9:16
Moon Phases
An astronomy infographic that explains the repeating lunar phase cycle and the Sun-Earth-Moon relationship.
Create Similar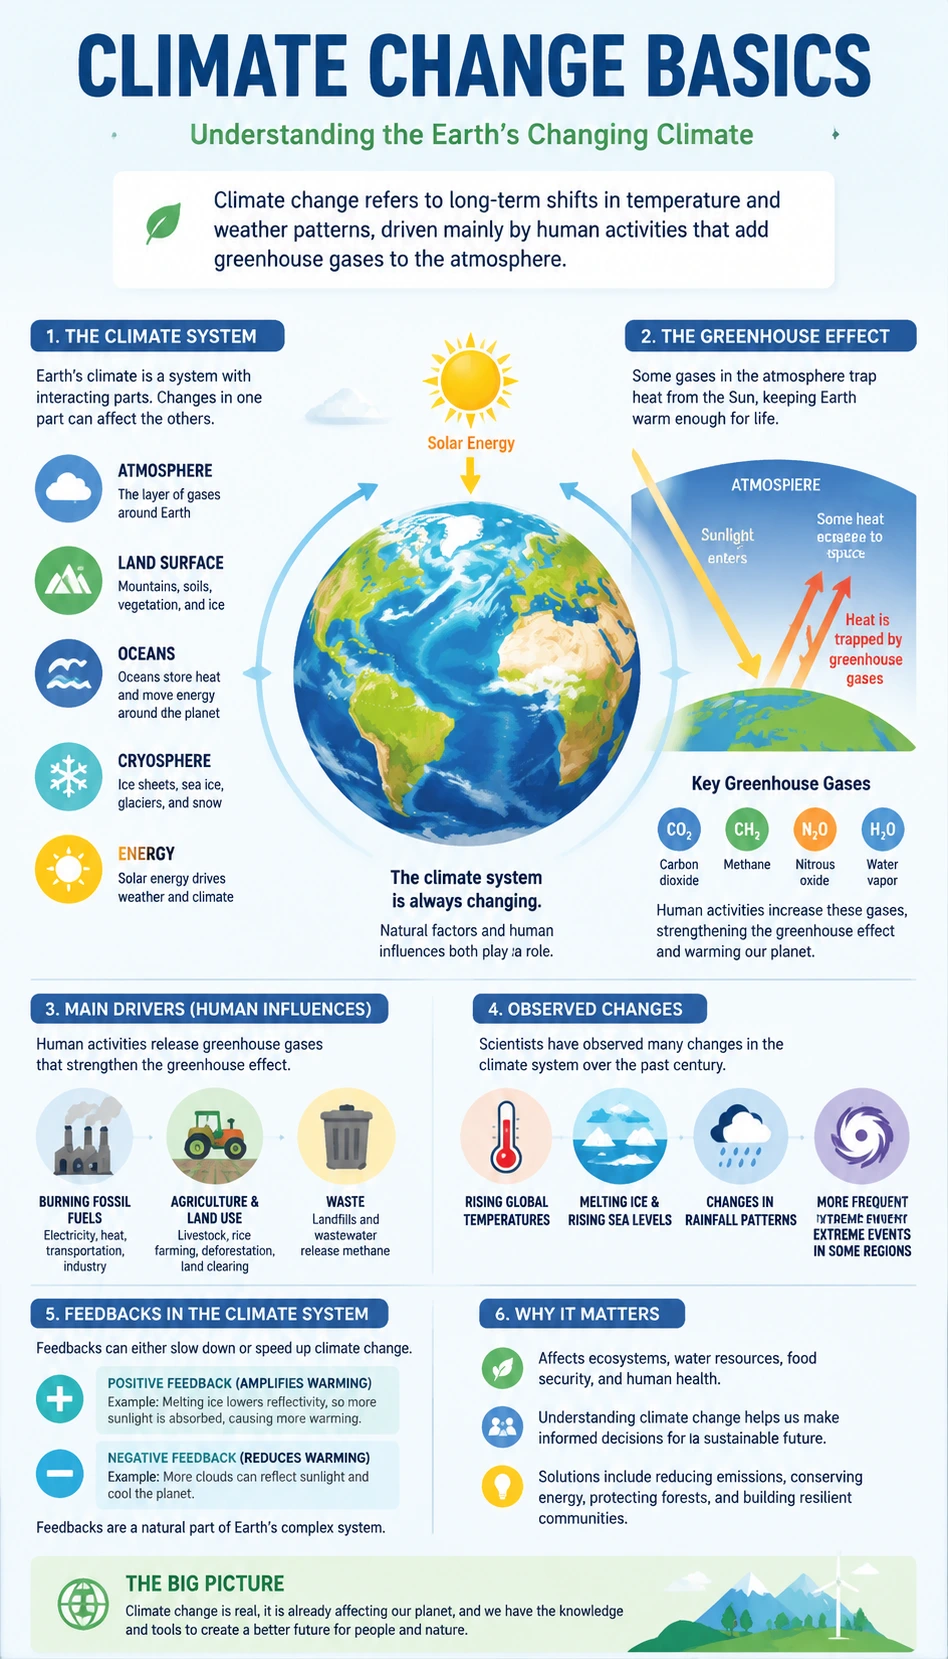
Earth Science9:16
Climate Change Basics
An earth science visual explaining greenhouse gases, warming trends, feedback loops, and climate impacts.
Create SimilarWhat is a Science Infographic Generator?
A science infographic generator helps turn science topics, notes, and explanations into structured visual summaries. KnowLens organizes the content into key points, readable labels, clear sections, and visual hierarchy so the concept is easier to understand and share.
Create Science Infographics for Clear Learning
Use KnowLens to turn science ideas into structured visuals for studying, teaching, explaining, and sharing.
Biology Infographics
Turn biology topics like photosynthesis, cells, DNA, ecosystems, and human body concepts into visual summaries.
Physics Infographics
Explain forces, motion, energy, waves, electricity, and space concepts with structured visual layouts.
Chemistry Infographics
Create visual explanations for atoms, molecules, reactions, bonds, and lab concepts.
Astronomy Infographics
Turn astronomy topics into visuals about planets, eclipses, stars, galaxies, and space systems.
Earth Science Infographics
Explain volcanoes, earthquakes, weather, climate, rocks, oceans, and natural systems with clear sections.
Classroom Science Visuals
Create science visuals that help students review key ideas and understand complex topics faster.
HOW IT WORKS
Create a Science Infographic in 3 Steps
Start with a science topic or explanation. KnowLens helps organize the idea into a clear visual structure.
Add a Science Topic or Text
Start with a science topic, study notes, a short explanation, or plain text.
Structure the Concept
KnowLens organizes the science idea into sections, key points, labels, and visual hierarchy.
Generate the Infographic
Create a science infographic, visual summary, poster-style science visual, or carousel-style science visual.
Science Topics You Can Turn into Infographics
Start with a complete explanation or a short topic. Add key points, steps, facts, or examples for better results.
Prompt 1
Explain photosynthesis in 5 key steps for middle school students.
Prompt 2Create a science infographic about the water cycle, including evaporation, condensation, and precipitation.
Prompt 3Turn these notes about DNA replication into a clear visual summary.
Prompt 4Explain how volcanoes form and erupt using simple labels and sections.
Prompt 5Create a visual summary of the solar system for a classroom poster.
Prompt 6Explain Newton's laws of motion with examples and simple visuals.
Prompt 7Create a chemistry infographic about atoms, molecules, and chemical bonds.
Prompt 8Make an infographic about ecosystems, food chains, and energy flow.
Prompt 9Explain how a solar eclipse happens using a step-by-step visual layout.
Prompt 10Create an earth science infographic about plate tectonics and earthquakes.
For best results, include the audience, key facts, steps, and examples you want to show in the infographic.
Built for Science Learning and Communication
Use the science infographic generator when a complex idea needs to become clear, visual, and easy to review.
Students
Turn science notes and concepts into visual study guides that make review easier before class, exams, or presentations.
Study guides
Teachers
Create classroom-ready science visuals from lesson topics, short explanations, and key facts students need to remember.
Classroom visuals
Science Communicators
Explain complex ideas with structured labels, clear sections, and visual summaries built for public understanding.
Science communication
Content Creators
Turn science topics into shareable educational visuals for social platforms, blogs, and learning newsletters.
Educational content
Tutors
Create simple science visuals that help learners see steps, systems, comparisons, and cause-and-effect relationships.
Tutoring aids
Learning Teams
Create quick science posters and knowledge visuals without waiting for design support.
Learning materials
Designed for Readable Science Infographics
KnowLens is built for visual explanation, not generic AI art.
Readable Labels
Create science visuals with clear headings, labels, and short text blocks that are easier to scan.
Structured Concepts
Organize science topics into steps, systems, comparisons, processes, or key facts.
Clear Visual Hierarchy
Emphasize the most important ideas with sections, spacing, titles, and visual grouping.
Content-First Visuals
Start from a science explanation or topic instead of a blank canvas.
Built for Learning
Create visuals for studying, teaching, reviewing, and sharing science ideas.
FAQ
Common questions about creating science infographics with KnowLens.
What is a science infographic generator?
A science infographic generator turns science topics, notes, or plain text into structured visual summaries. KnowLens helps organize the content into key points, readable labels, and a clear visual hierarchy.
Can I create science infographics from text?
Yes. You can start with a science topic, notes, or plain text, and KnowLens can help turn it into a science infographic, visual summary, or poster-style science visual.
What science topics can I visualize?
You can create visuals for biology, physics, chemistry, astronomy, earth science, ecosystems, human body concepts, space topics, natural systems, and general science ideas.
Do I need design skills?
No. KnowLens helps organize your science explanation into a clear visual layout, so you do not need to start from a blank canvas or design template.
Can teachers use this for classroom visuals?
Yes. Teachers can use KnowLens to create classroom-ready science infographics, study visuals, science posters, and visual summaries from lesson topics or notes.
Can students use it for study guides?
Yes. Students can turn notes and science concepts into visual study guides that are easier to review.
Is this only for biology?
No. KnowLens can help create infographics for biology, physics, chemistry, astronomy, earth science, and other science topics.
How is KnowLens different from a normal infographic maker?
A normal infographic maker usually starts with templates. KnowLens starts with your science topic or text, organizes the message, and turns it into structured visual information.
How is KnowLens different from a generic AI image generator?
Generic AI image tools often focus on decorative images. KnowLens focuses on structured science visuals with readable labels, clear sections, and infographic-style layouts.
What should I include in my input?
For best results, include the science topic, key facts, important steps, examples, and the audience you want to explain it to.
Related Infographic Tools
Explore nearby KnowLens tools for turning text and topics into structured visuals.
Create a Clear Science Infographic
Start with a science topic, notes, or plain text. Generate a structured science infographic, visual summary, or poster-style visual in minutes.