Hydrology16:9
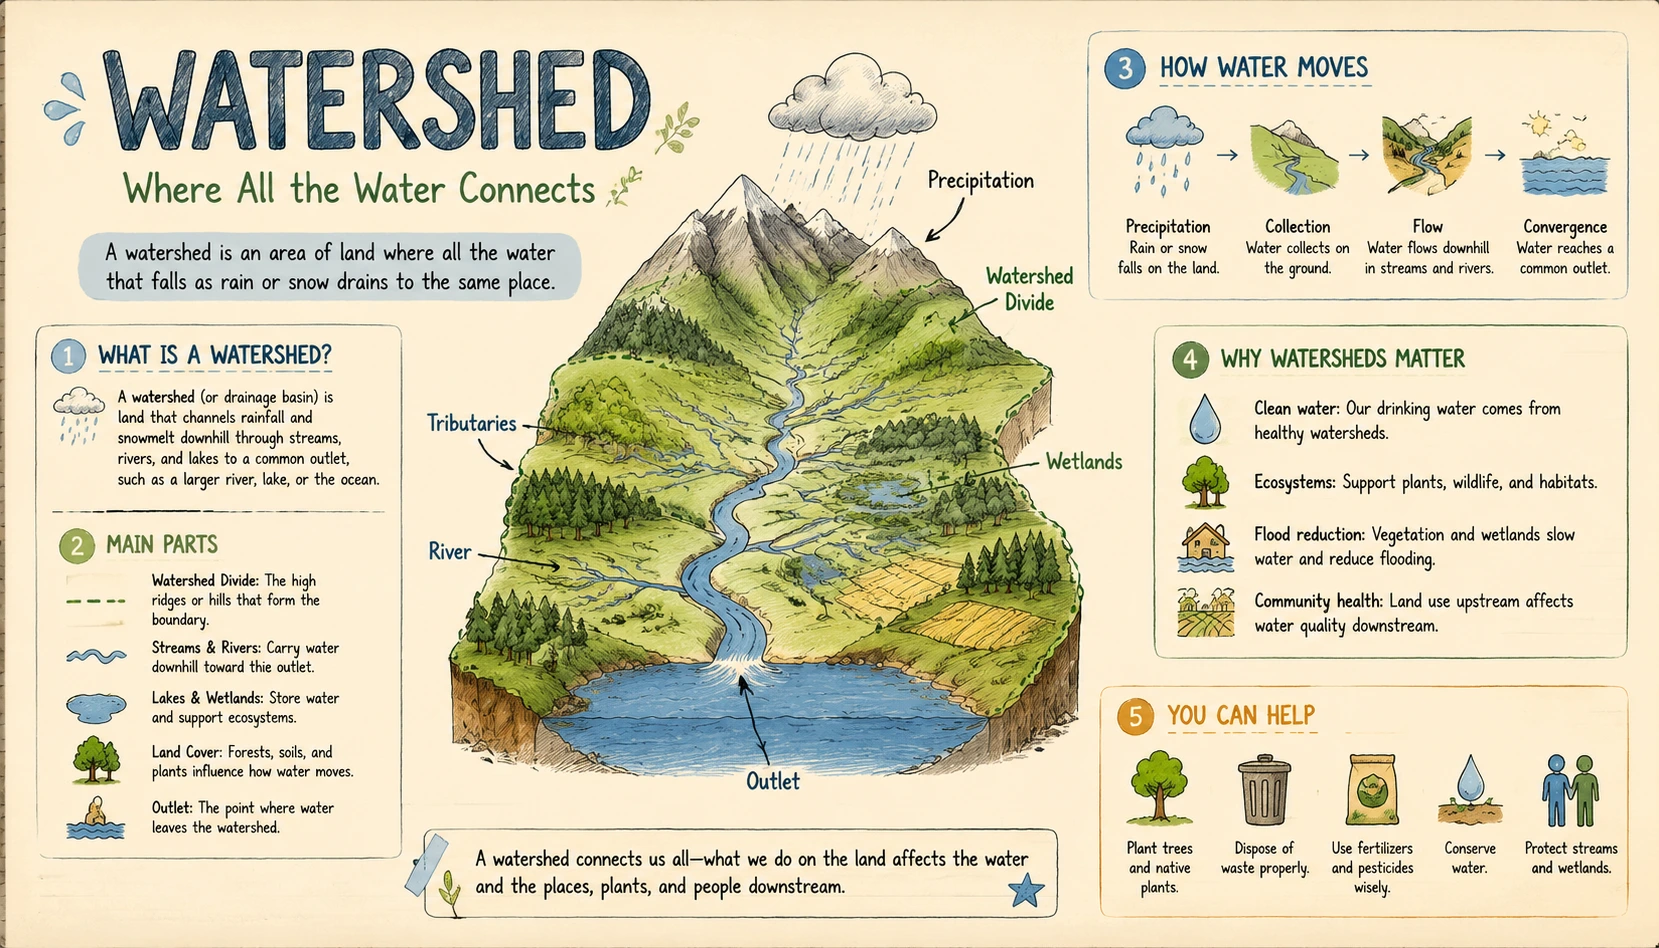
Watershed Infographic
A hydrology visual that maps drainage boundaries, runoff, groundwater flow, streams, and connected river systems.
Create SimilarTurn Earth Science topics, notes, or plain text into clear infographics with readable labels, structured sections, and visual hierarchy.
Start with notes or a topic. KnowLens structures the visual.
Explore Earth Science infographics and visual summaries created from topics, notes, and short text prompts.
A hydrology visual that maps drainage boundaries, runoff, groundwater flow, streams, and connected river systems.
Create Similar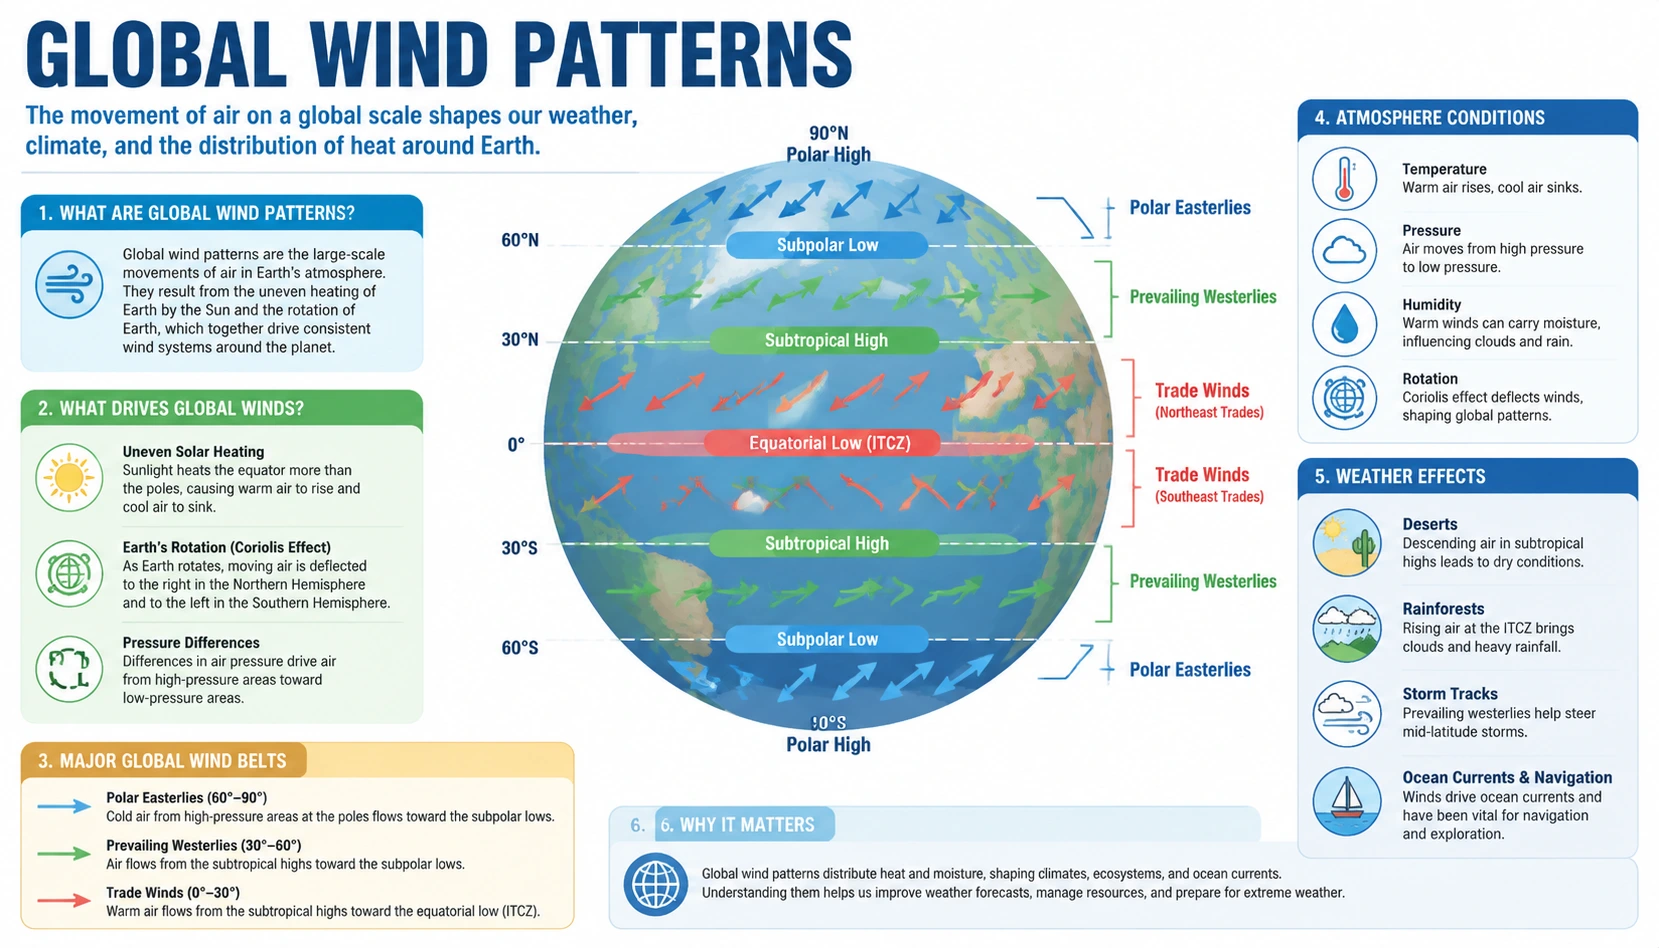
An atmosphere infographic that explains trade winds, westerlies, polar easterlies, pressure belts, and global circulation.
Create Similar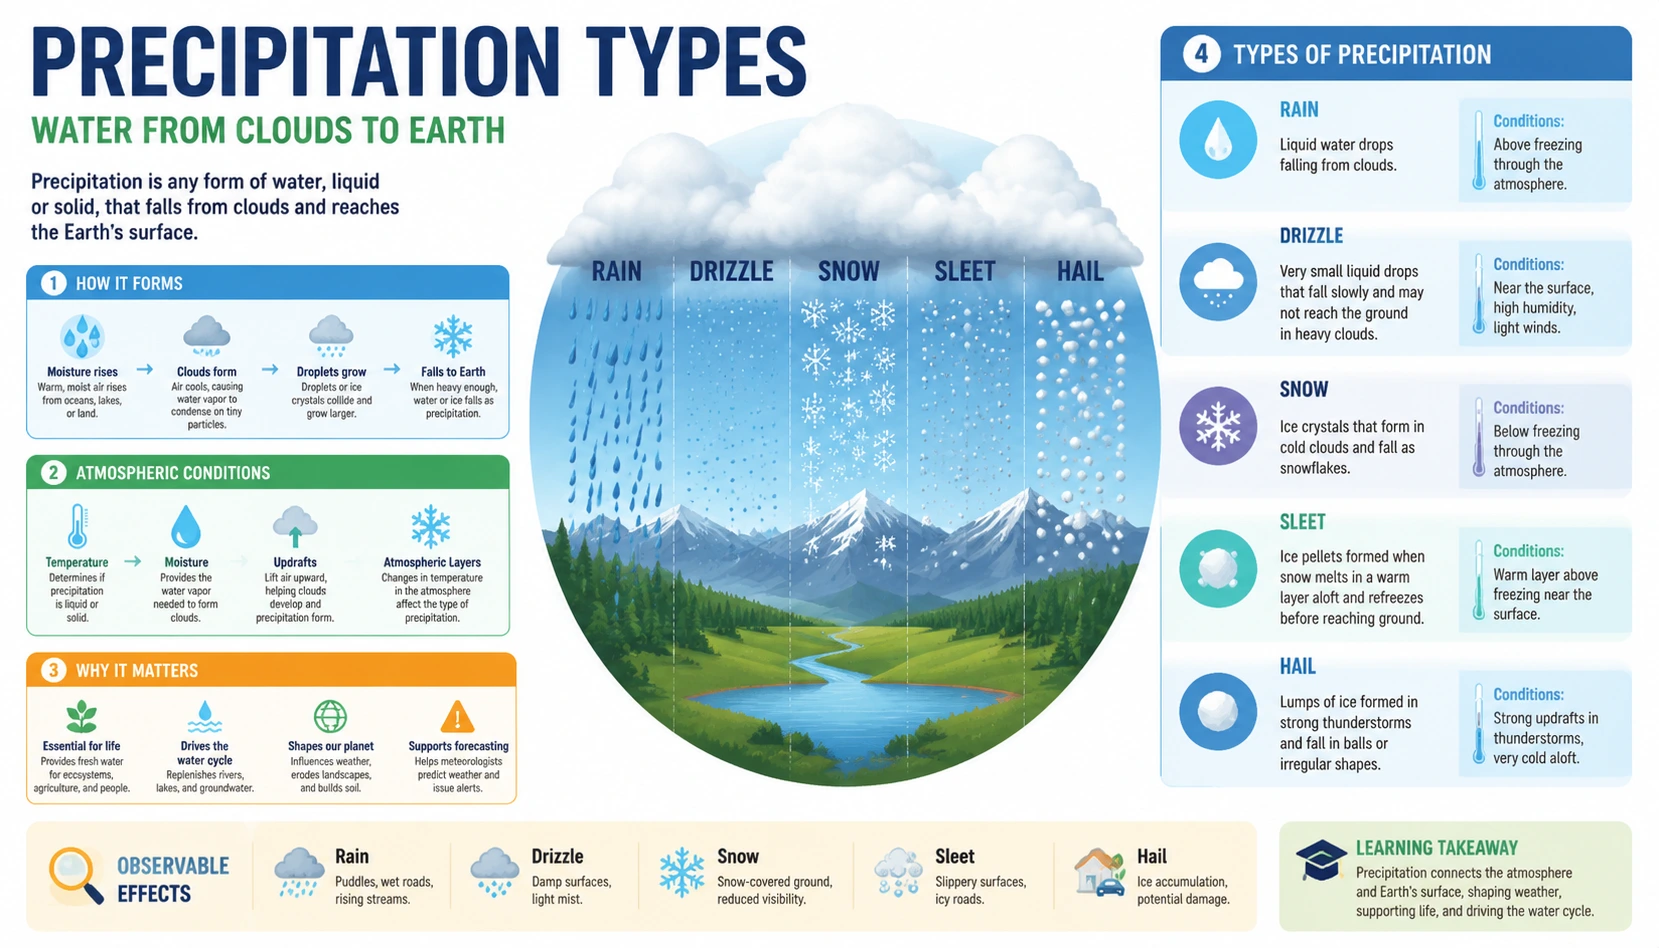
A weather visual that compares rain, snow, sleet, freezing rain, and hail using cloud and temperature-layer cues.
Create Similar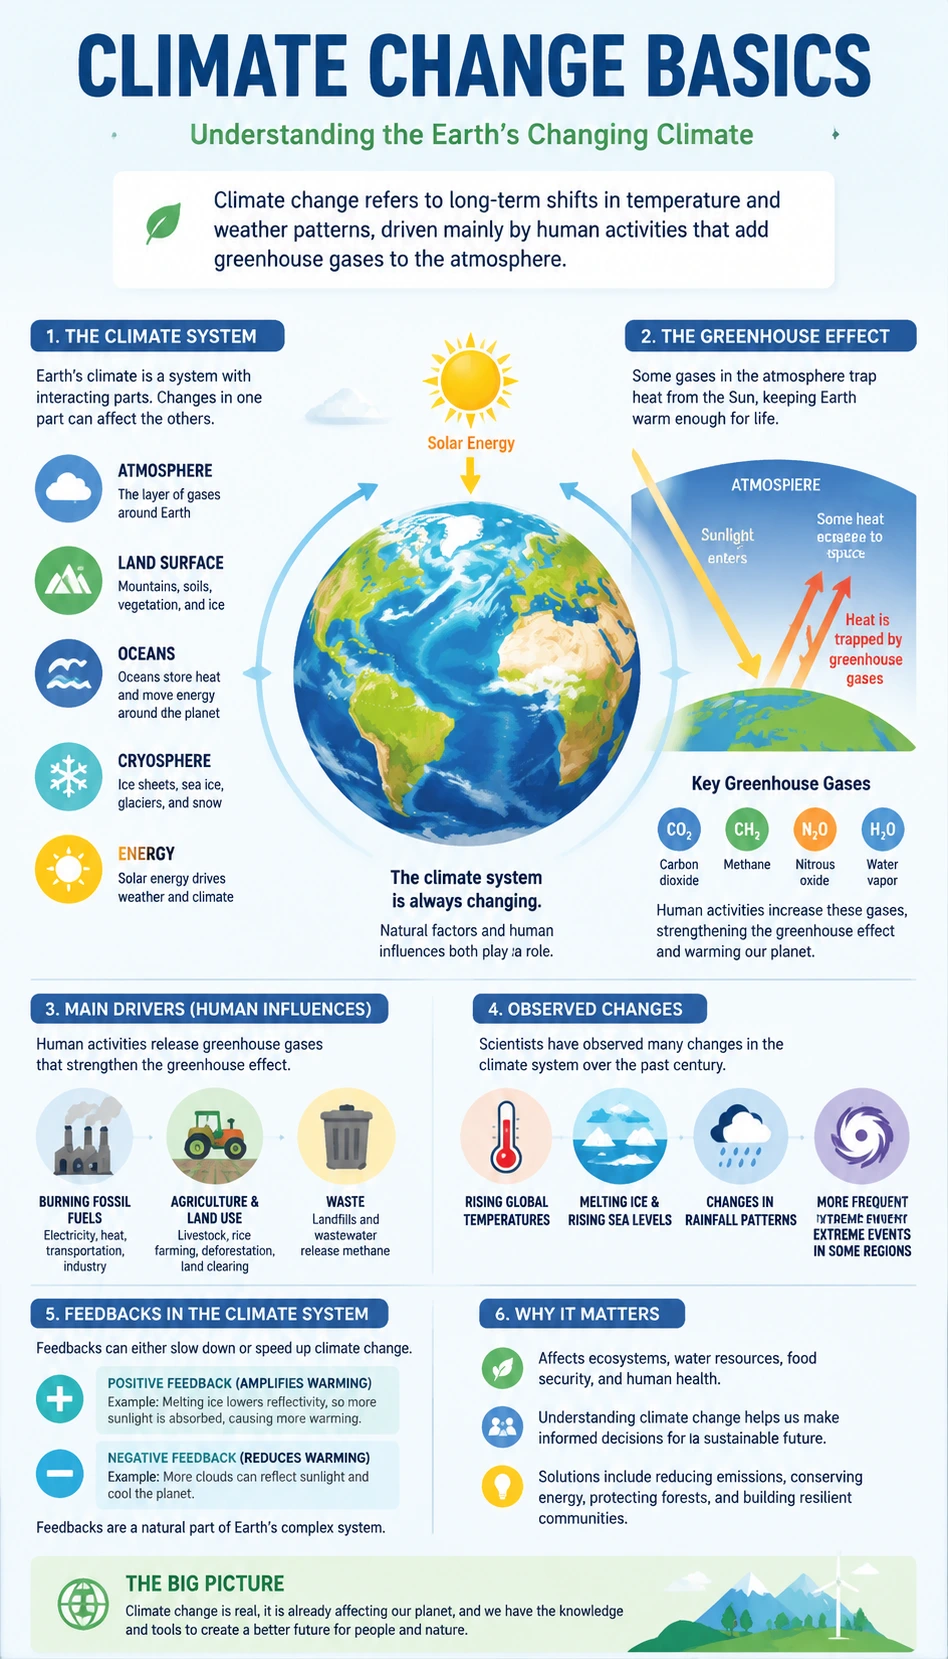
A climate science infographic that organizes greenhouse gases, warming trends, feedback loops, and major climate impacts.
Create Similar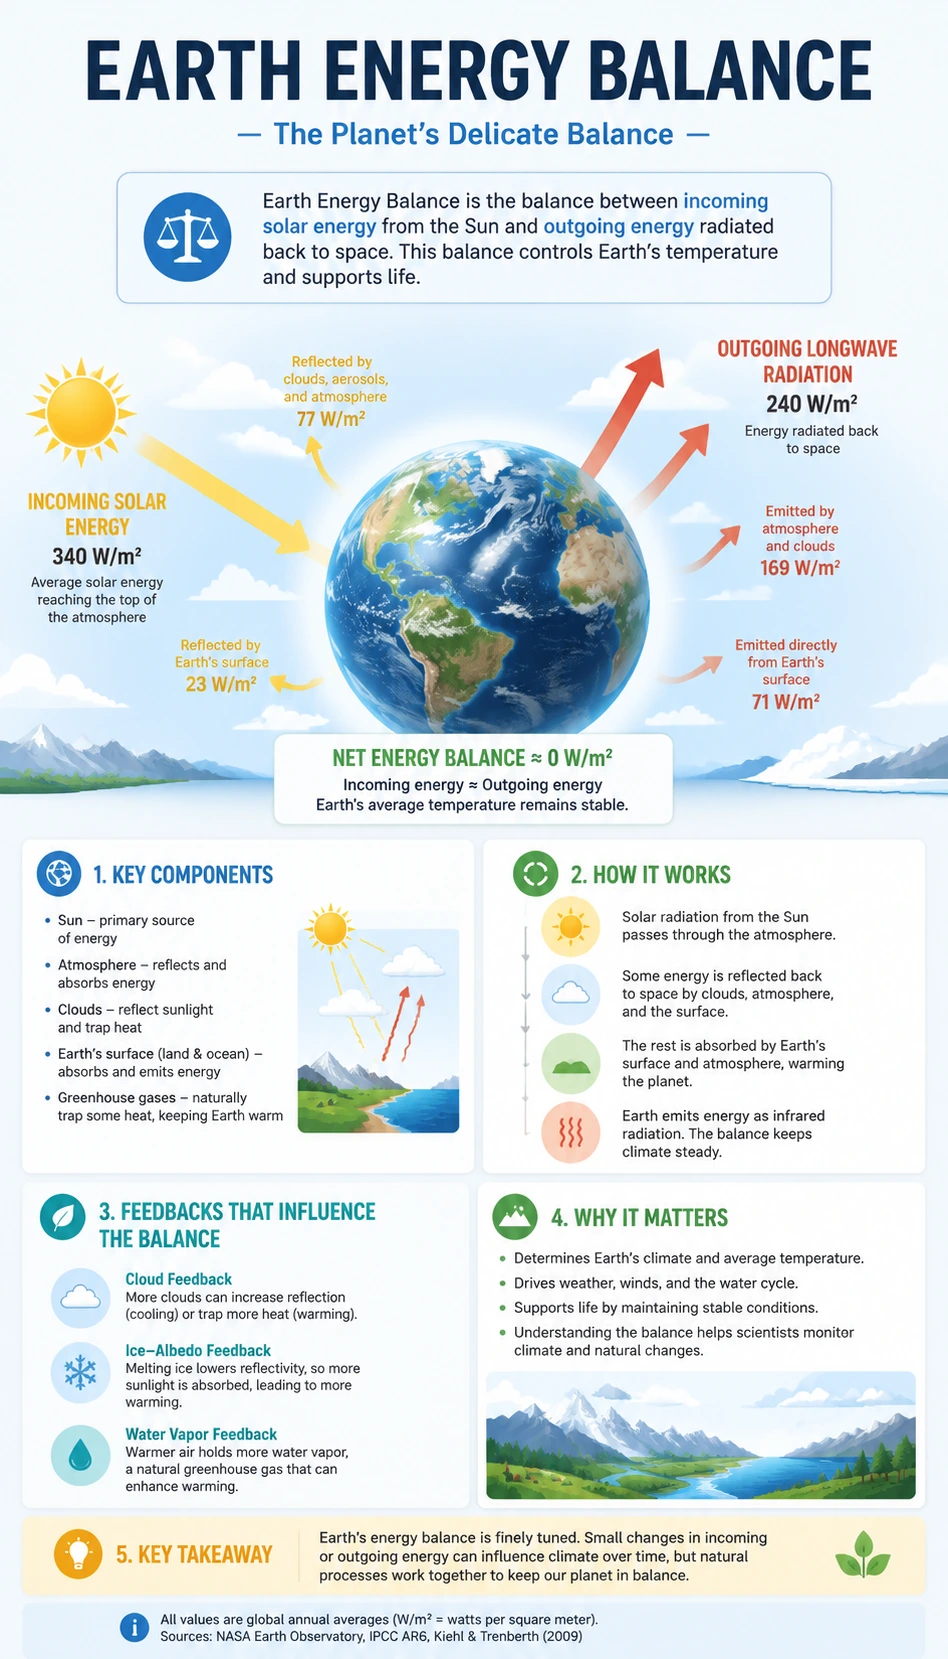
A structured guide to incoming sunlight, reflection, absorption, outgoing heat, and atmosphere interactions.
Create Similar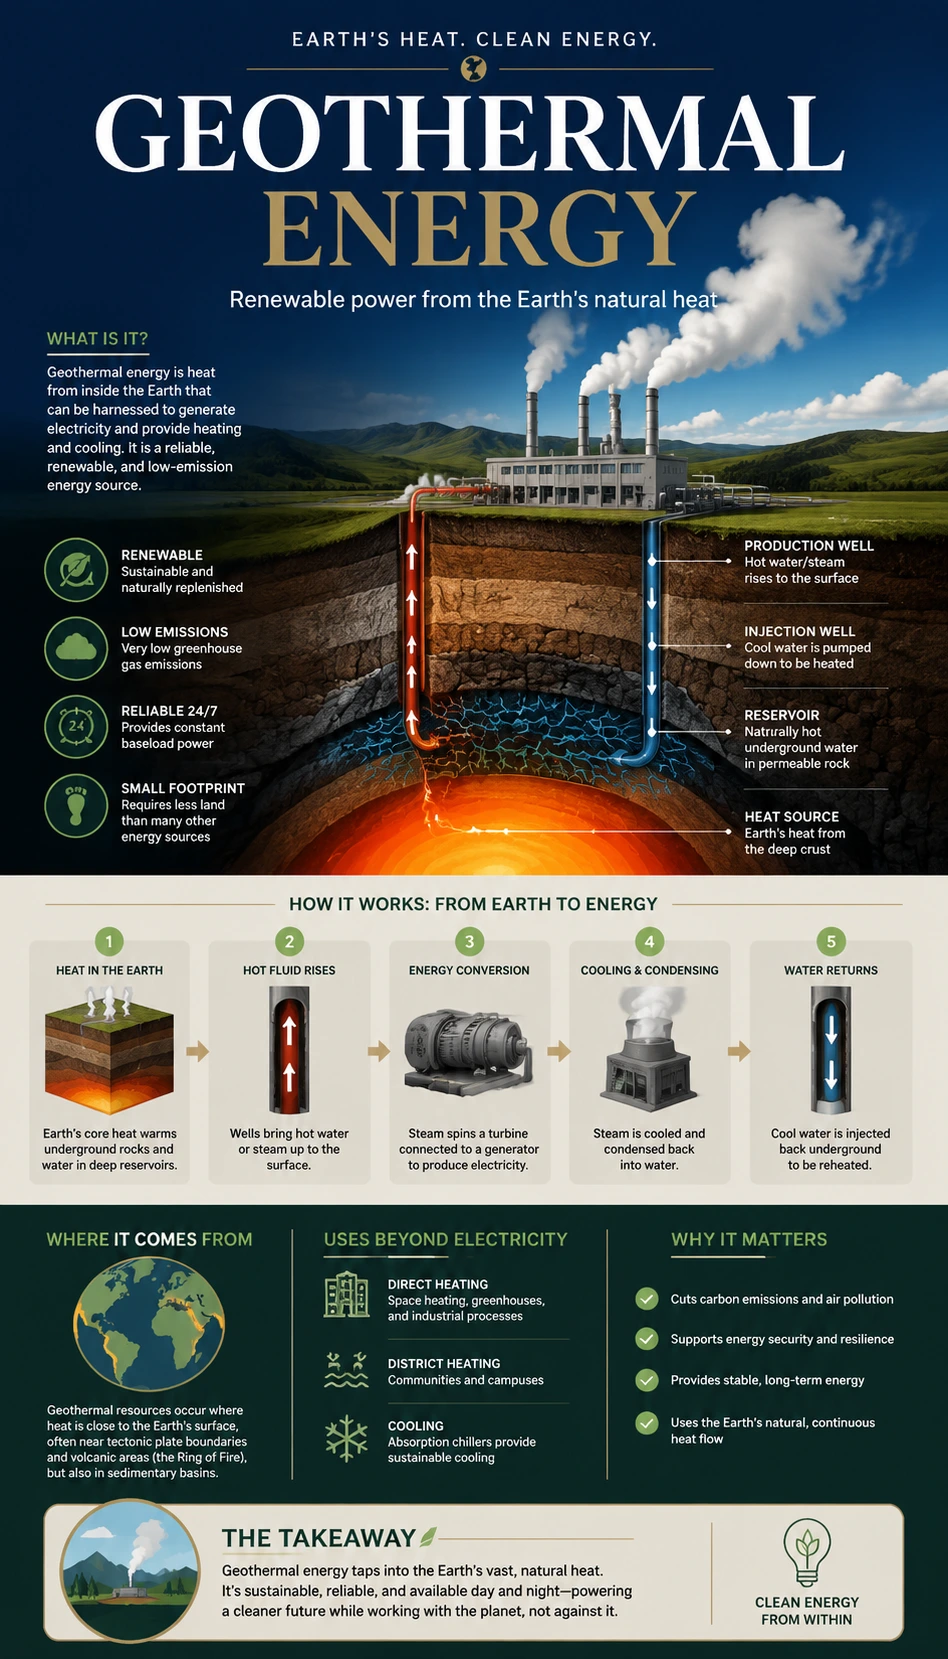
A renewable energy process infographic that shows underground heat, wells, turbines, and electricity generation steps.
Create SimilarClear visual learning
An Earth Science infographic generator helps turn Earth Science topics, notes, and explanations into structured visual summaries. KnowLens organizes the content into key points, readable labels, clear sections, and visual hierarchy so Earth systems and natural processes are easier to understand and share.
Use KnowLens to turn Earth Science ideas into structured visuals for studying, teaching, explaining, and sharing.
Turn Earth systems, natural cycles, and physical processes into structured visual summaries.
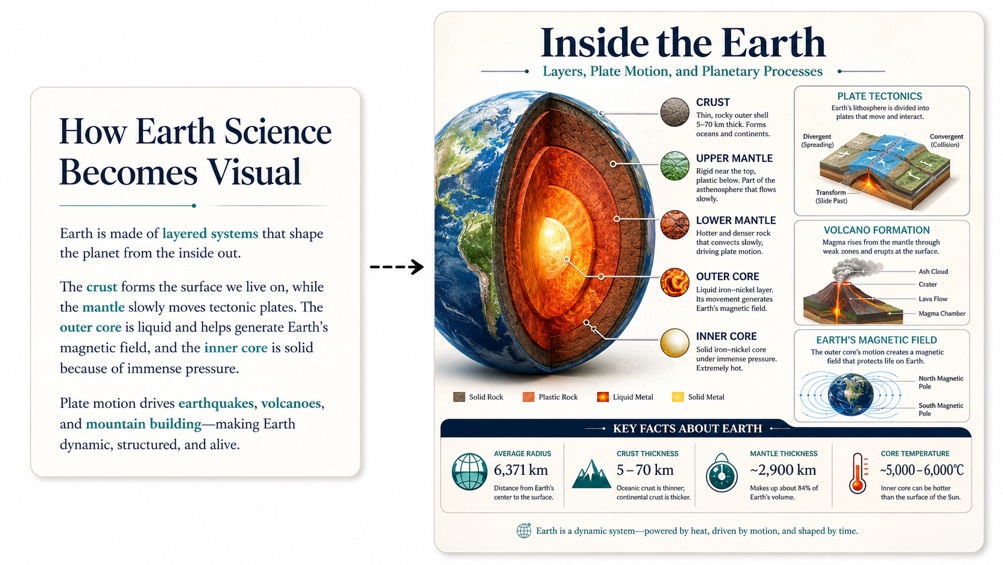
Explain rocks, minerals, landforms, Earth structure, and geological processes with clear sections and labels.
Create visuals for weather patterns, climate concepts, atmosphere topics, and environmental change.
Turn ocean, water movement, and Earth water system concepts into readable visual summaries.
Explain natural hazards and Earth processes with visual steps, labels, and cause-effect structure.
Create Earth Science visuals that help students review key ideas and understand complex topics faster.
Start with an Earth Science topic or explanation. KnowLens helps organize the idea into a clear visual structure.
Start with an Earth Science topic, study notes, a short explanation, or plain text.
KnowLens organizes the Earth Science idea into sections, key points, labels, and visual hierarchy.
Create an Earth Science infographic, visual summary, poster-style Earth Science visual, or carousel-style Earth Science visual.
Prompt starters
Start with a complete explanation or a short topic. Add key points, steps, facts, or examples for better results.
For best results, include the audience, key facts, steps, examples, and the Earth Science concept you want to explain.
Use the Earth Science infographic generator when a complex Earth system or natural process needs to become clear, visual, and easy to review.
Turn Earth Science notes and concepts into visual study guides.
Create classroom-ready Earth Science visuals from lesson topics and explanations.
Explain natural systems and Earth processes with structured labels, sections, and visual summaries.
Turn Earth Science topics into shareable educational visuals for blogs and social platforms.
Create simple Earth Science visuals that help students understand difficult concepts.
Create quick Earth Science posters and knowledge visuals without a designer.
KnowLens is built for visual explanation, not generic AI art.
Create Earth Science visuals with clear headings, labels, and short text blocks that are easier to scan.
Organize Earth Science topics into systems, processes, cycles, comparisons, or key facts.
Emphasize the most important ideas with sections, spacing, titles, and visual grouping.
Start from an Earth Science explanation or topic instead of a blank canvas.
Create visuals for studying, teaching, reviewing, and sharing Earth Science ideas.
Practical answers for turning Earth Science topics, notes, and plain text into clearer visual summaries.
An Earth Science infographic generator turns Earth Science topics, notes, or plain text into structured visual summaries. KnowLens helps organize the content into key points, readable labels, and a clear visual hierarchy.
Yes. You can start with an Earth Science topic, notes, or plain text, and KnowLens can help turn it into an Earth Science infographic, visual summary, or poster-style Earth Science visual.
You can create visuals for Earth systems, geology, weather, climate, oceans, landforms, rocks and minerals, natural processes, and environmental systems.
No. KnowLens helps organize your Earth Science explanation into a clear visual layout, so you do not need to start from a blank canvas or design template.
Yes. Teachers can use KnowLens to create classroom-ready Earth Science infographics, study visuals, posters, and visual summaries from lesson topics or notes.
Yes. Students can turn Earth Science notes and concepts into visual study guides that are easier to review.
No. KnowLens can help create infographics for geology, weather, climate, oceans, Earth systems, landforms, and other Earth Science topics.
A normal infographic maker usually starts with templates. KnowLens starts with your Earth Science topic or text, organizes the message, and turns it into structured visual information.
Generic AI image tools often focus on decorative images. KnowLens focuses on structured Earth Science visuals with readable labels, clear sections, and infographic-style layouts.
For best results, include the Earth Science topic, key facts, important steps, examples, and the audience you want to explain it to.
Start with an Earth Science topic, notes, or plain text. Generate a structured Earth Science infographic, visual summary, or poster-style visual in minutes.
Continue exploring Earth Science and classroom infographic ideas with KnowLens.
Create structured visuals for biology, astronomy, earth science, and classroom science topics.
Open toolTurn life science topics, human body systems, cells, and ecosystems into readable visuals.
Open toolCreate classroom-ready study guides, lesson visuals, and learning summaries.
Open toolTurn cycles, workflows, and step-by-step explanations into clear process visuals.
Open toolCreate cooking step visuals and recipe cards from ingredients and instructions.
Open toolBrowse science and education examples before creating your own Earth Science visual.
Open tool