Launch WorkflowMarketing Process
Product Launch Workflow
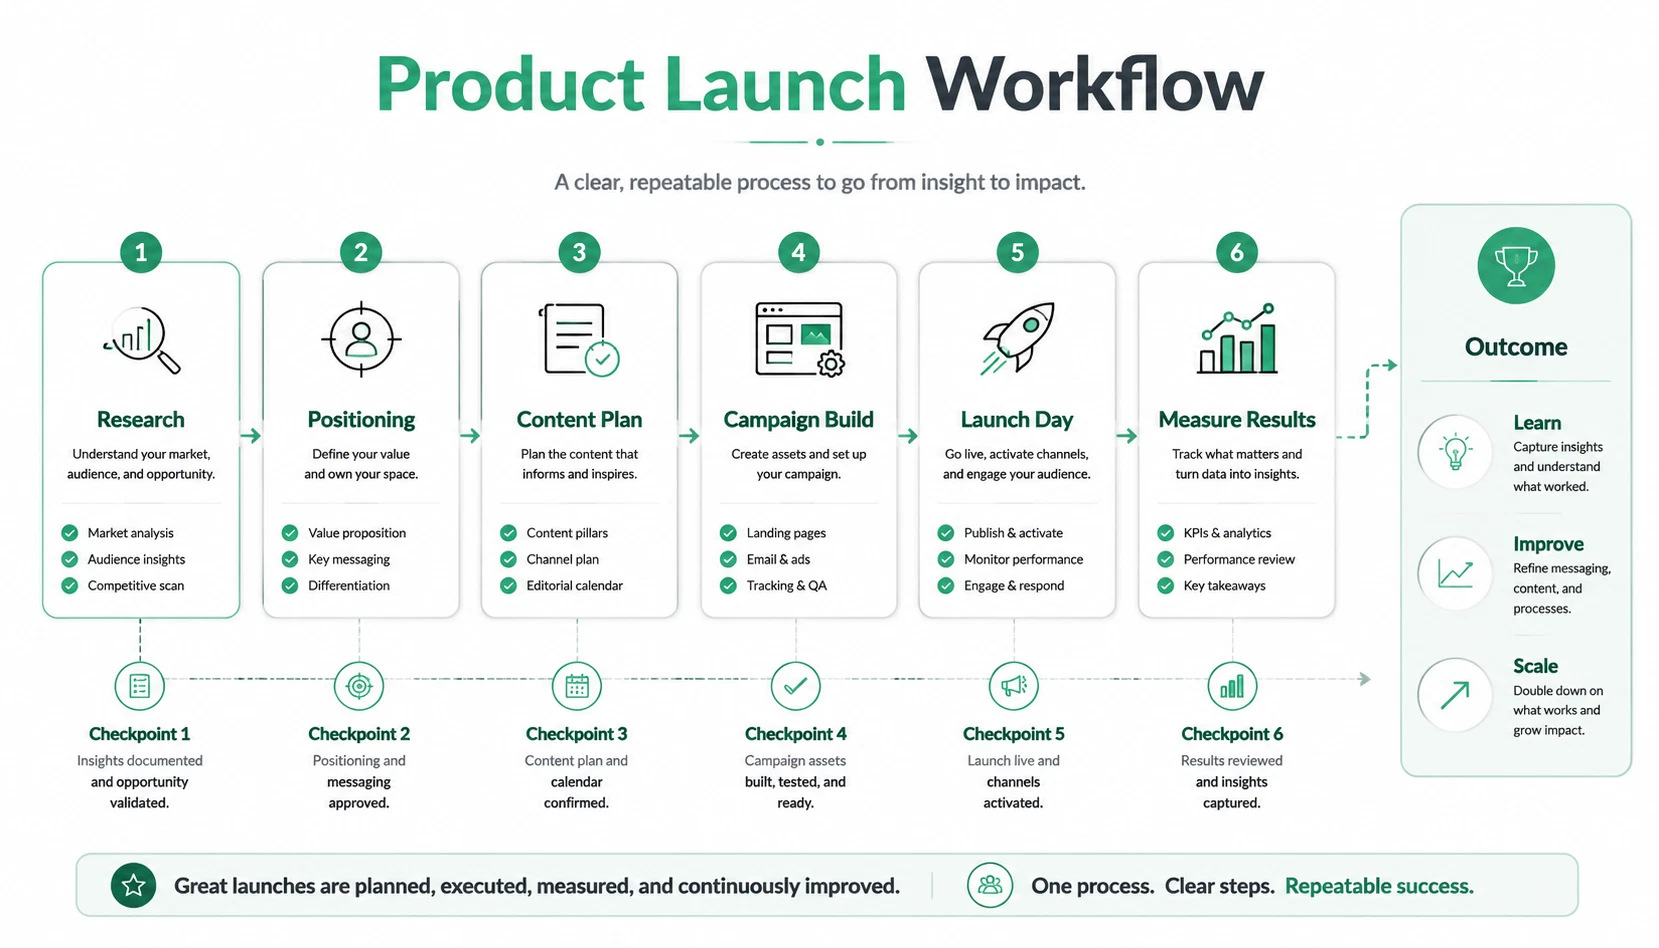
A left-to-right launch process that organizes research, positioning, content planning, campaign build, launch day, and measurement into one clear workflow.
Create SimilarTurn steps, workflows, notes, or plain text into clear process infographics with readable labels, sequence, sections, and visual hierarchy.
No design skills needed.
Explore process infographics and workflow visuals created from steps, notes, and short text prompts.
A left-to-right launch process that organizes research, positioning, content planning, campaign build, launch day, and measurement into one clear workflow.
Create Similar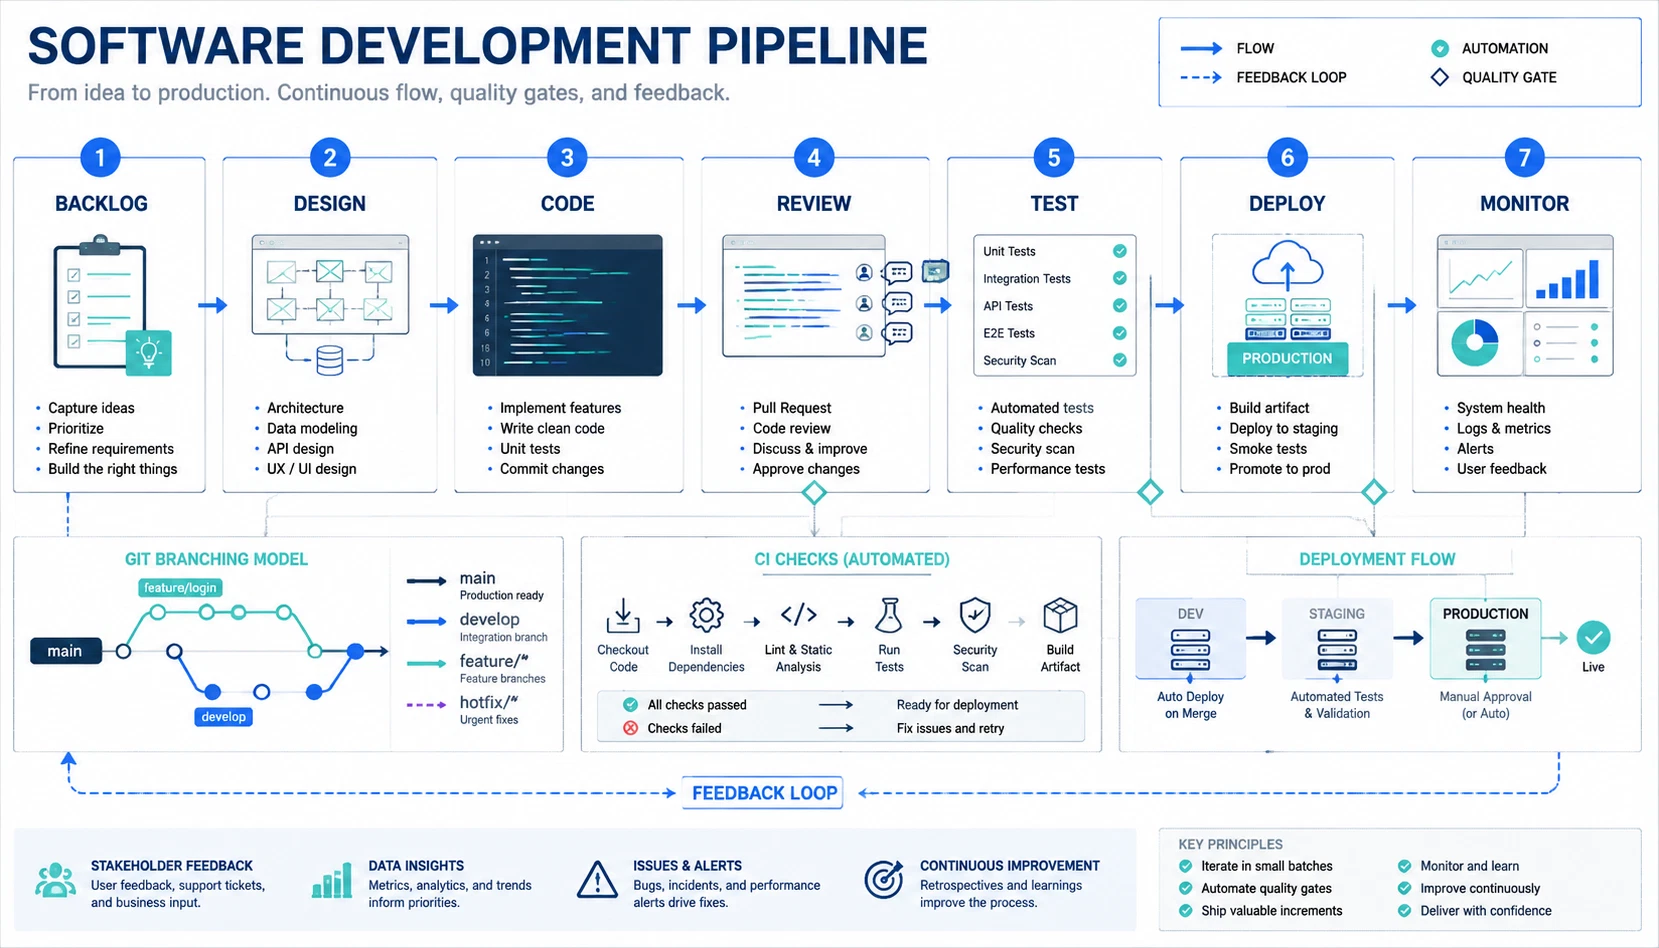
A technical pipeline visual that follows backlog, design, coding, review, testing, deployment, and monitoring with a feedback loop.
Create Similar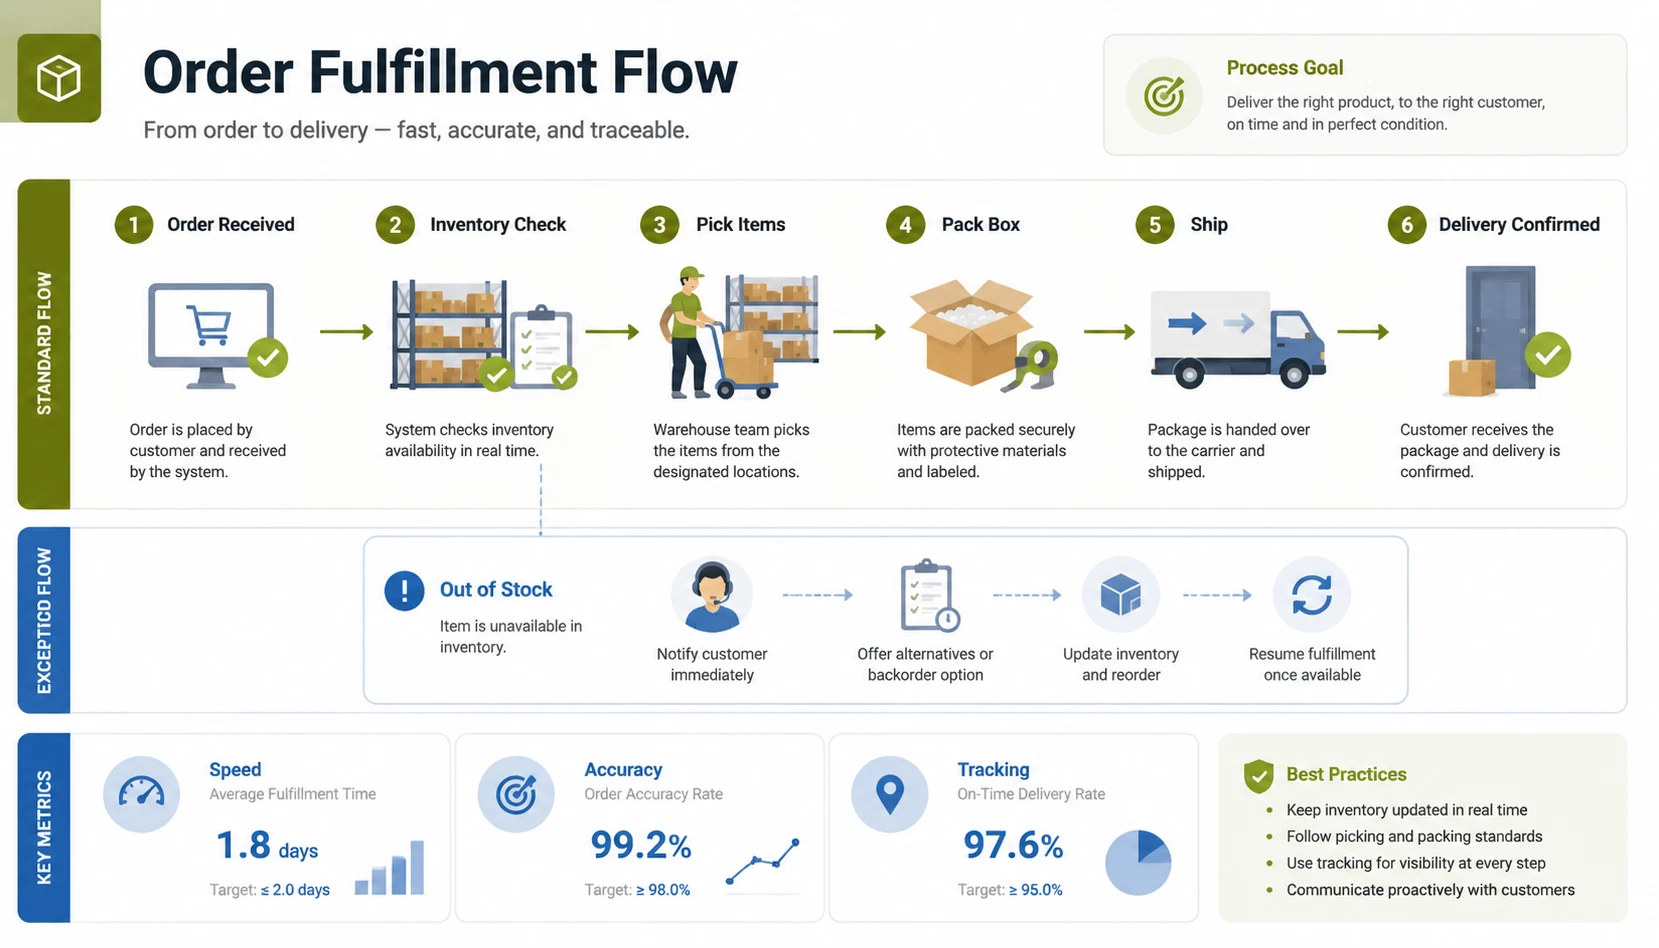
An operations process infographic that turns receiving, inventory checks, picking, packing, shipping, and delivery confirmation into a trackable flow.
Create Similar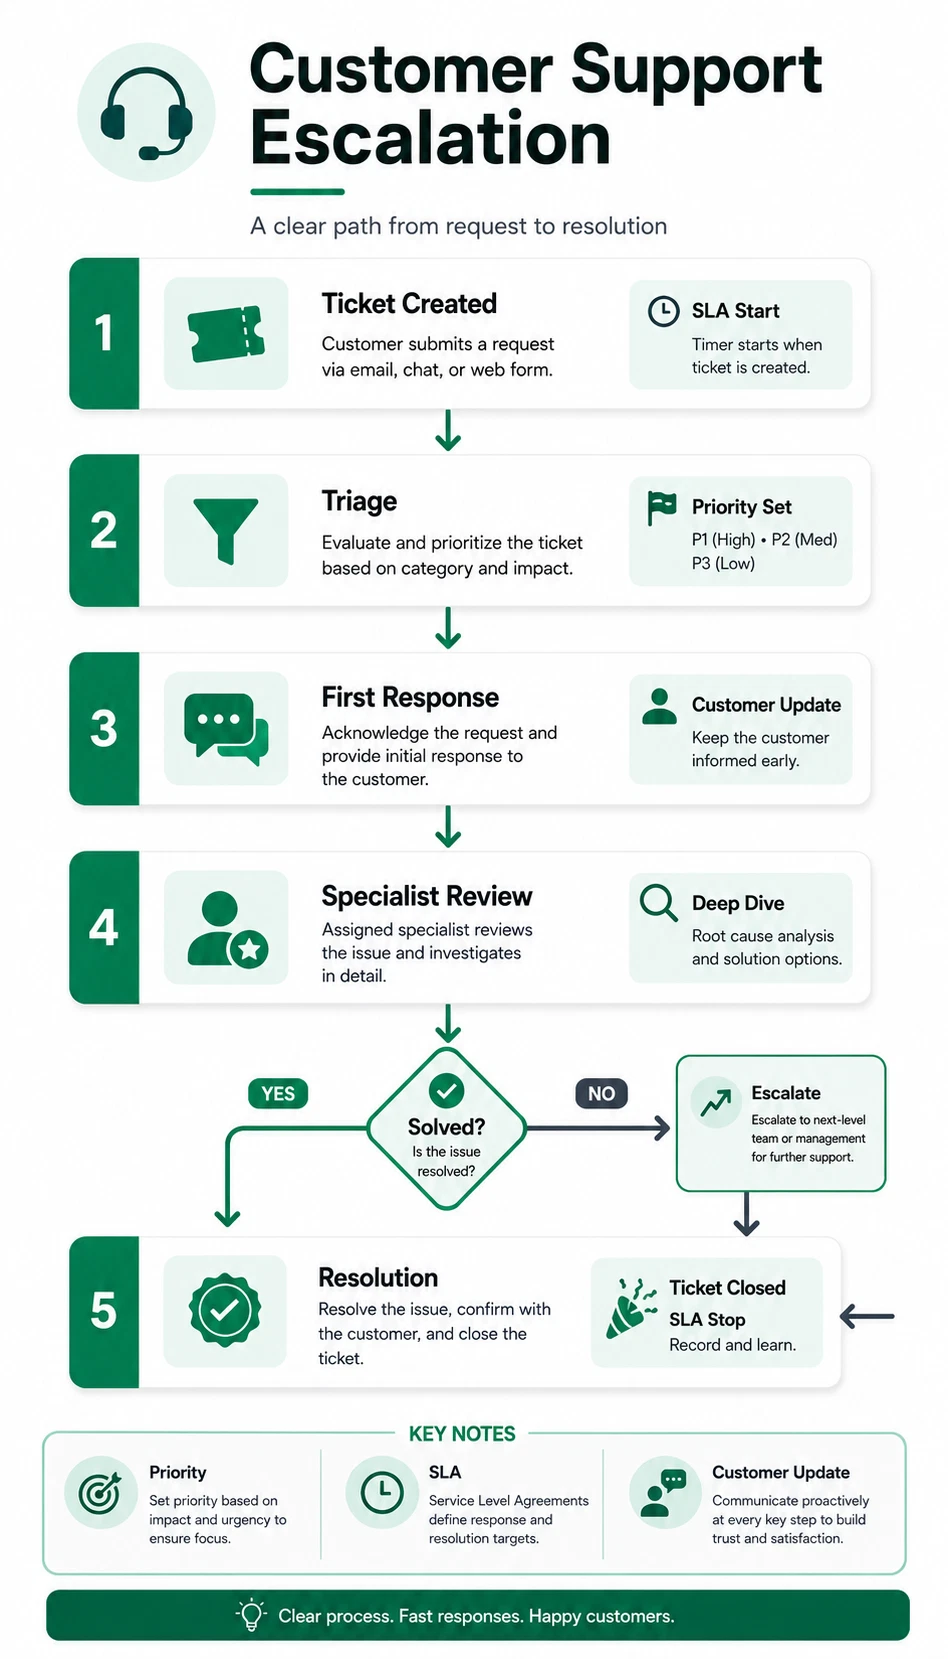
A vertical service workflow that explains how support tickets move through triage, response, specialist review, and resolution decisions.
Create Similar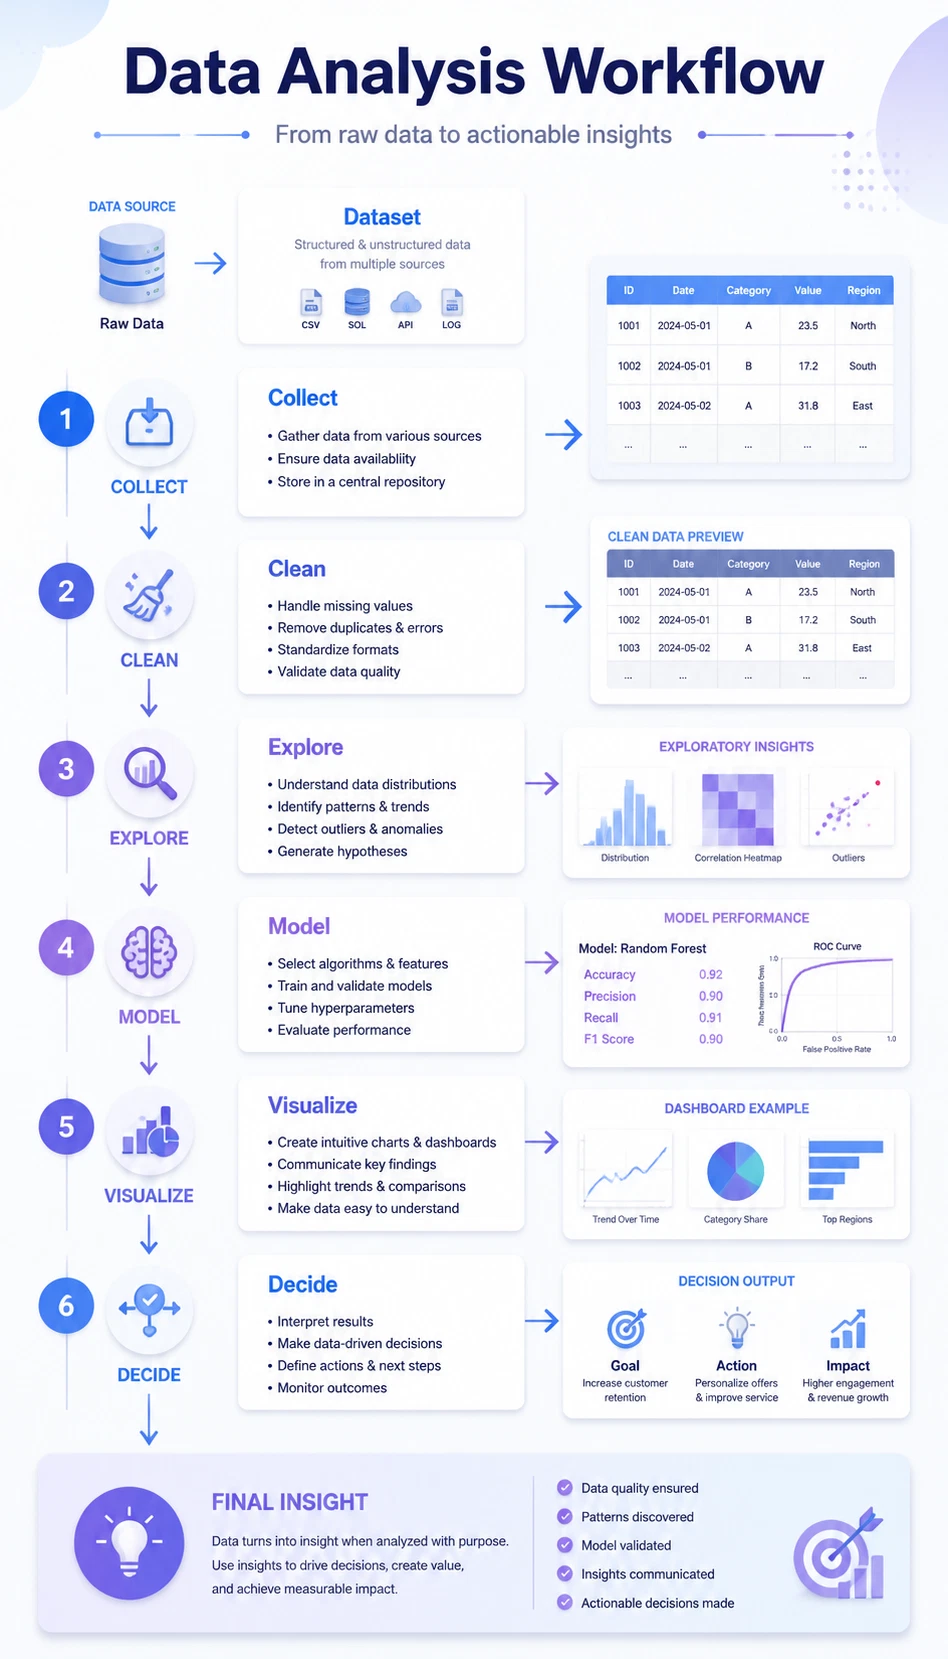
A data workflow poster that walks from collection and cleaning to exploration, modeling, visualization, and final decisions.
Create Similar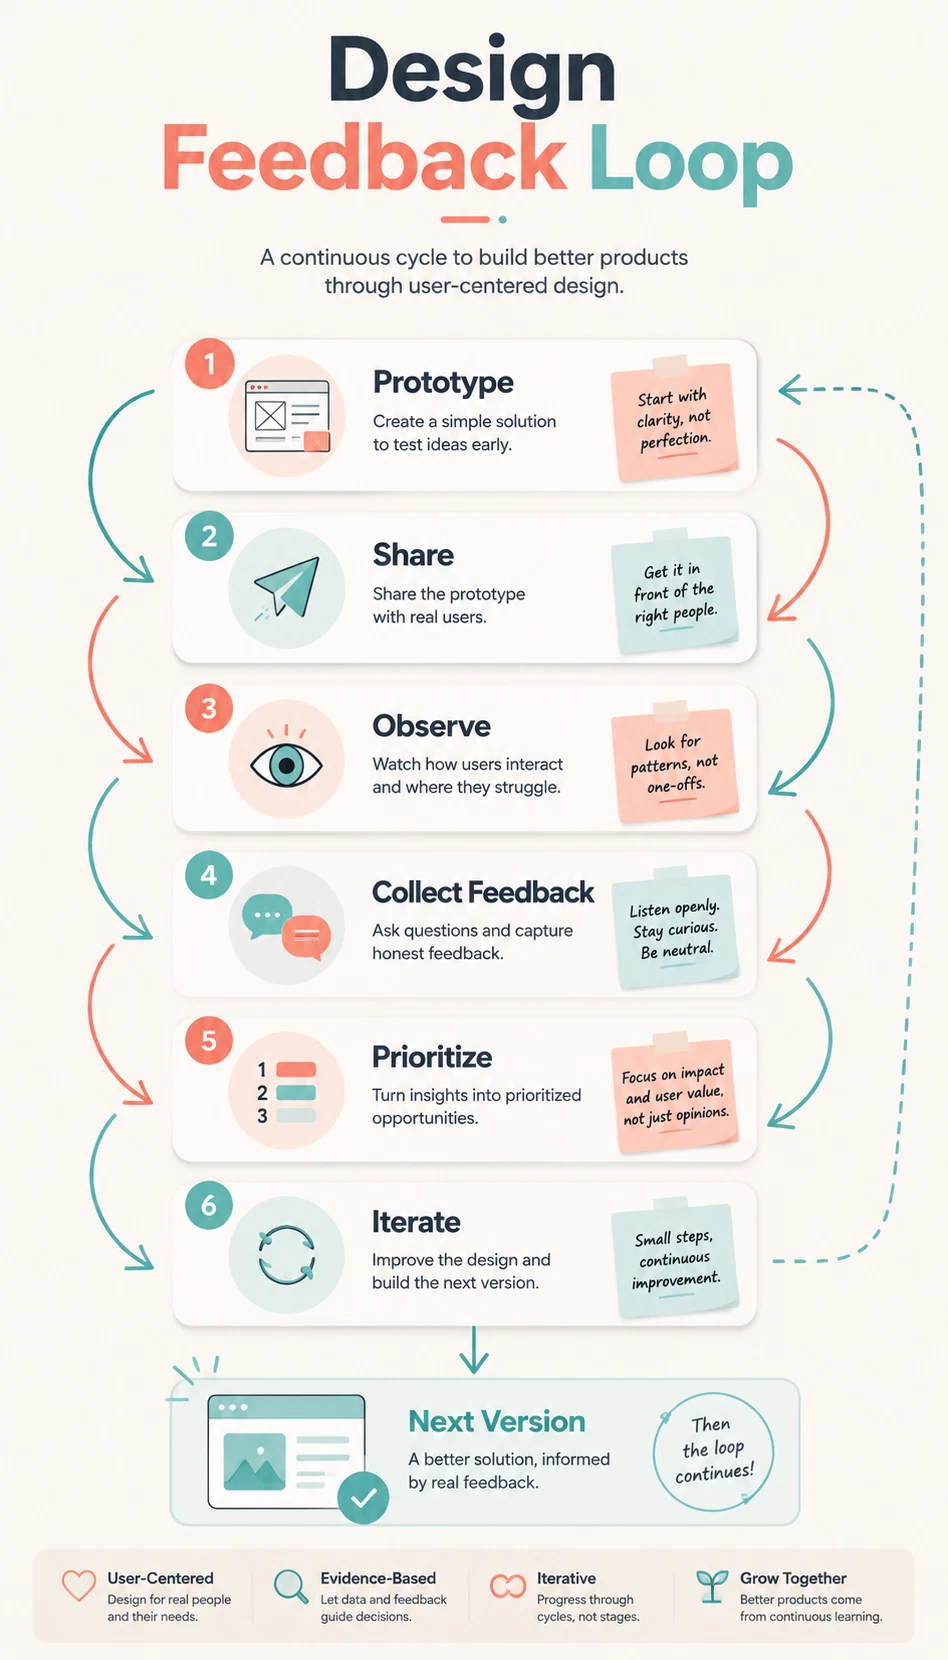
A creative workflow visual that shows how prototypes, sharing, observation, feedback, prioritization, and iteration form a repeatable loop.
Create SimilarStructured step order
A process infographic generator helps turn steps, workflows, instructions, and explanations into structured visual summaries. KnowLens organizes the content into sequence, key points, readable labels, and clear sections so a process is easier to understand and share.
Use KnowLens to turn processes, workflows, and instructions into structured visuals for learning, training, explaining, and sharing.
Turn ordered steps and instructions into a clear visual guide with readable sections.
Explain how tasks, decisions, or actions move through a workflow.
Create visuals that help people understand how to complete a task or follow a process.
Turn tutorial notes or short instructions into structured visual summaries.
Create poster-style process visuals for teaching, presenting, or quick reference.
Break one process into multiple visual sections that are easier to share.
Start with a process or set of steps. KnowLens helps organize the sequence into a clear visual structure.
Start with a process topic, notes, plain text, step-by-step instructions, or a short explanation.
KnowLens organizes the content into ordered steps, key points, labels, and visual hierarchy.
Create a process infographic, workflow visual, step-by-step guide, poster-style visual, or carousel-style process visual.
Prompt starters
Start with a complete explanation or a rough list of steps. Add sequence, key actions, decisions, and examples for better results.
For best results, include the sequence, key actions, decision points, examples, and the audience you want to explain the process to.
Use the process infographic generator when a sequence needs to become clear, visual, and easy to follow.
Turn study processes and learning steps into visual guides.
Create classroom-ready process visuals for lessons and activities.
Turn how-to ideas and tutorials into shareable visual content.
Create quick workflow visuals without a designer.
Explain product workflows, feature steps, and user journeys visually.
Turn instructions and training points into visual process guides.
KnowLens is built for visual explanation, not generic AI art.
Turn process text into ordered steps that are easier to follow.
Create visuals with clear headings, step labels, and short text blocks.
Organize workflows into stages, actions, decisions, and outcomes.
Emphasize the most important steps with sections, spacing, titles, and visual grouping.
Start from a process explanation instead of a blank canvas.
Practical answers for turning process topics, steps, notes, and plain text into clearer visual summaries.
A process infographic generator turns steps, workflows, notes, or plain text into structured visual summaries. KnowLens helps organize the content into sequence, key points, readable labels, and a clear visual hierarchy.
Yes. You can start with a process topic, step-by-step instructions, notes, or plain text, and KnowLens can help turn it into a process infographic, workflow visual, or how-to guide.
You can create visuals for workflows, tutorials, how-to instructions, onboarding steps, learning processes, recipe steps, product workflows, support flows, and training processes.
No. KnowLens helps organize your process into a clear visual layout, so you do not need to start from a blank canvas or design template.
Yes. KnowLens can help create workflow infographics that show stages, actions, decisions, and outcomes in a readable visual structure.
Yes. You can turn ordered steps, instructions, or how-to content into a step-by-step infographic or visual guide.
A normal infographic maker usually starts with templates. KnowLens starts with your process text or notes, organizes the sequence, and turns it into structured visual information.
Generic AI image tools often focus on decorative images. KnowLens focuses on structured process visuals with step order, readable labels, clear sections, and infographic-style layouts.
For best results, include the process topic, ordered steps, key actions, decision points, examples, and the audience you want to explain it to.
Yes. Process infographics can help explain learning steps, training workflows, tutorials, and simple operating processes.
Start with a process, notes, or plain text. Generate a structured workflow visual, step-by-step guide, or process infographic in minutes.
Explore more ways to turn ideas, steps, and learning topics into structured infographic-style visuals.
Turn topics, notes, and plain text into structured infographics with clear sections.
Open toolCreate clear infographics from ideas and notes without design skills.
Open toolCreate structured learning visuals, study guides, and classroom-ready infographics.
Open toolTurn ingredients and cooking steps into visual recipe cards and process guides.
Open toolConvert plain text, notes, and short explanations into infographic-style visuals.
Open toolBrowse process-friendly infographic examples and visual summary ideas.
Open tool