LIFE SCIENCE VISUAL LEARNING
Biology Infographic Generator for Clear Visuals
Turn biology topics, notes, or plain text into clear biology infographics with readable labels, structured sections, and visual hierarchy.
No design skills needed.
Biology Infographic Examples
Explore biology infographics and visual summaries created from topics, notes, and short text prompts.
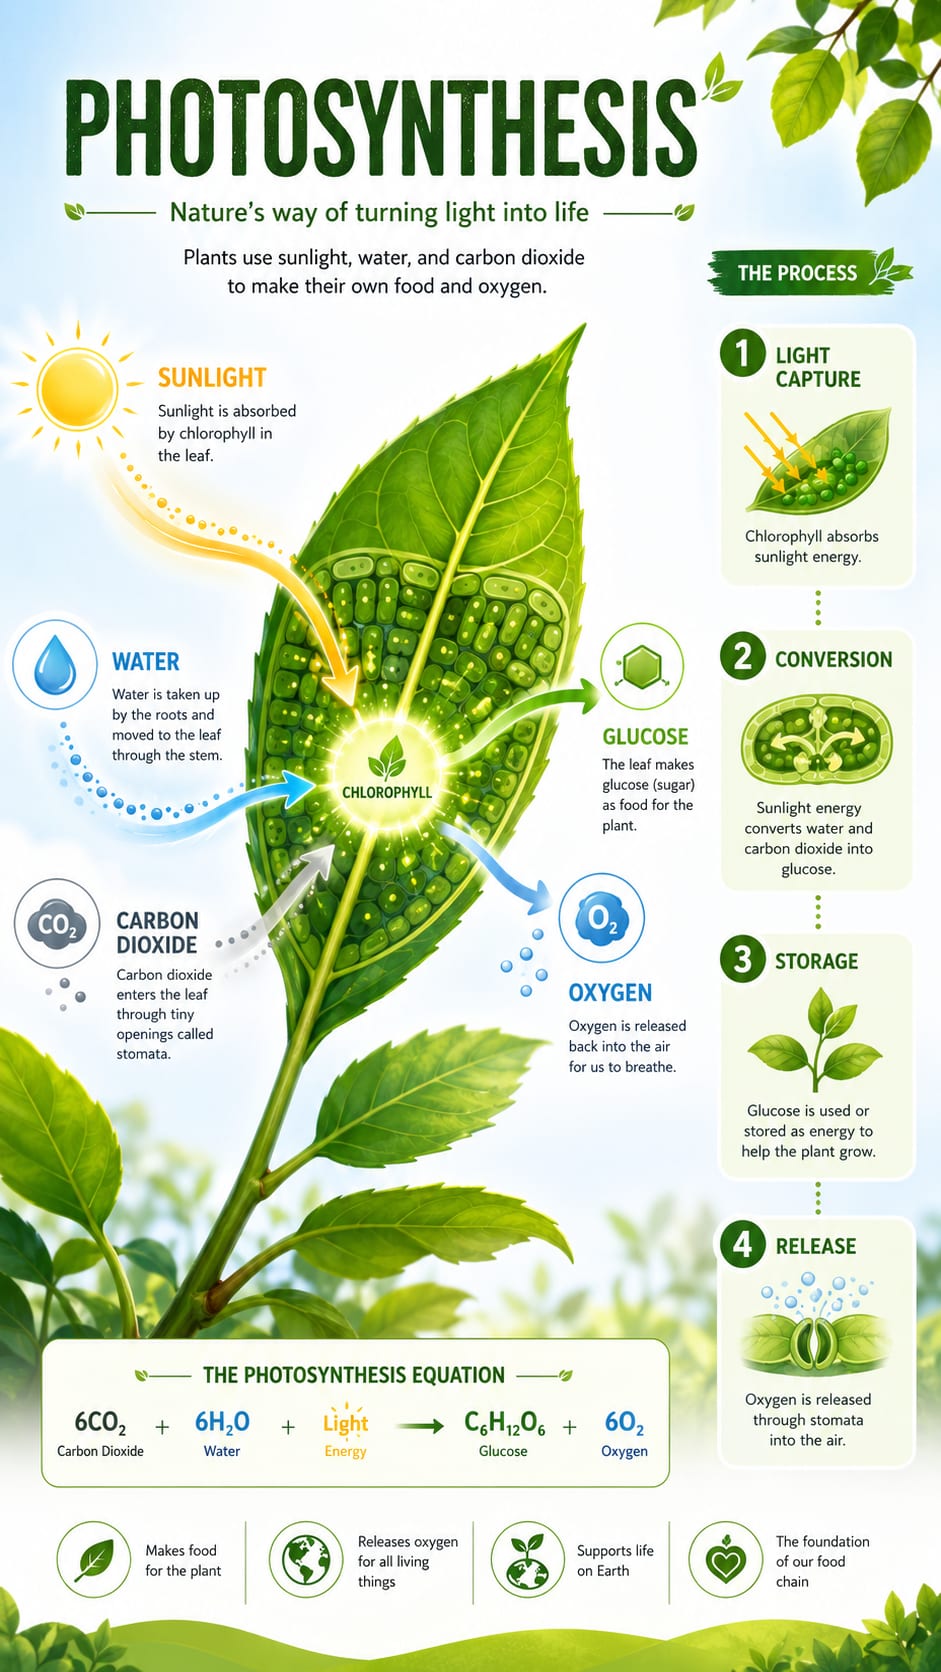
Plant BiologyBiology Infographic
Photosynthesis Process
A plant biology infographic showing sunlight, water, carbon dioxide, glucose, oxygen, and the photosynthesis equation.
Create Similar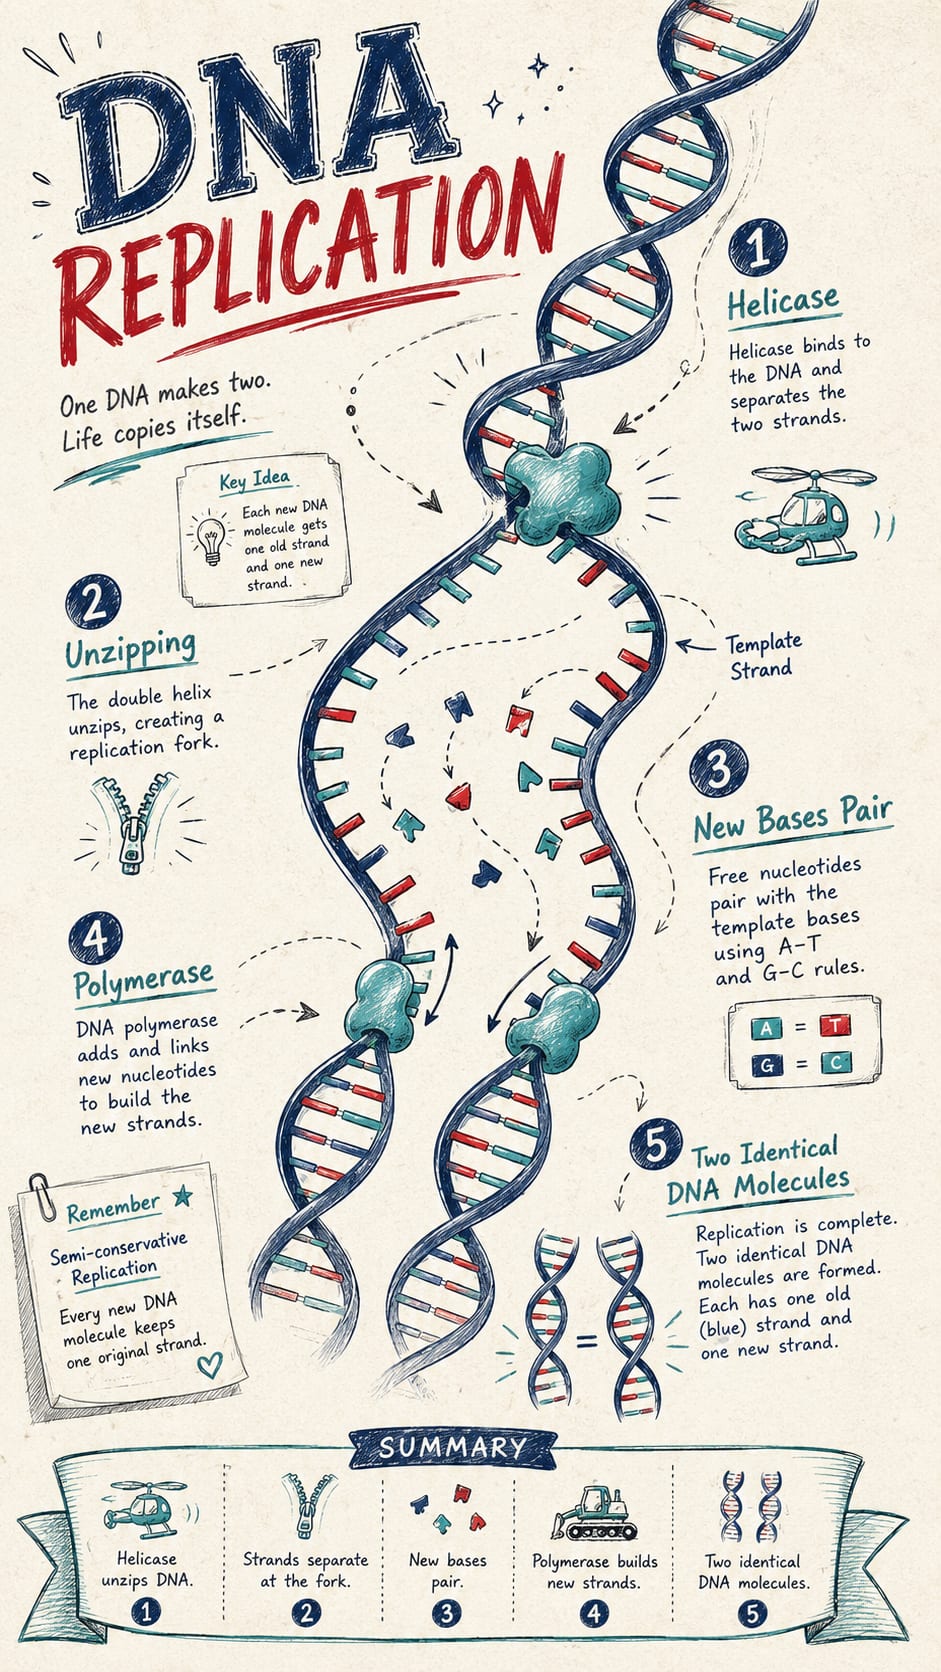
Genetics VisualEducational Visual
DNA Replication Poster
A genetics visual explaining helicase, unzipping, base pairing, polymerase, and two identical DNA molecules.
Create Similar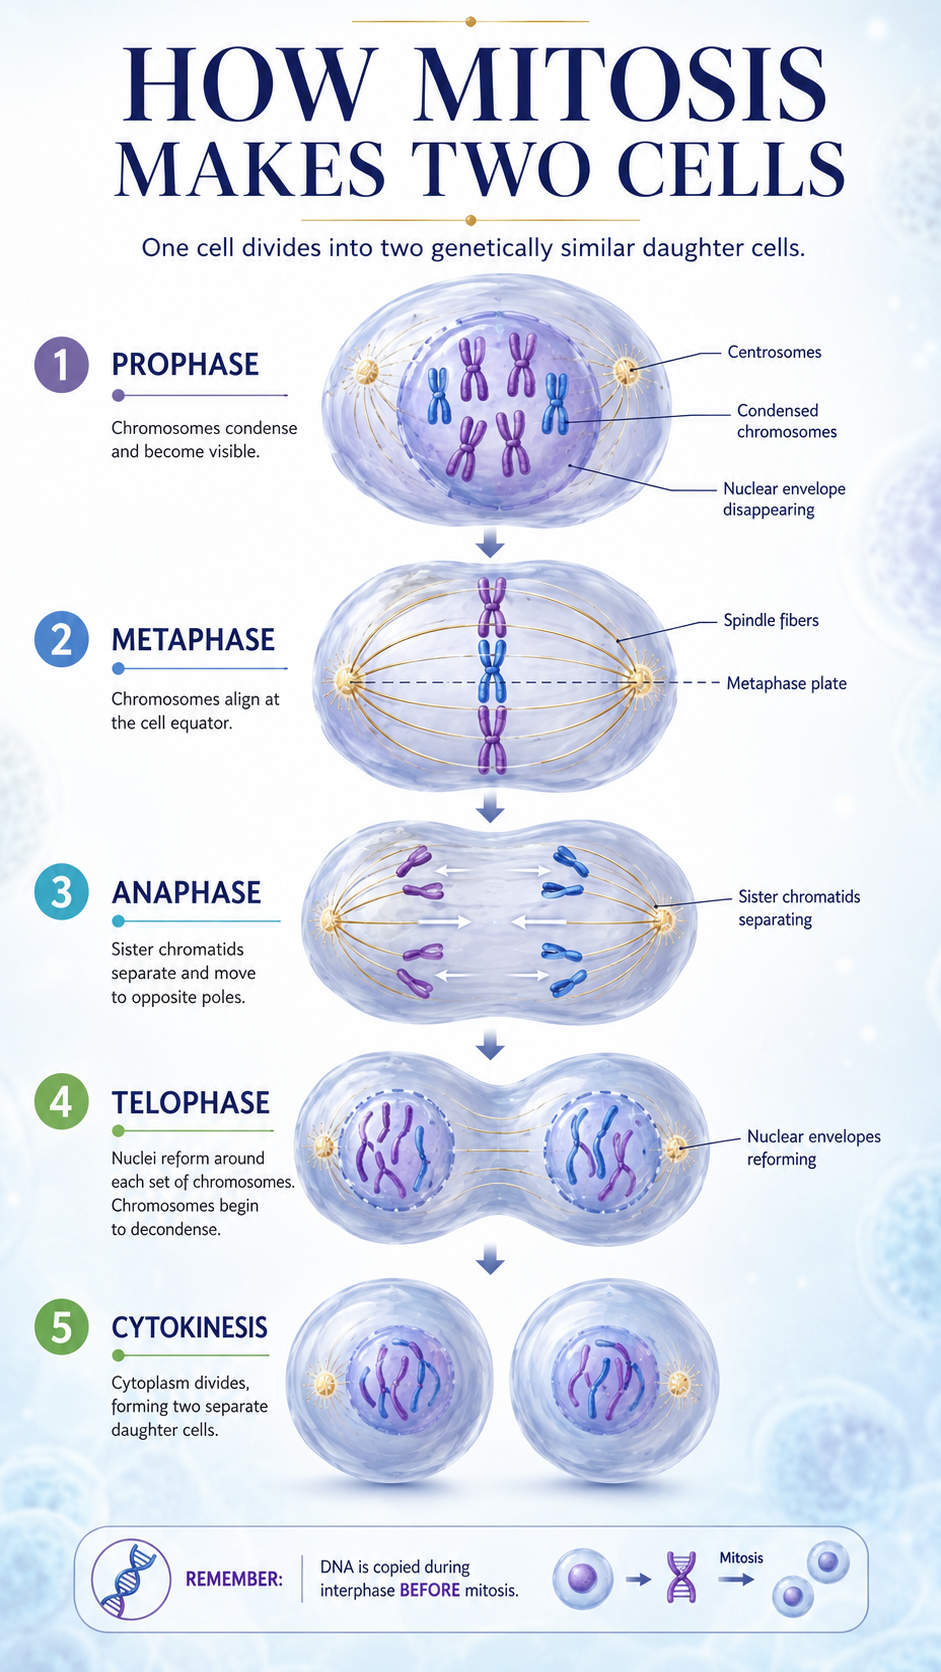
Cell BiologyEducational Visual
Mitosis Cell Division
A cell biology infographic showing prophase, metaphase, anaphase, telophase, and cytokinesis.
Create Similar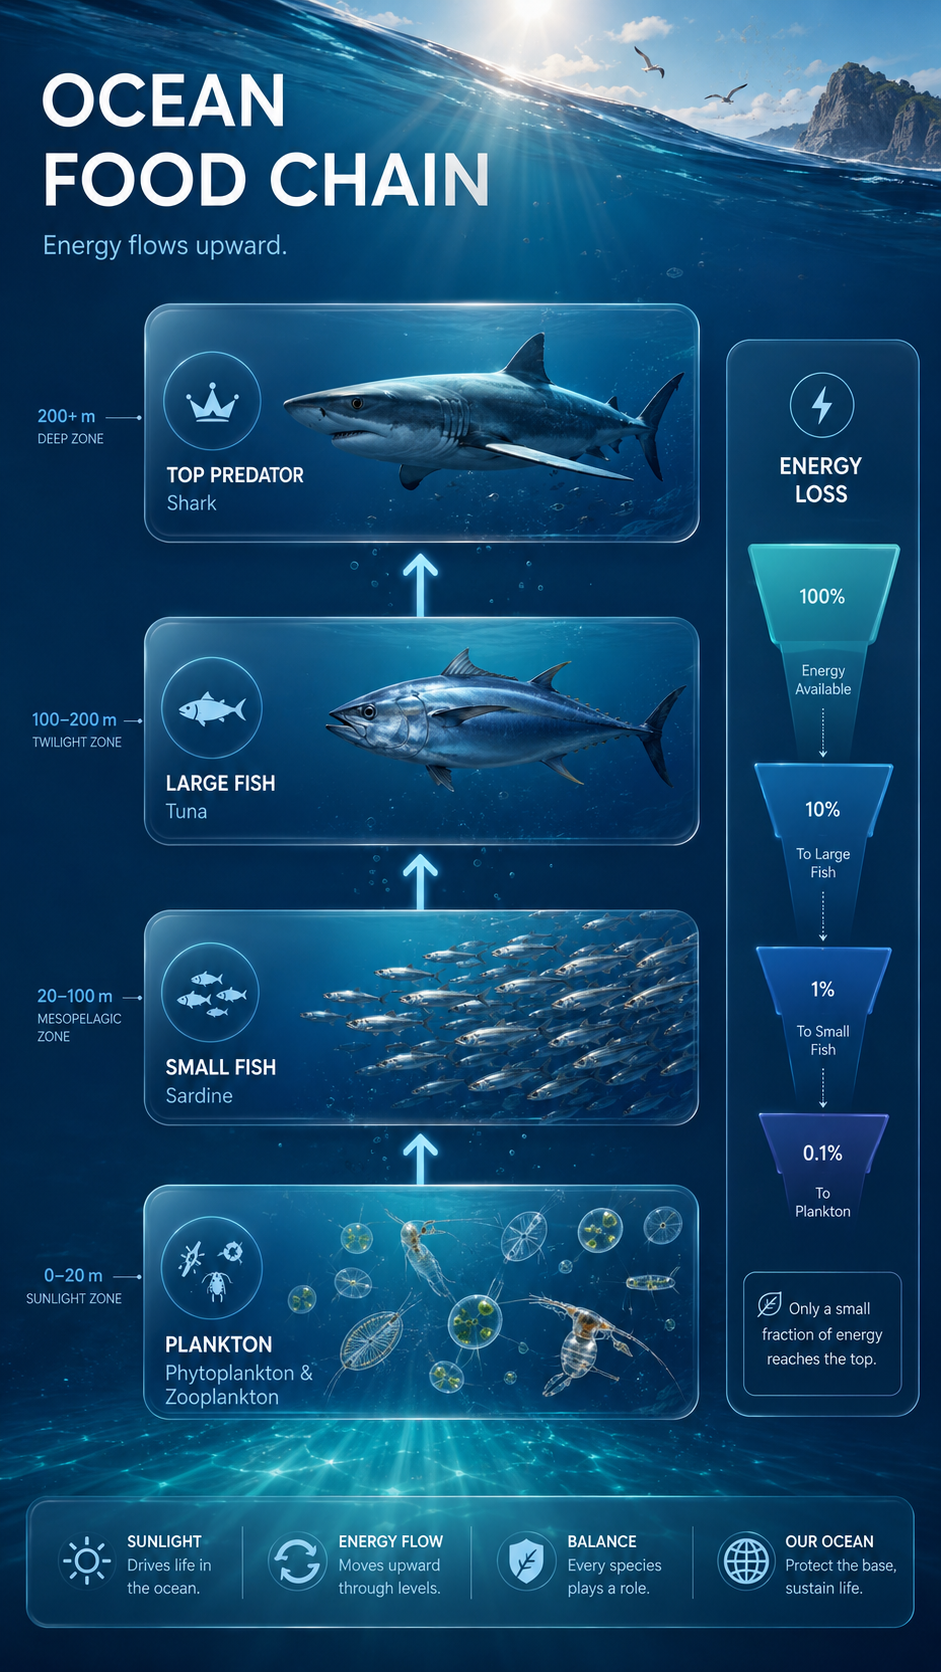
Ecosystem InfographicBiology Infographic
Ocean Food Chain
An ecosystem infographic showing plankton, small fish, large fish, sharks, and energy loss across food-chain levels.
Create SimilarWhat is a Biology Infographic Generator?
A biology infographic generator helps turn biology topics, notes, and explanations into structured visual summaries. KnowLens organizes the content into key points, readable labels, clear sections, and visual hierarchy so the topic is easier to understand and share.
Create Biology Infographics for Clear Learning
Use KnowLens to turn biology ideas into structured visuals for studying, teaching, explaining, and sharing.
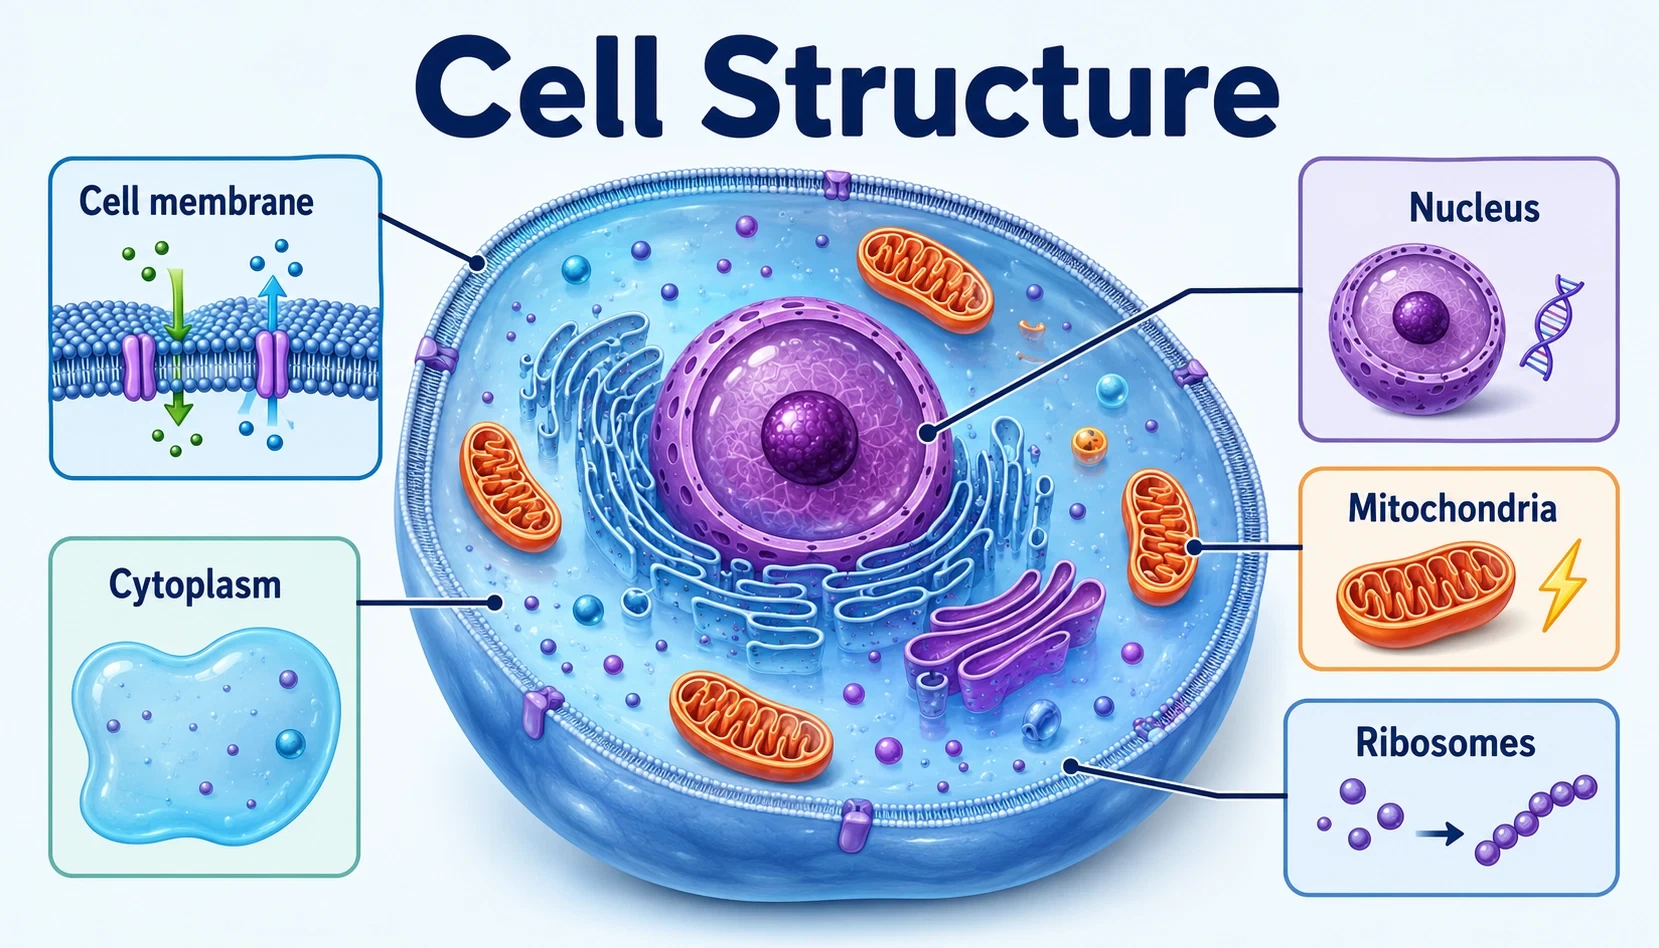
Cell Biology Infographics
Turn cell structure, organelles, membranes, and cell processes into visual summaries.
Plant Biology Infographics
Explain plant systems, photosynthesis, seed germination, and plant life cycles with clear sections and labels.
Genetics and DNA Visuals
Create visuals for DNA, genes, inheritance basics, and biological processes in a simple infographic format.
Ecosystem Infographics
Show food chains, energy flow, habitats, and ecosystems through clear visual structures.
Human Body Basics
Turn introductory anatomy and body-system concepts into readable biology visuals.
Biology Study Guides
Create biology visuals that help students review key ideas and understand complex topics faster.
HOW IT WORKS
Create a Biology Infographic in 3 Steps
Start with a biology topic or explanation. KnowLens helps organize the idea into a clear visual structure.
Add a Biology Topic or Text
Start with a biology topic, study notes, a short explanation, or plain text.
Structure the Concept
KnowLens organizes the biology idea into sections, key points, labels, and visual hierarchy.
Generate the Infographic
Create a biology infographic, visual summary, poster-style biology visual, or carousel-style biology visual.
Biology Topics You Can Turn into Infographics
Start with a complete explanation or a short topic. Add key points, steps, facts, or examples for better results.
Prompt 1
Explain photosynthesis in 5 key steps for middle school students.
Prompt 2Create a biology infographic about the structure of a plant cell with clear labels.
Prompt 3Turn these notes about DNA replication into a visual summary.
Prompt 4Explain seed germination using simple steps and labeled visuals.
Prompt 5Create an infographic about food chains and energy flow in an ecosystem.
Prompt 6Explain the main parts of the human digestive system in a simple biology poster.
Prompt 7Create a visual summary of how cells divide.
Prompt 8Make a biology infographic about the life cycle of a butterfly.
Prompt 9Explain the differences between plant cells and animal cells.
Prompt 10Create a classroom infographic about ecosystems, habitats, and biodiversity.
For best results, include the audience, key facts, steps, and examples you want to show in the infographic.
Built for Biology Learning and Communication
Use the biology infographic generator when a complex biology idea needs to become clear, visual, and easy to review.
Students
Turn biology notes and concepts into visual study guides.
Study guides
Teachers
Create classroom-ready biology visuals from lesson topics and explanations.
Classroom visuals
Biology Educators
Explain complex life science ideas with structured labels, sections, and visual summaries.
Biology education
Content Creators
Turn biology topics into shareable educational visuals for blogs and social platforms.
Educational content
Tutors
Create simple biology visuals that help students understand difficult concepts.
Tutoring aids
Learning Teams
Create quick biology posters and knowledge visuals without a designer.
Learning materials
Designed for Readable Biology Infographics
KnowLens is built for visual explanation, not generic AI art.
Readable Labels
Create biology visuals with clear headings, labels, and short text blocks that are easier to scan.
Structured Concepts
Organize biology topics into systems, steps, comparisons, life cycles, or key facts.
Clear Visual Hierarchy
Emphasize the most important ideas with sections, spacing, titles, and visual grouping.
Content-First Visuals
Start from a biology explanation or topic instead of a blank canvas.
Built for Learning
Create visuals for studying, teaching, reviewing, and sharing biology ideas.
FAQ
Common questions about creating biology infographics with KnowLens.
What is a biology infographic generator?
A biology infographic generator turns biology topics, notes, or plain text into structured visual summaries. KnowLens helps organize the content into key points, readable labels, and a clear visual hierarchy.
Can I create biology infographics from text?
Yes. You can start with a biology topic, notes, or plain text, and KnowLens can help turn it into a biology infographic, visual summary, or poster-style biology visual.
What biology topics can I visualize?
You can create visuals for cells, plants, DNA, genetics basics, ecosystems, food chains, life cycles, and introductory human body concepts.
Do I need design skills?
No. KnowLens helps organize your biology explanation into a clear visual layout, so you do not need to start from a blank canvas or design template.
Can teachers use this for classroom visuals?
Yes. Teachers can use KnowLens to create classroom-ready biology infographics, study visuals, biology posters, and visual summaries from lesson topics or notes.
Can students use it for study guides?
Yes. Students can turn biology notes and concepts into visual study guides that are easier to review.
Is this only for one biology topic?
No. KnowLens can help create infographics for plant biology, cell biology, genetics basics, ecosystems, life cycles, and other biology topics.
How is KnowLens different from a normal infographic maker?
A normal infographic maker usually starts with templates. KnowLens starts with your biology topic or text, organizes the message, and turns it into structured visual information.
How is KnowLens different from a generic AI image generator?
Generic AI image tools often focus on decorative images. KnowLens focuses on structured biology visuals with readable labels, clear sections, and infographic-style layouts.
What should I include in my input?
For best results, include the biology topic, key facts, important steps, examples, and the audience you want to explain it to.
Related Infographic Tools
Explore nearby KnowLens tools for turning text and topics into structured visuals.
Create a Clear Biology Infographic
Start with a biology topic, notes, or plain text. Generate a structured biology infographic, visual summary, or poster-style visual in minutes.