Science LearningClassroom Visual
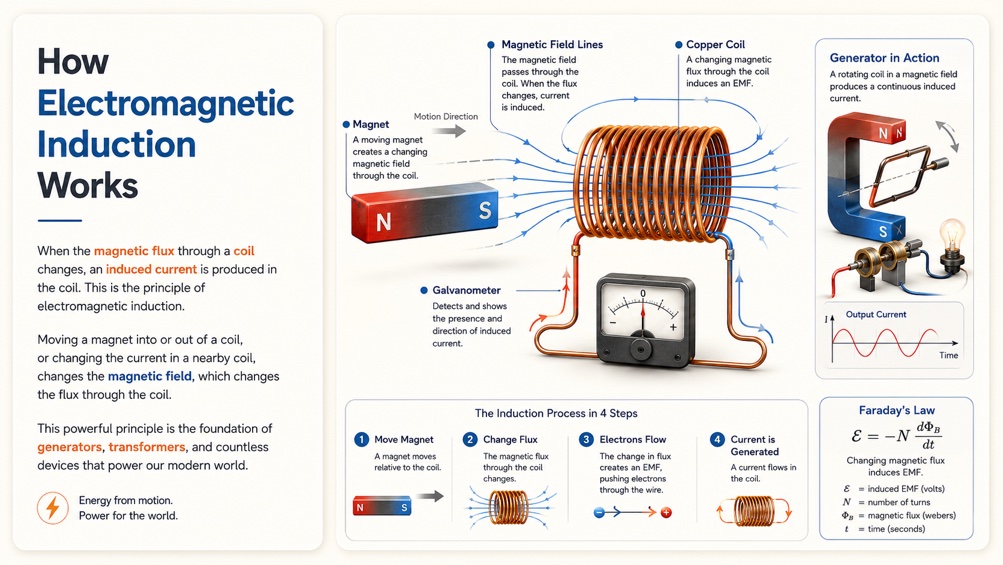
Electromagnetic Induction Lesson
A physics classroom visual that explains magnetic flux, induced current, coil movement, and Faraday's law.
Create SimilarTurn educational topics, notes, or plain text into clear infographics, visual study guides, and classroom-ready visuals with readable labels and structured sections.
Start with notes or a topic. KnowLens structures the visual.
Explore educational infographics and visual study guides created from topics, notes, and short text prompts.
A physics classroom visual that explains magnetic flux, induced current, coil movement, and Faraday's law.
Create Similar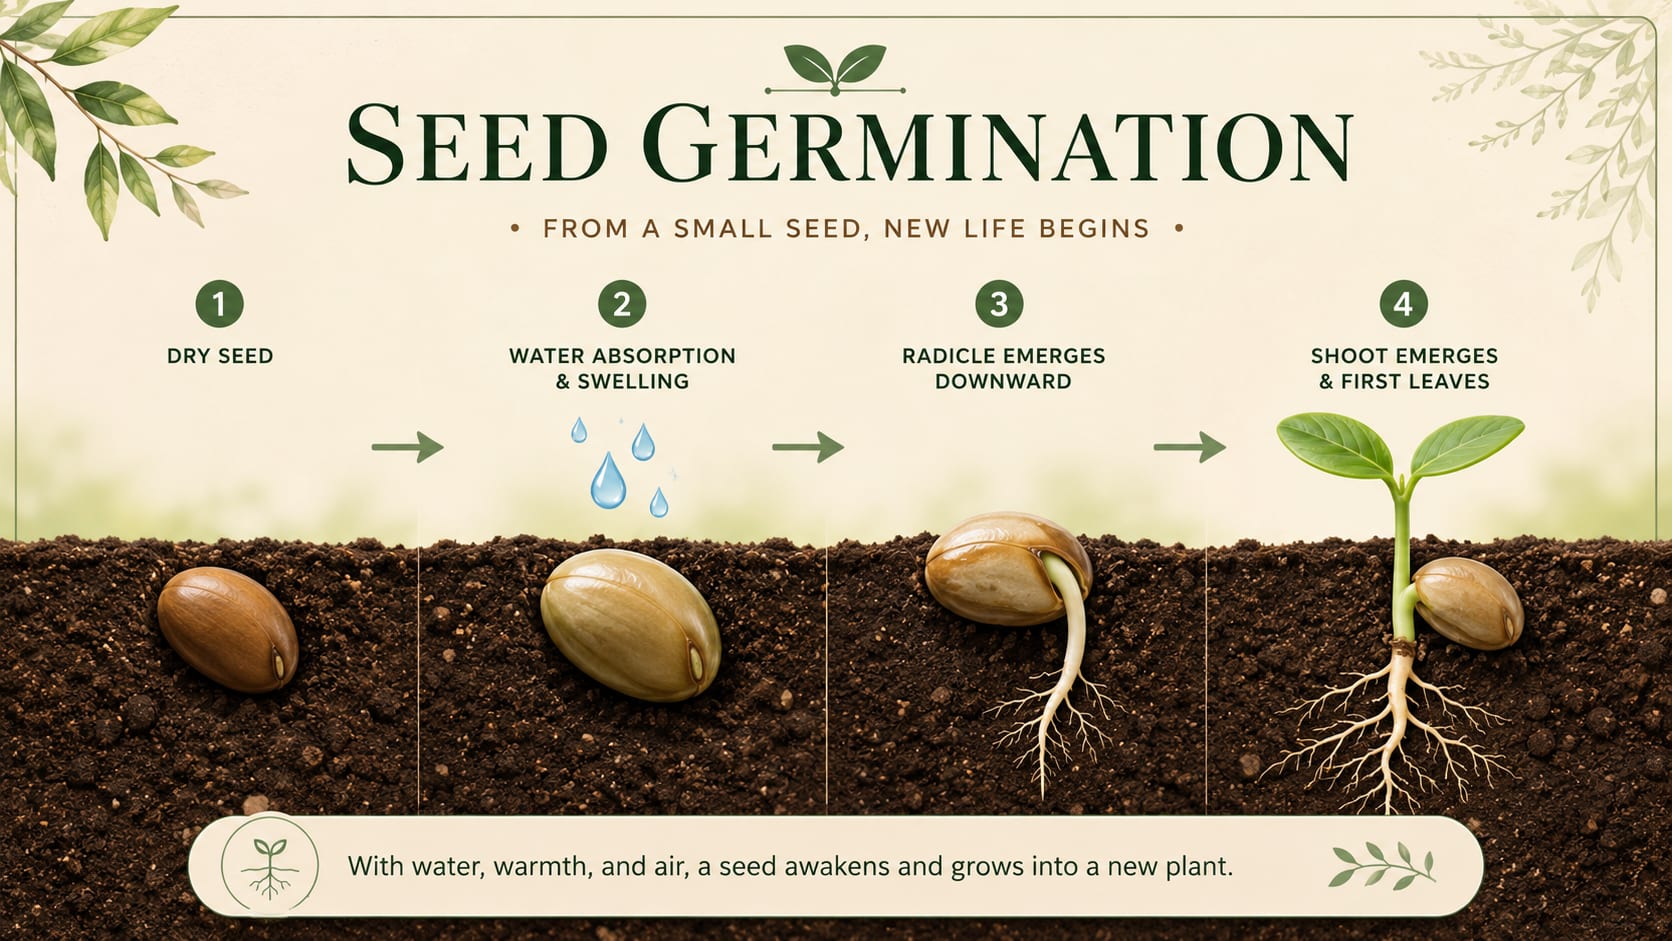
A science learning infographic that explains how plants use sunlight, water, and carbon dioxide to make energy.
Create Similar
A history learning visual that explains movable type, faster book production, literacy, and long-term cultural change.
Create Similar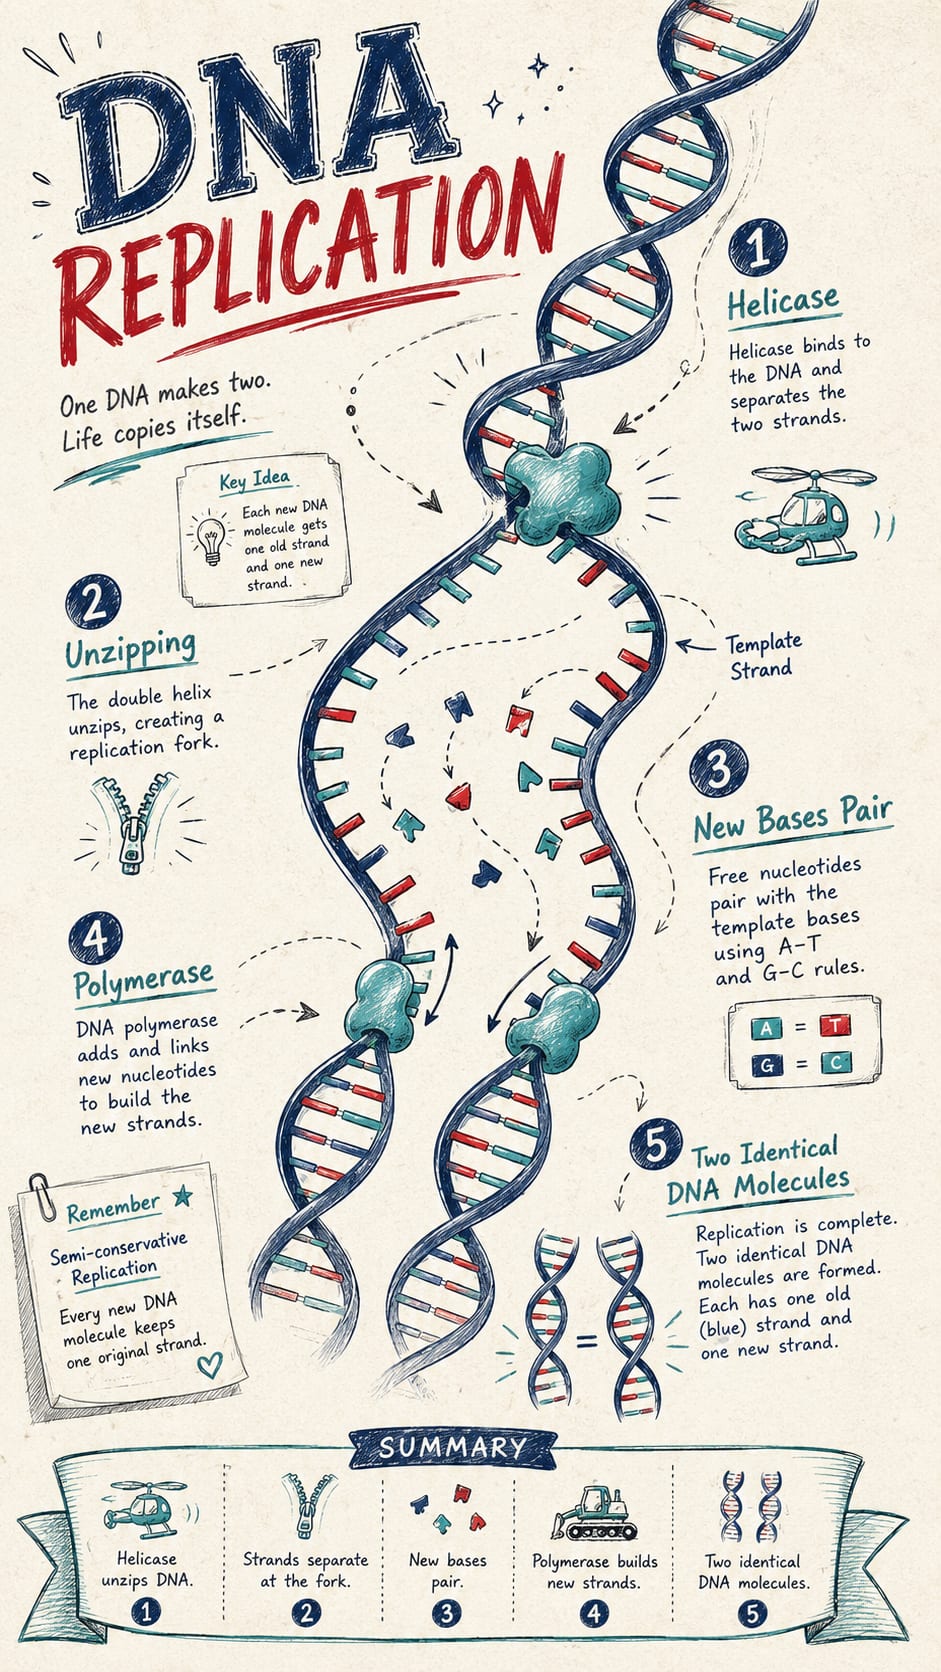
A biology study guide that breaks DNA replication into helicase, unzipping, base pairing, polymerase, and summary steps.
Create Similar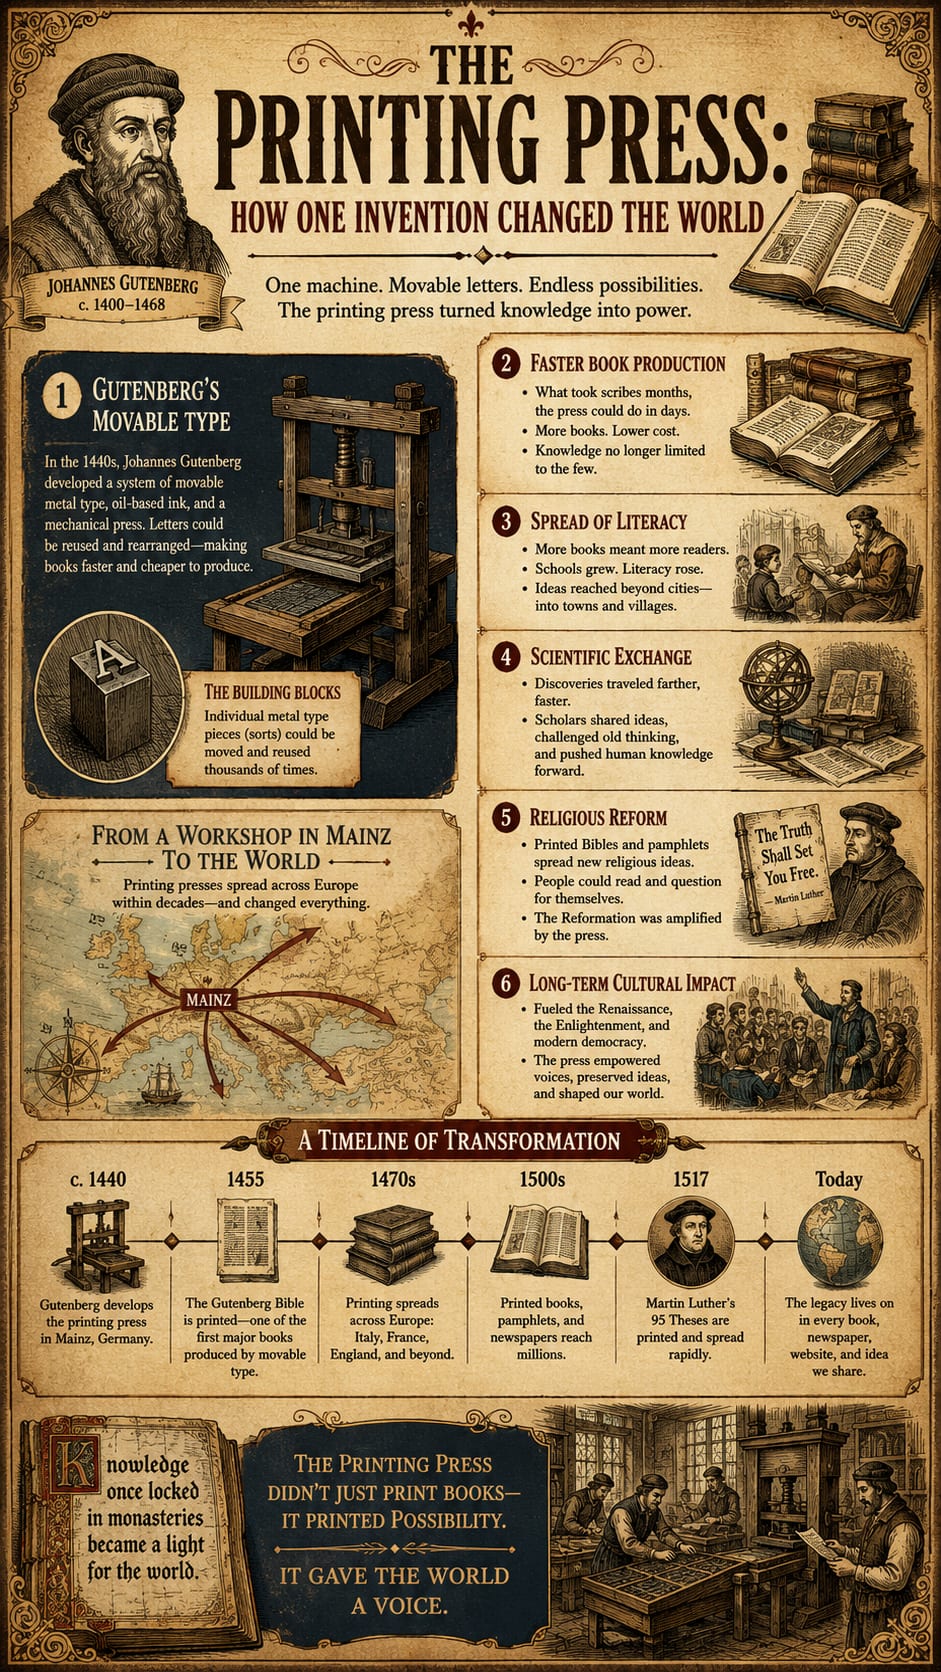
A vertical history infographic that organizes Gutenberg, movable type, literacy growth, reform, and cultural impact.
Create Similar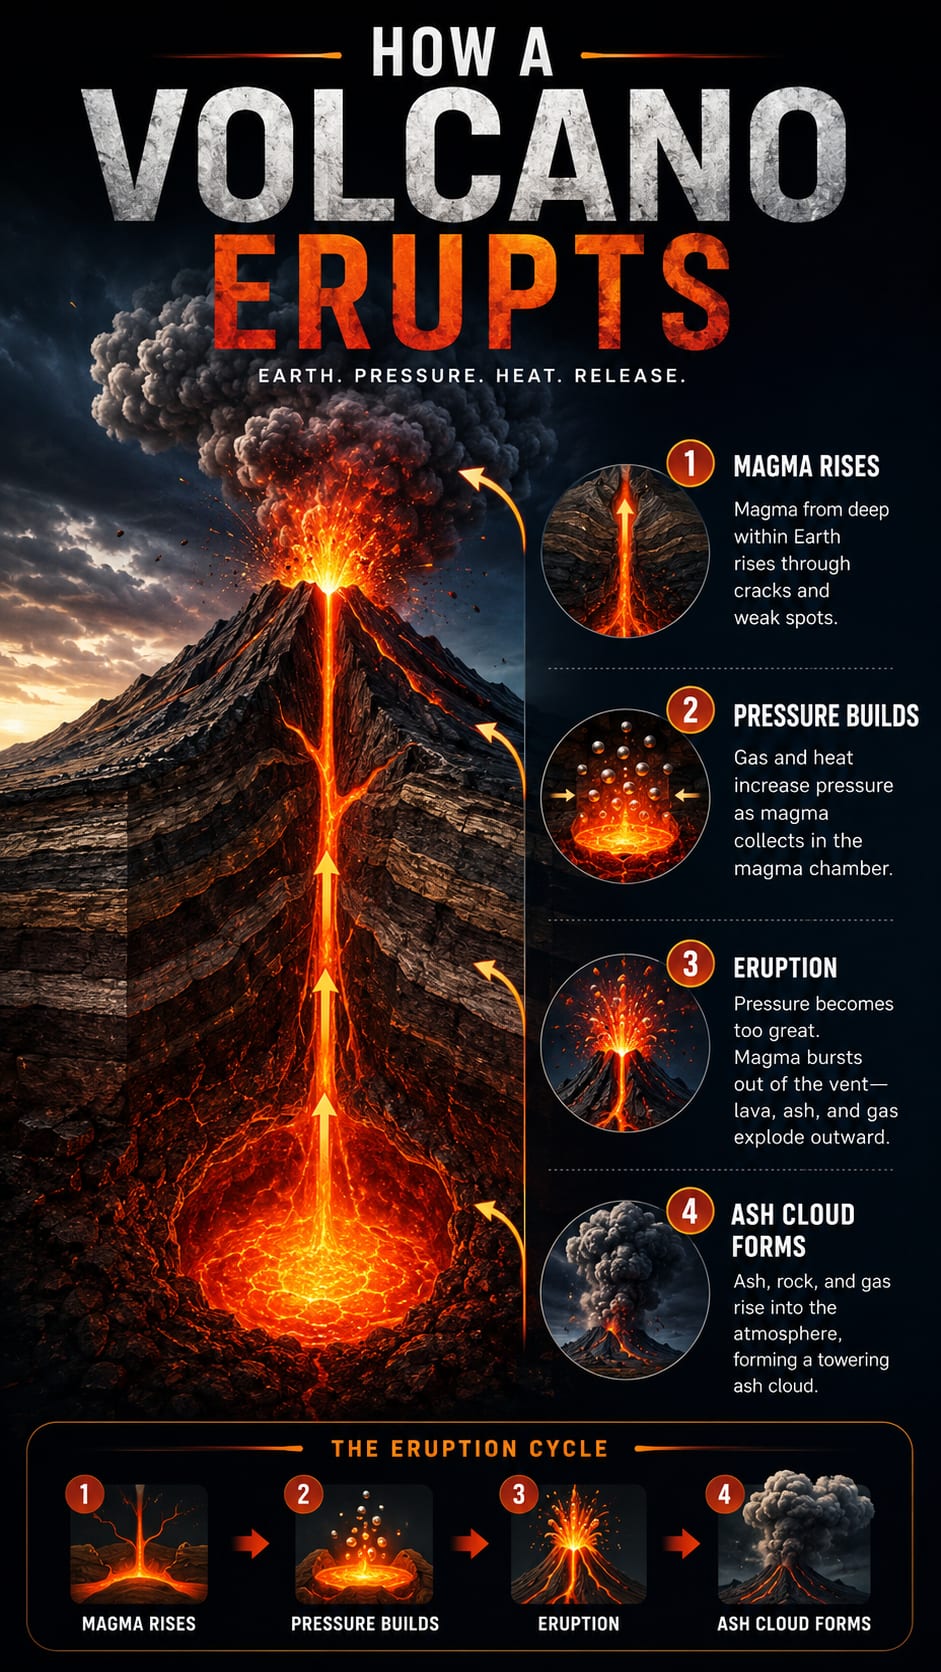
A geography and geology learning visual that explains magma chambers, ash clouds, lava flow, and eruption structure.
Create SimilarStructured visual learning
An educational infographic maker helps turn learning topics, study notes, and lesson explanations into structured visual summaries. KnowLens organizes the content into key points, readable labels, clear sections, and visual hierarchy so the topic is easier to understand, teach, and review.
Use KnowLens to turn educational ideas into structured visuals for studying, teaching, explaining, and sharing.
Turn lesson topics and teaching notes into classroom-ready visuals with clear sections and labels.
Convert study notes and key concepts into visual summaries that are easier to review.
Explain science concepts with structured diagrams, labels, and educational layouts.
Turn historical events, timelines, and key facts into clear educational infographics.
Create visuals for maps, regions, landforms, climate, and location-based learning topics.
Break down one idea into key points, examples, and visual sections for quick understanding.
Start with a learning topic or notes. KnowLens helps organize the idea into a clear visual structure.
Start with a lesson topic, study notes, a short explanation, or plain text.
KnowLens organizes the content into sections, key points, labels, and visual hierarchy.
Create an educational infographic, visual study guide, poster-style learning visual, or carousel-style educational visual.
Prompt starters
Start with a complete explanation or a short topic. Add key points, steps, examples, and the target audience for better results.
For best results, include the audience, key facts, steps, examples, and the learning goal you want to explain.
Use the educational infographic maker when a learning topic needs to become clear, visual, and easy to review.
Turn study notes and concepts into visual study guides.
Create classroom-ready infographics from lesson topics and explanations.
Create simple learning visuals that help students understand difficult concepts.
Turn lesson ideas and teaching points into visual learning materials.
Create educational visuals for blogs, social platforms, and learning content.
Create quick educational posters and knowledge visuals without a designer.
KnowLens is built for visual explanation, not generic AI art.
Create educational visuals with clear headings, labels, and short text blocks that are easier to scan.
Organize educational topics into steps, key facts, comparisons, examples, or review points.
Emphasize the most important ideas with sections, spacing, titles, and visual grouping.
Start from a lesson idea, notes, or explanation instead of a blank canvas.
Create visuals for studying, teaching, reviewing, and sharing learning ideas.
Practical answers for turning learning topics, notes, and plain text into clearer visual summaries.
An educational infographic maker turns learning topics, notes, or plain text into structured visual summaries. KnowLens helps organize the content into key points, readable labels, and a clear visual hierarchy.
Yes. You can start with study notes, lesson notes, a topic, or plain text, and KnowLens can help turn it into an educational infographic, visual study guide, or poster-style learning visual.
You can create visuals for science, history, geography, language learning, study skills, classroom concepts, step-by-step lessons, and general knowledge topics.
No. KnowLens helps organize your educational content into a clear visual layout, so you do not need to start from a blank canvas or design template.
Yes. Teachers can use KnowLens to create classroom-ready infographics, lesson visuals, study guides, and educational posters from topics or notes.
Yes. Students can turn study notes and learning concepts into visual study guides that are easier to review.
No. KnowLens can help create educational infographics for science, history, geography, language learning, study skills, and general knowledge topics.
A normal infographic maker usually starts with templates. KnowLens starts with your educational topic or text, organizes the message, and turns it into structured visual information.
Generic AI image tools often focus on decorative images. KnowLens focuses on structured educational visuals with readable labels, clear sections, and infographic-style layouts.
For best results, include the learning topic, key facts, important steps, examples, audience, and the message you want students or readers to understand.
Start with an educational topic, notes, or plain text. Generate a structured infographic, visual study guide, or poster-style learning visual in minutes.
Explore more ways to turn learning ideas into structured infographic-style visuals.
Turn topics, notes, and plain text into structured infographics with clear visual hierarchy.
Open toolCreate structured science visuals for biology, astronomy, earth science, and classroom topics.
Open toolTurn cells, body systems, ecosystems, and life science topics into readable visuals.
Open toolCreate structured Earth Science visuals for natural systems, geology, weather, and classroom topics.
Open toolCreate step-by-step visuals for workflows, tutorials, and classroom explanations.
Open toolBrowse example educational visuals and infographic ideas before creating your own.
Open tool