About this astronomy infographic
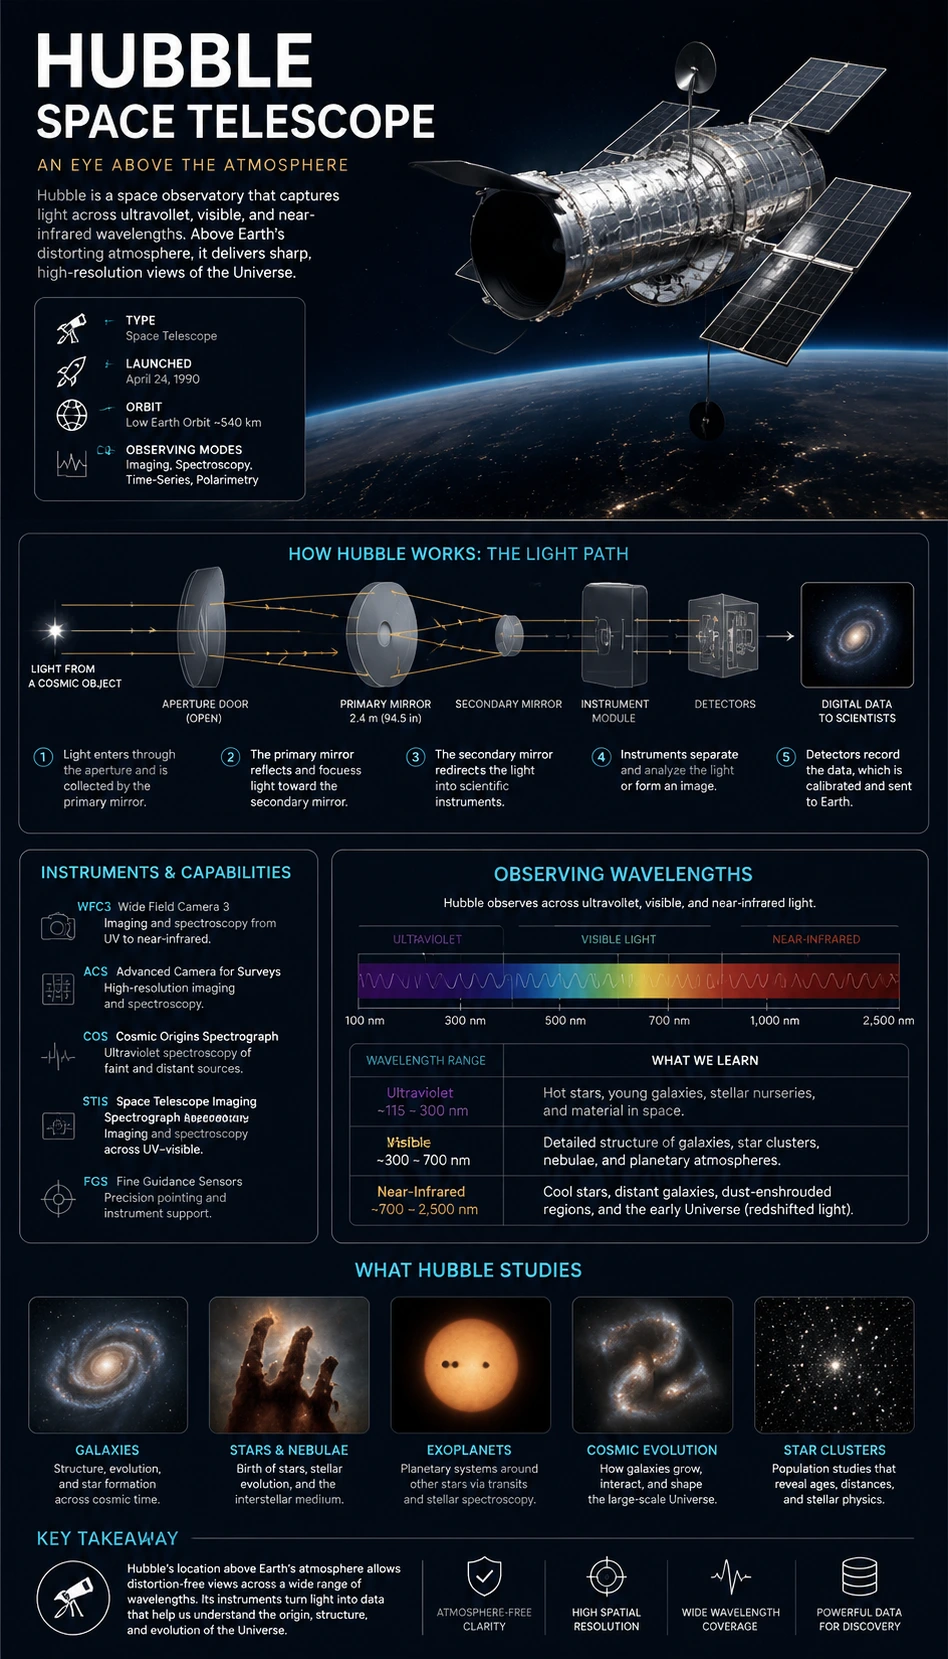
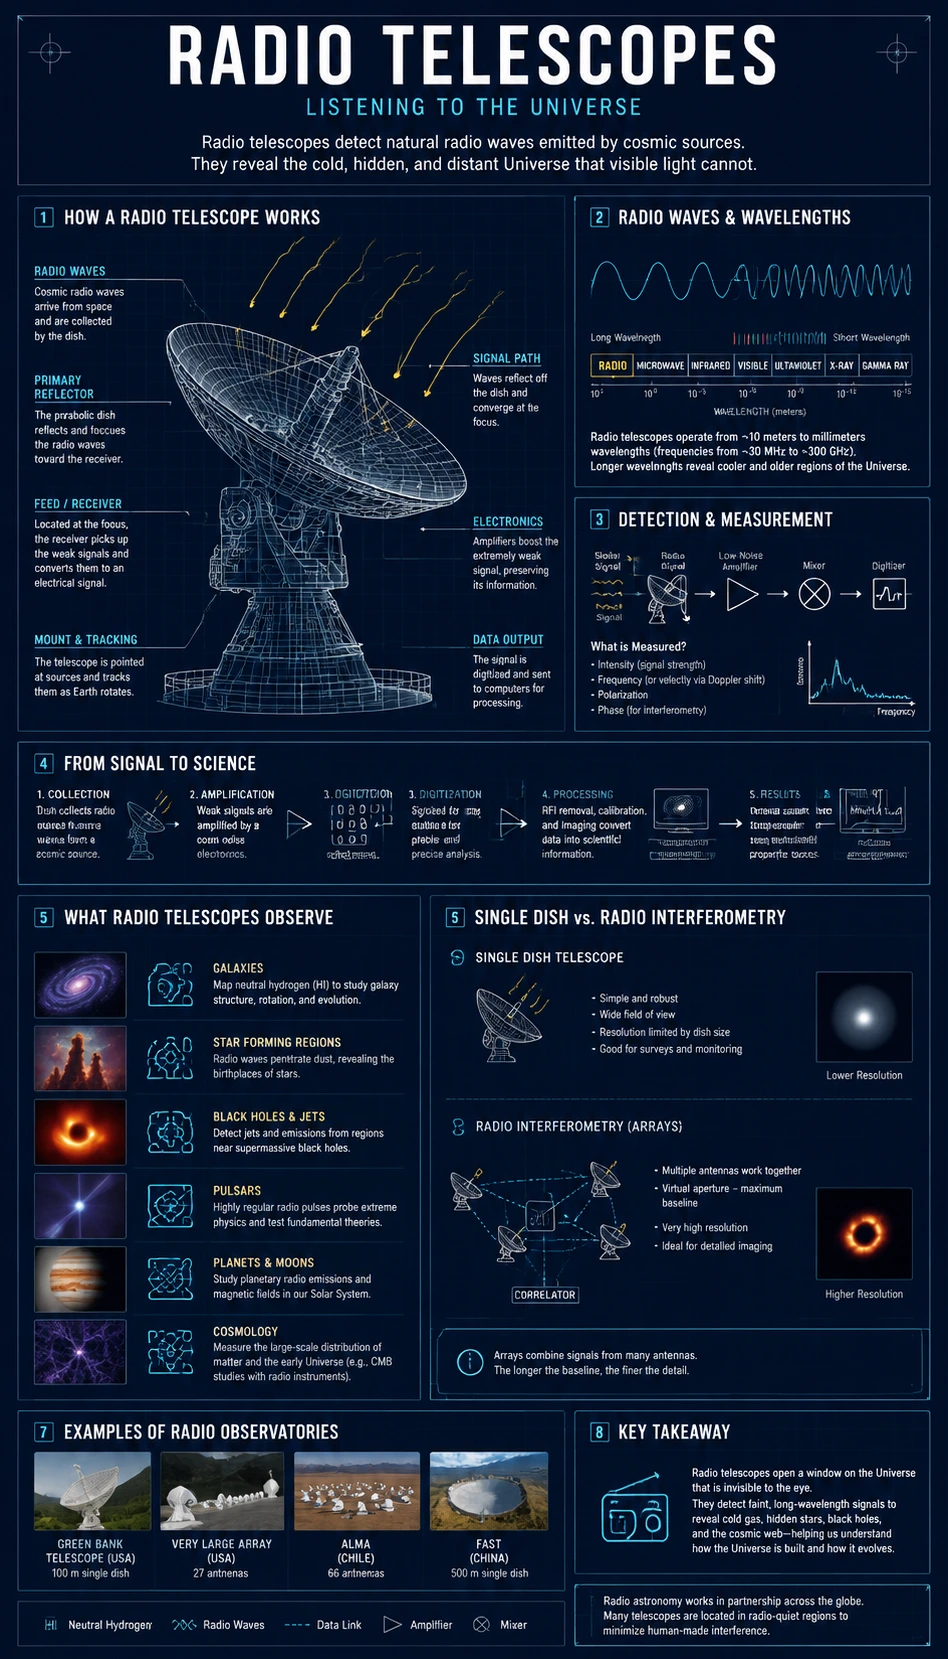
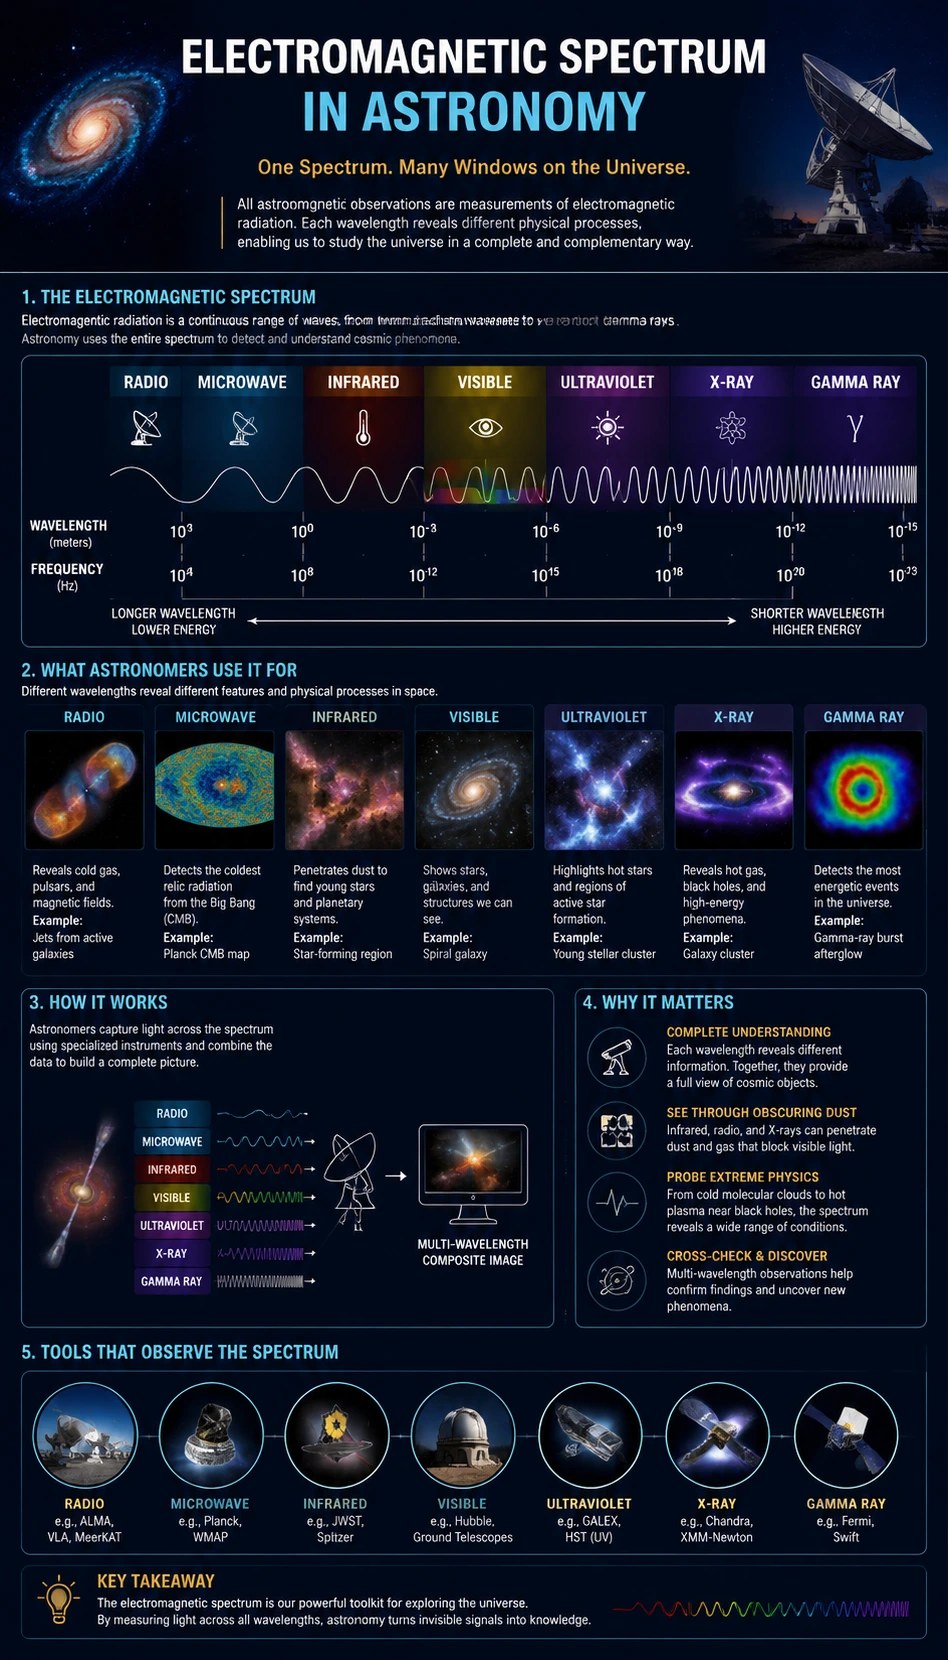
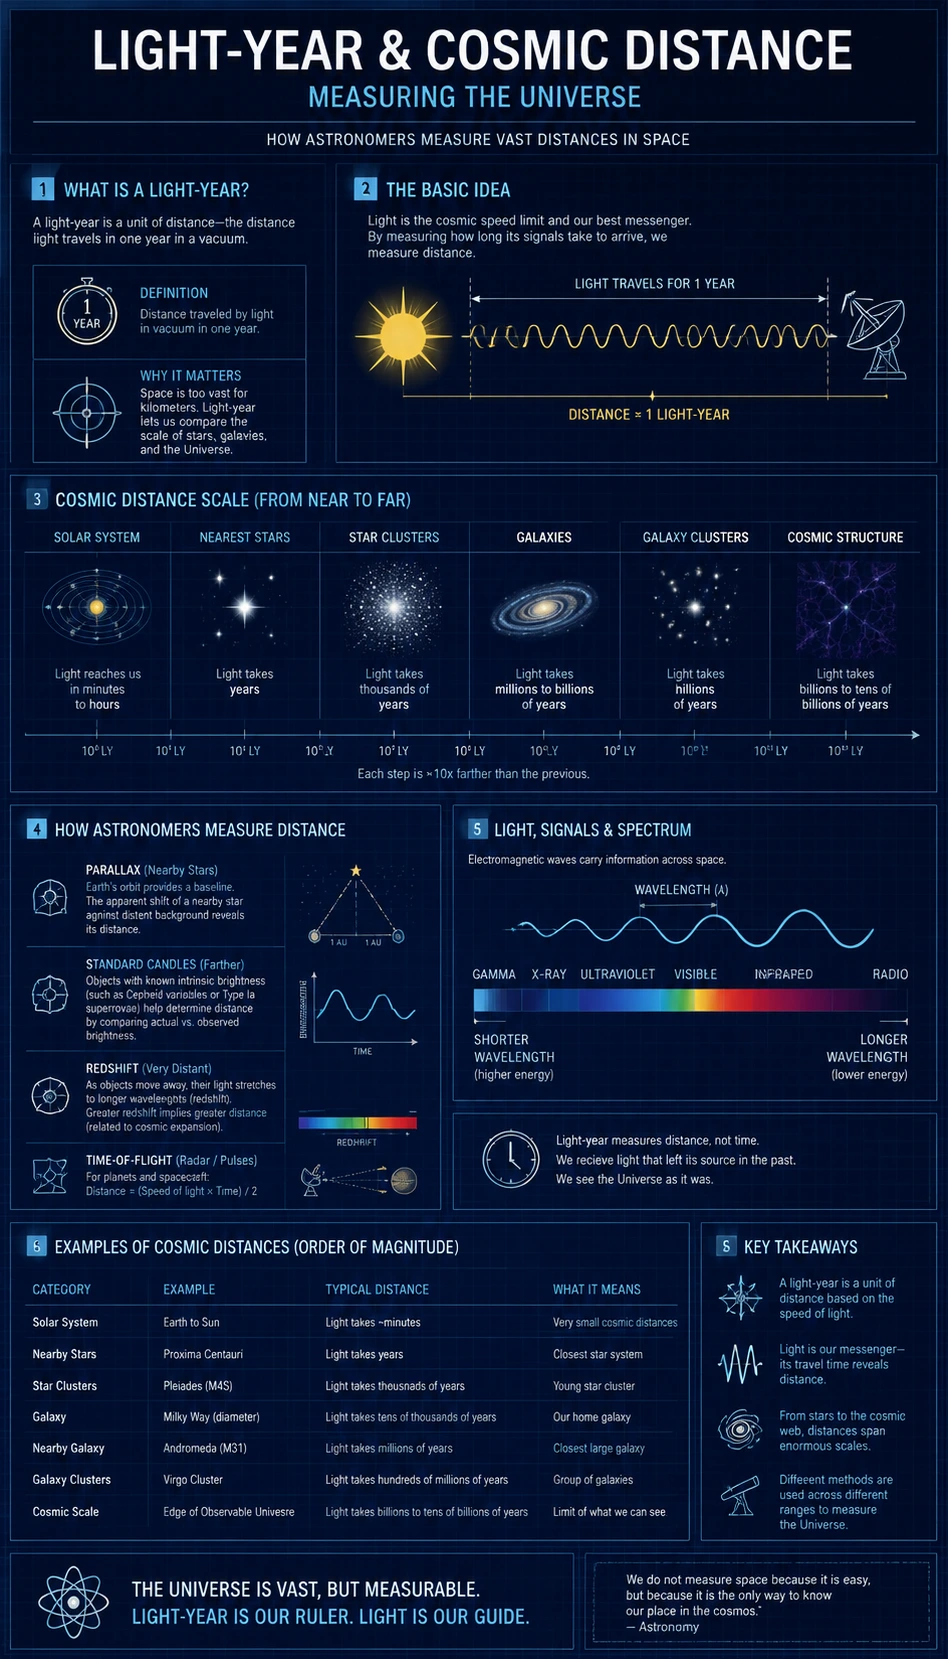
This Light-Year and Cosmic Distance Infographic explains light-year and cosmic distance as a clear astronomy measurement visual. Concepts such as distance, light, and spectrum can feel abstract, so the infographic can use scale markers, signal diagrams, and concise examples to make the relationship easier to understand. It is designed for students, teachers, and science creators who need a professional visual guide for space learning. The example shows how an Astronomy Infographic Generator can turn astronomy measurement notes into a structured, readable infographic.