About this astronomy infographic
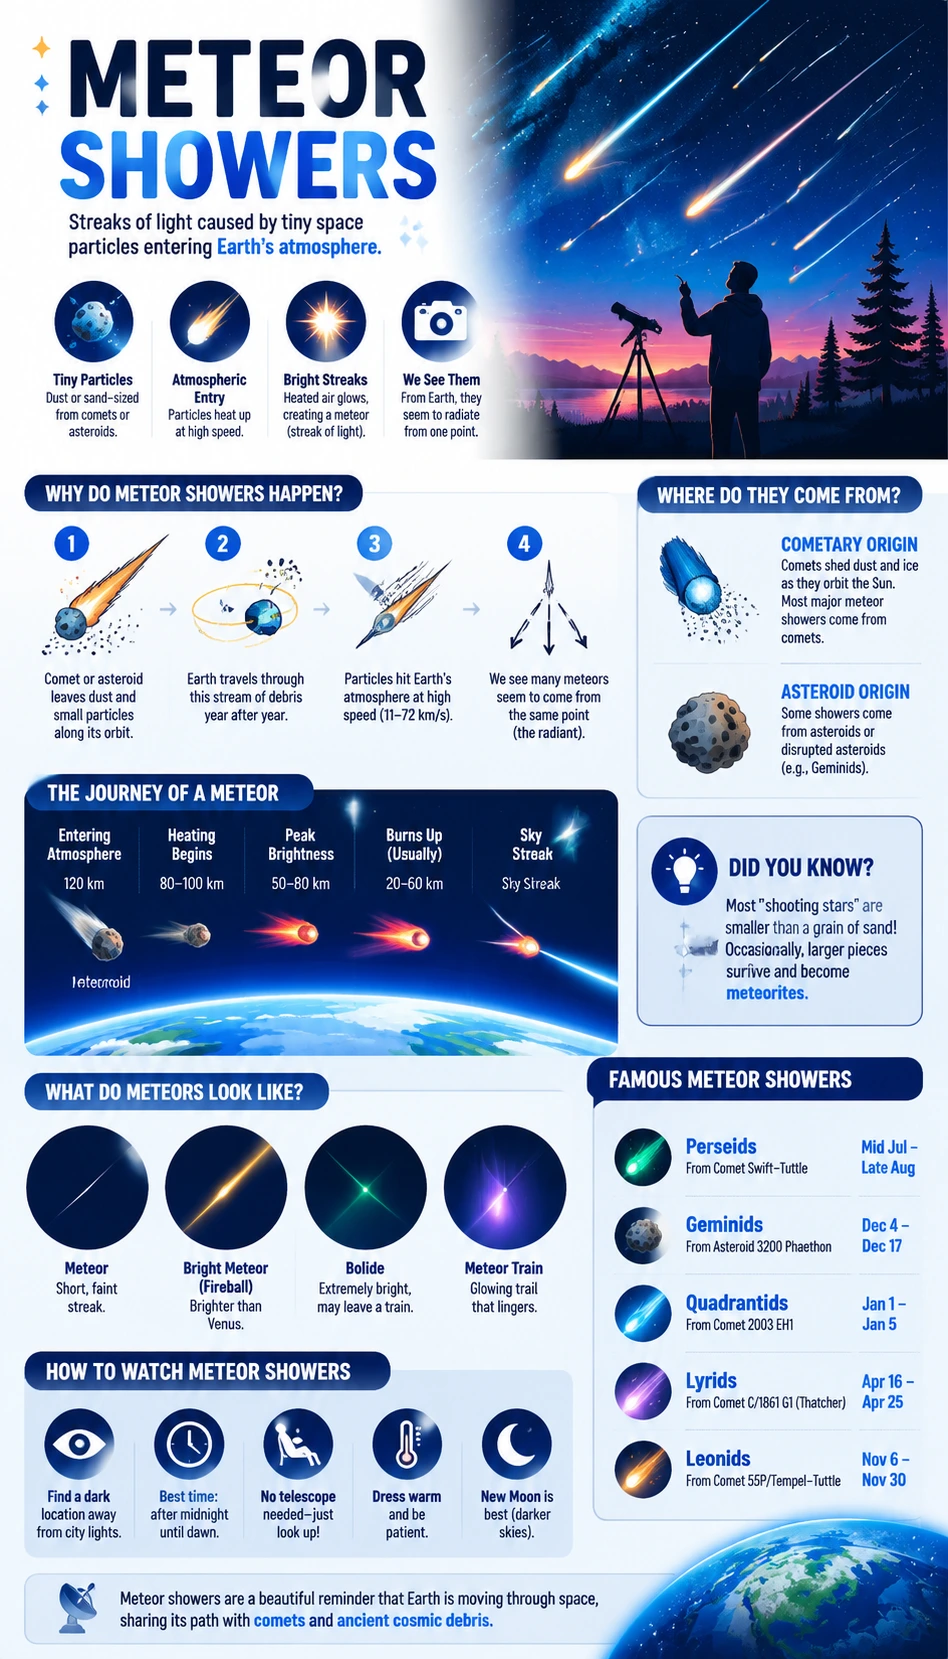
This Meteor Showers Infographic turns meteor showers into a structured astronomy visual that separates object type, location, motion, and observation. Small-body topics are easy to confuse, so the infographic can use comparison panels, orbit sketches, and concise notes to make the differences clear. It works well for students, teachers, and science creators who need a clean visual guide rather than dense text. As an Astronomy Infographic Generator example, it emphasizes accurate labels, cautious wording, and organized space science explanation.