About this astronomy infographic
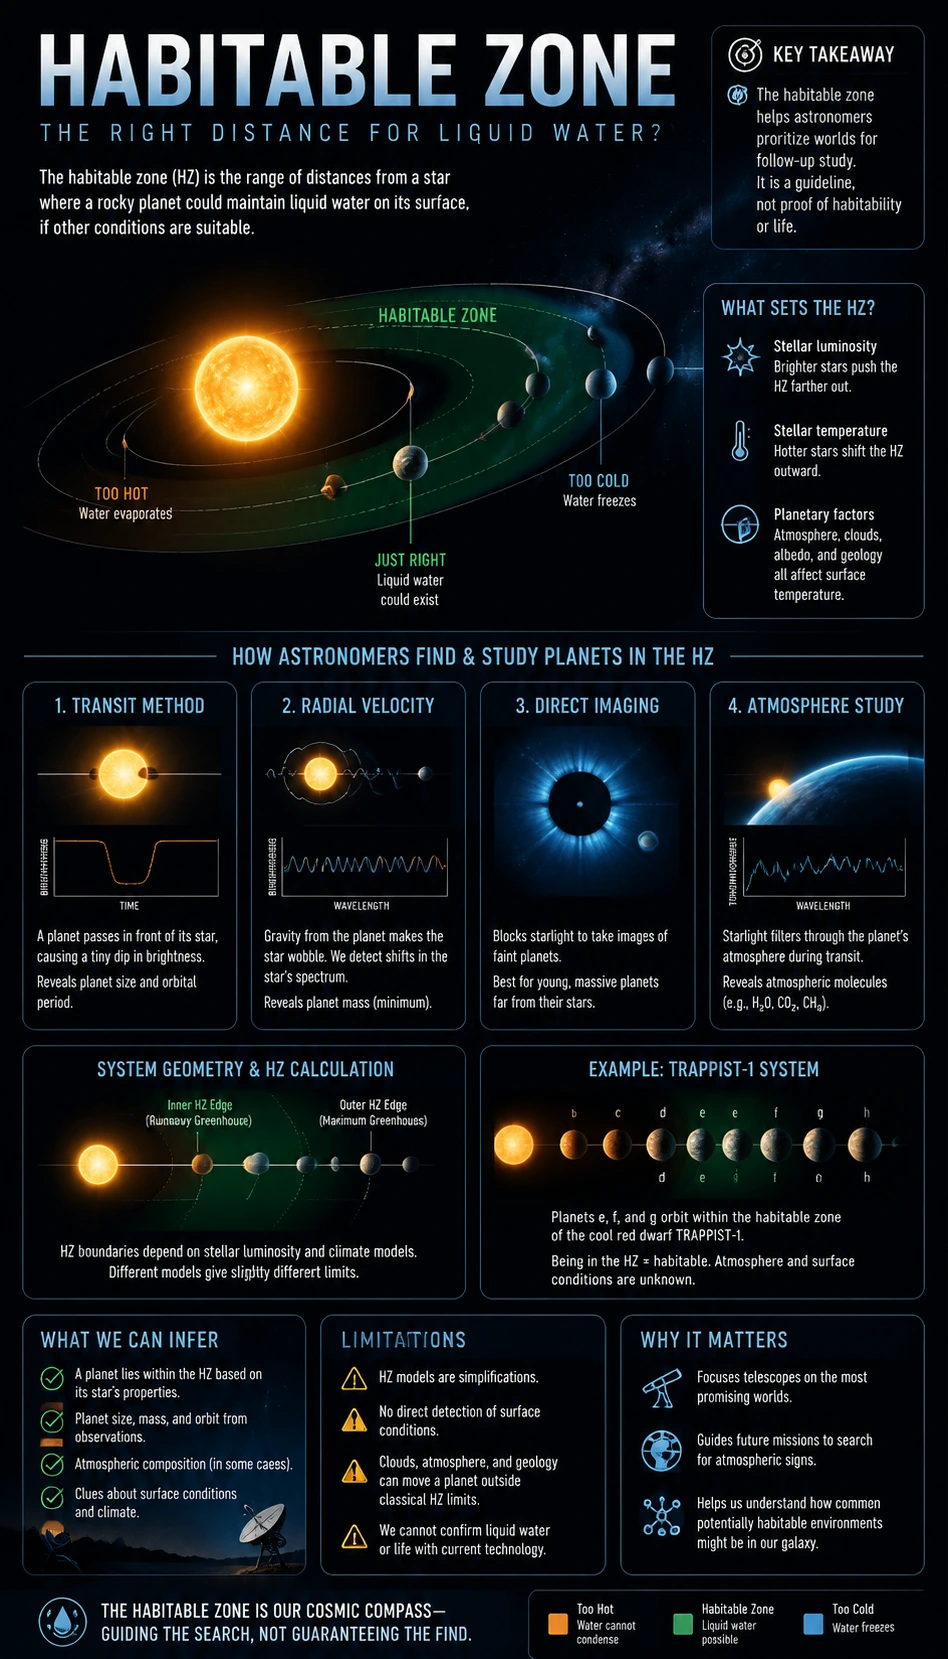
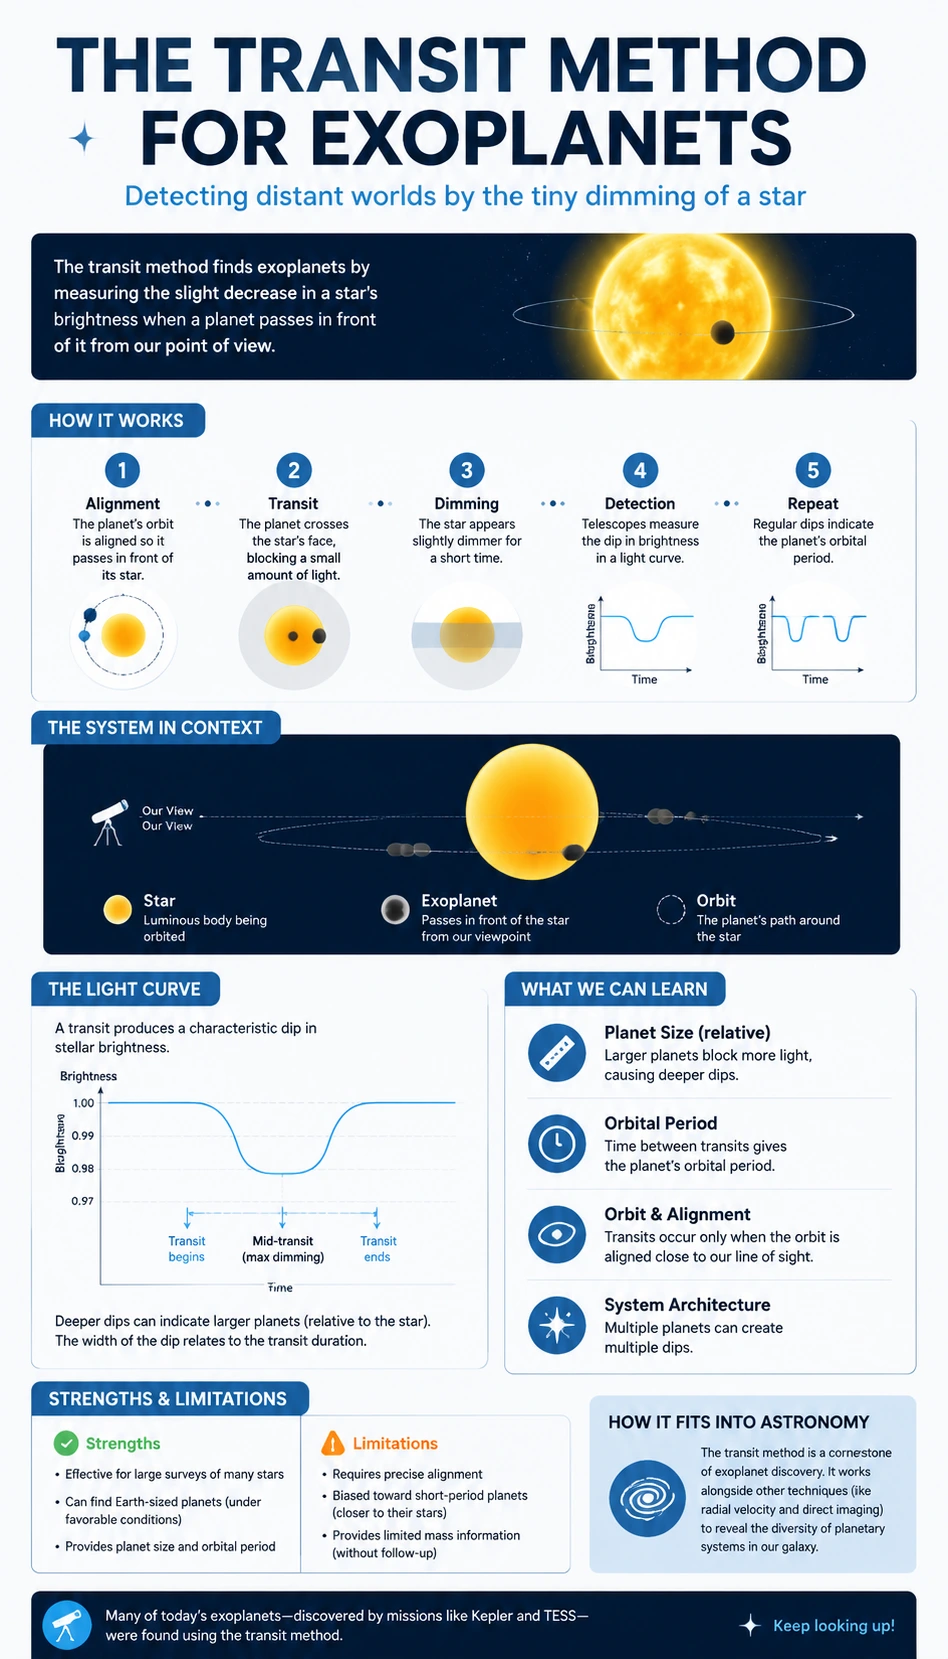
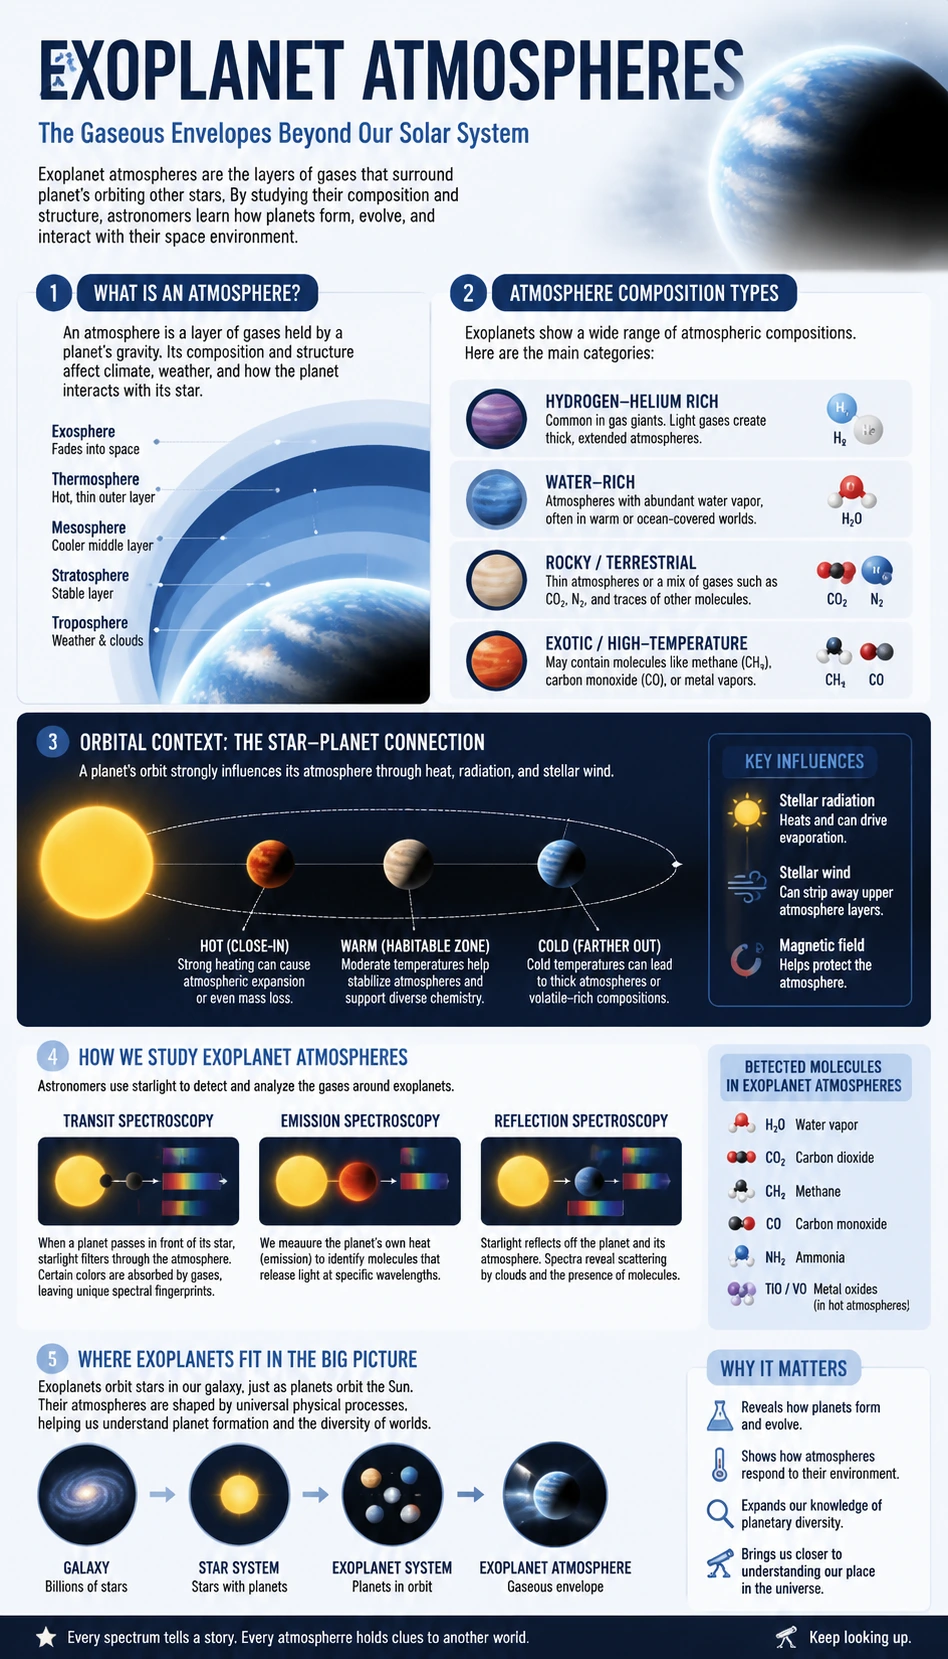
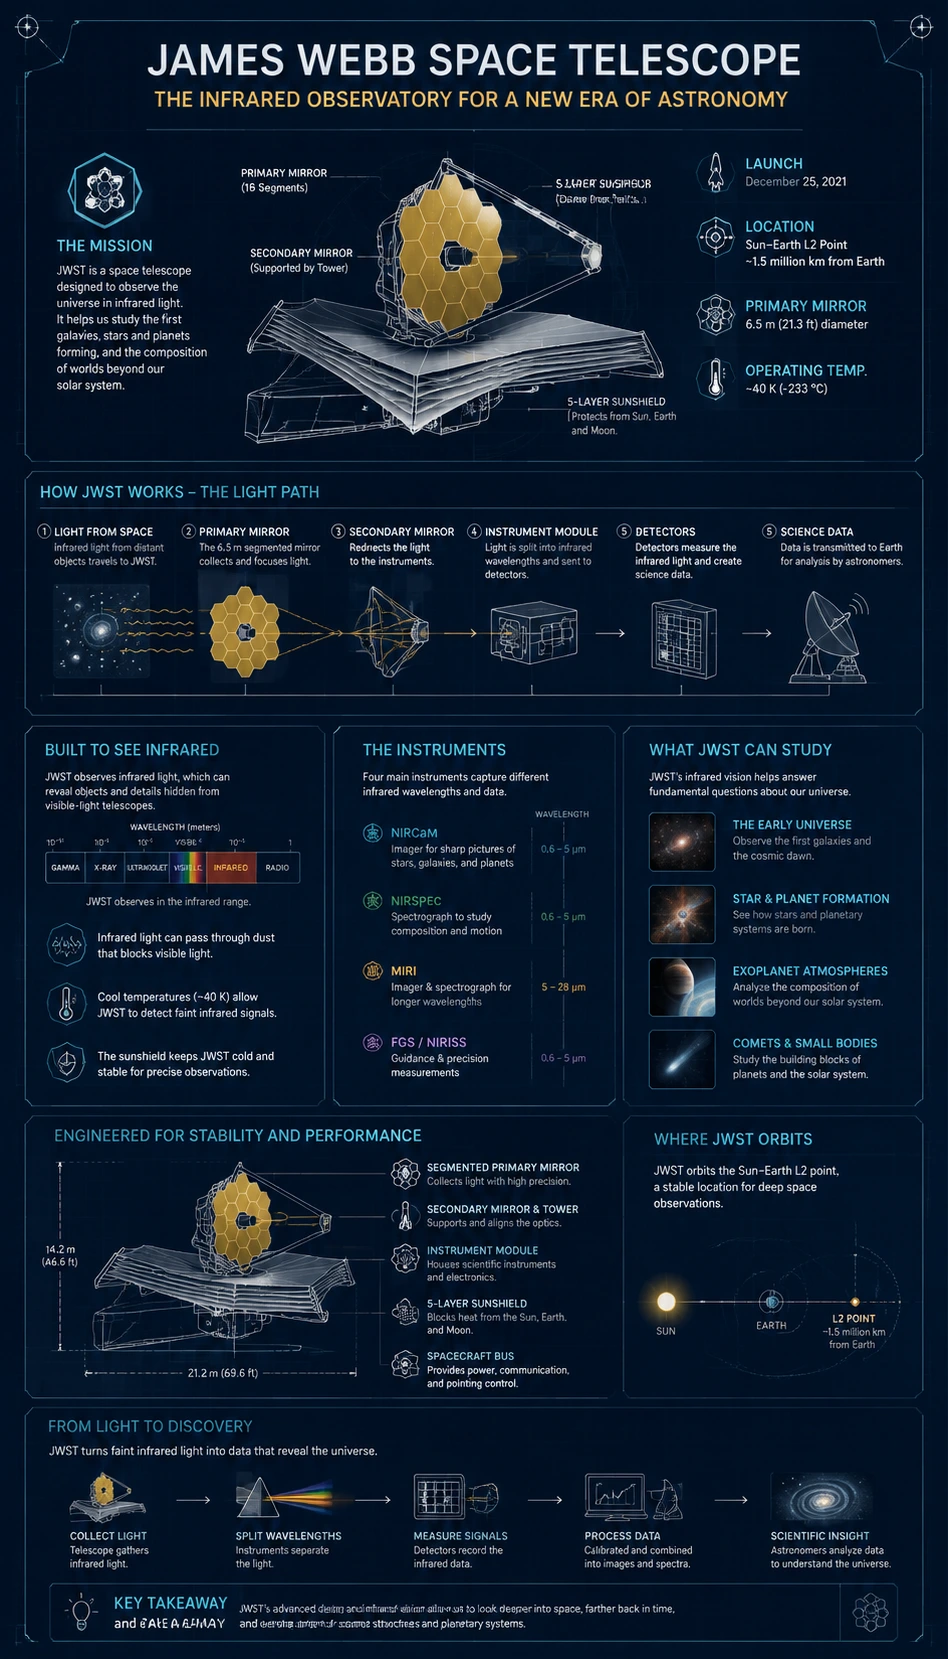
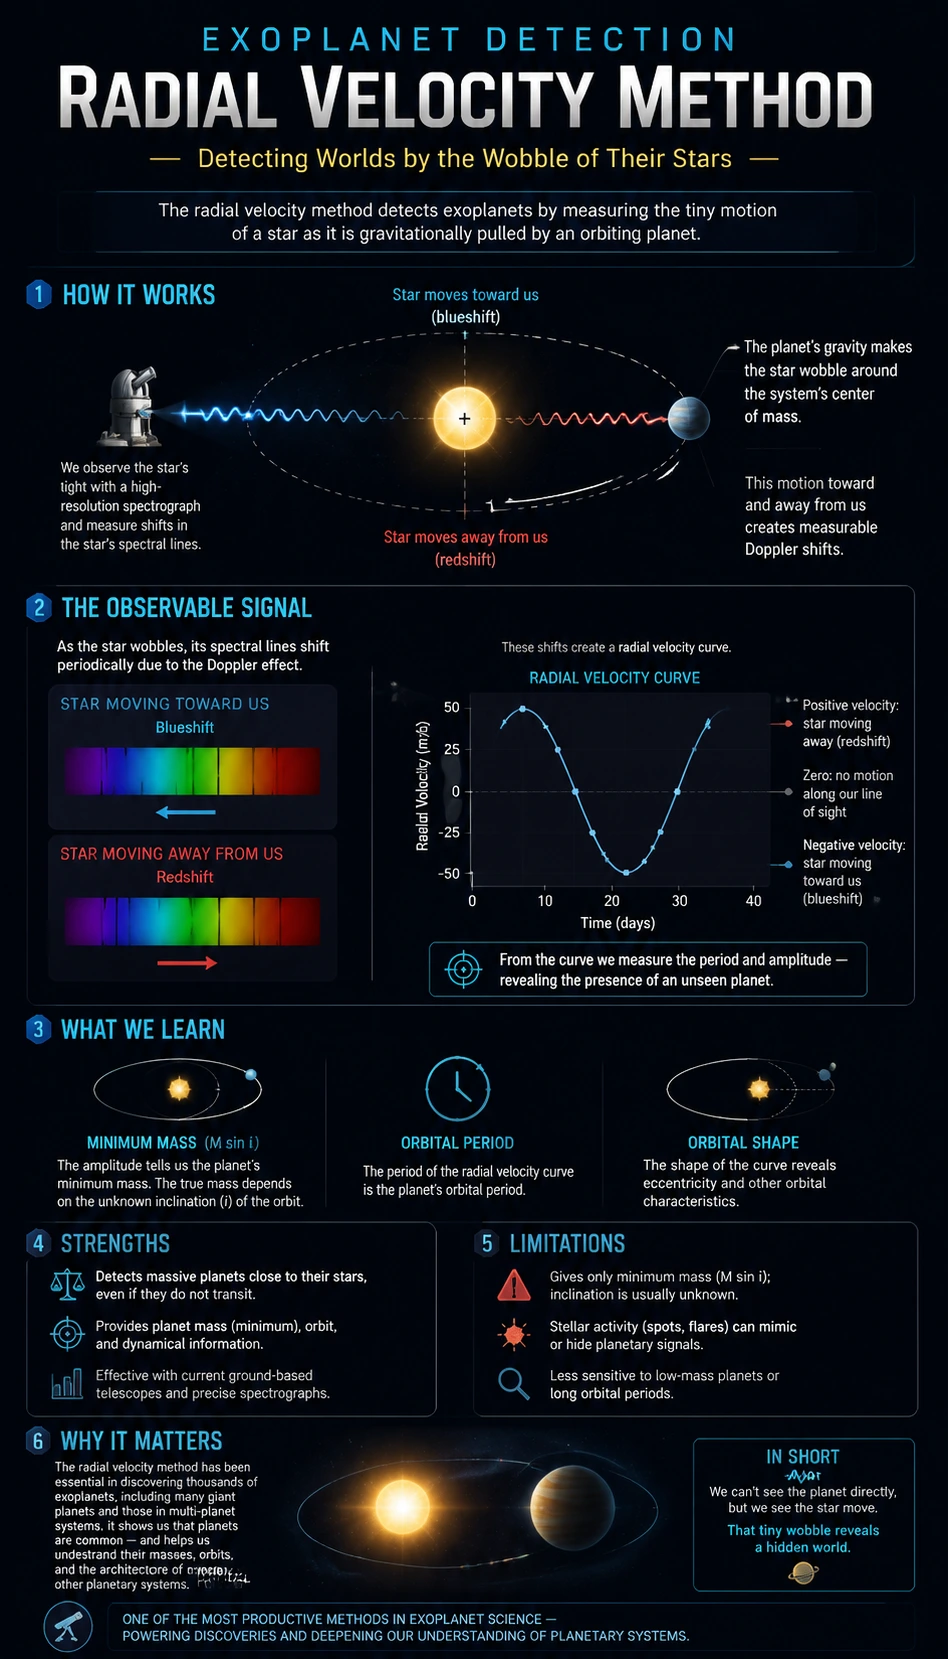
This Radial Velocity Method Infographic explains radial velocity method with a visual focus on observation, inference, system geometry, or atmosphere interpretation. Exoplanet science depends on careful signals rather than direct assumptions, so the infographic can separate evidence, method, limitations, and learning takeaways. It is suitable for students, teachers, space writers, and astronomy content creators who need a polished visual explanation. The example demonstrates how an Astronomy Infographic Generator can make modern astronomy topics easier to scan without implying unsupported claims about life or habitability.