About this astronomy infographic
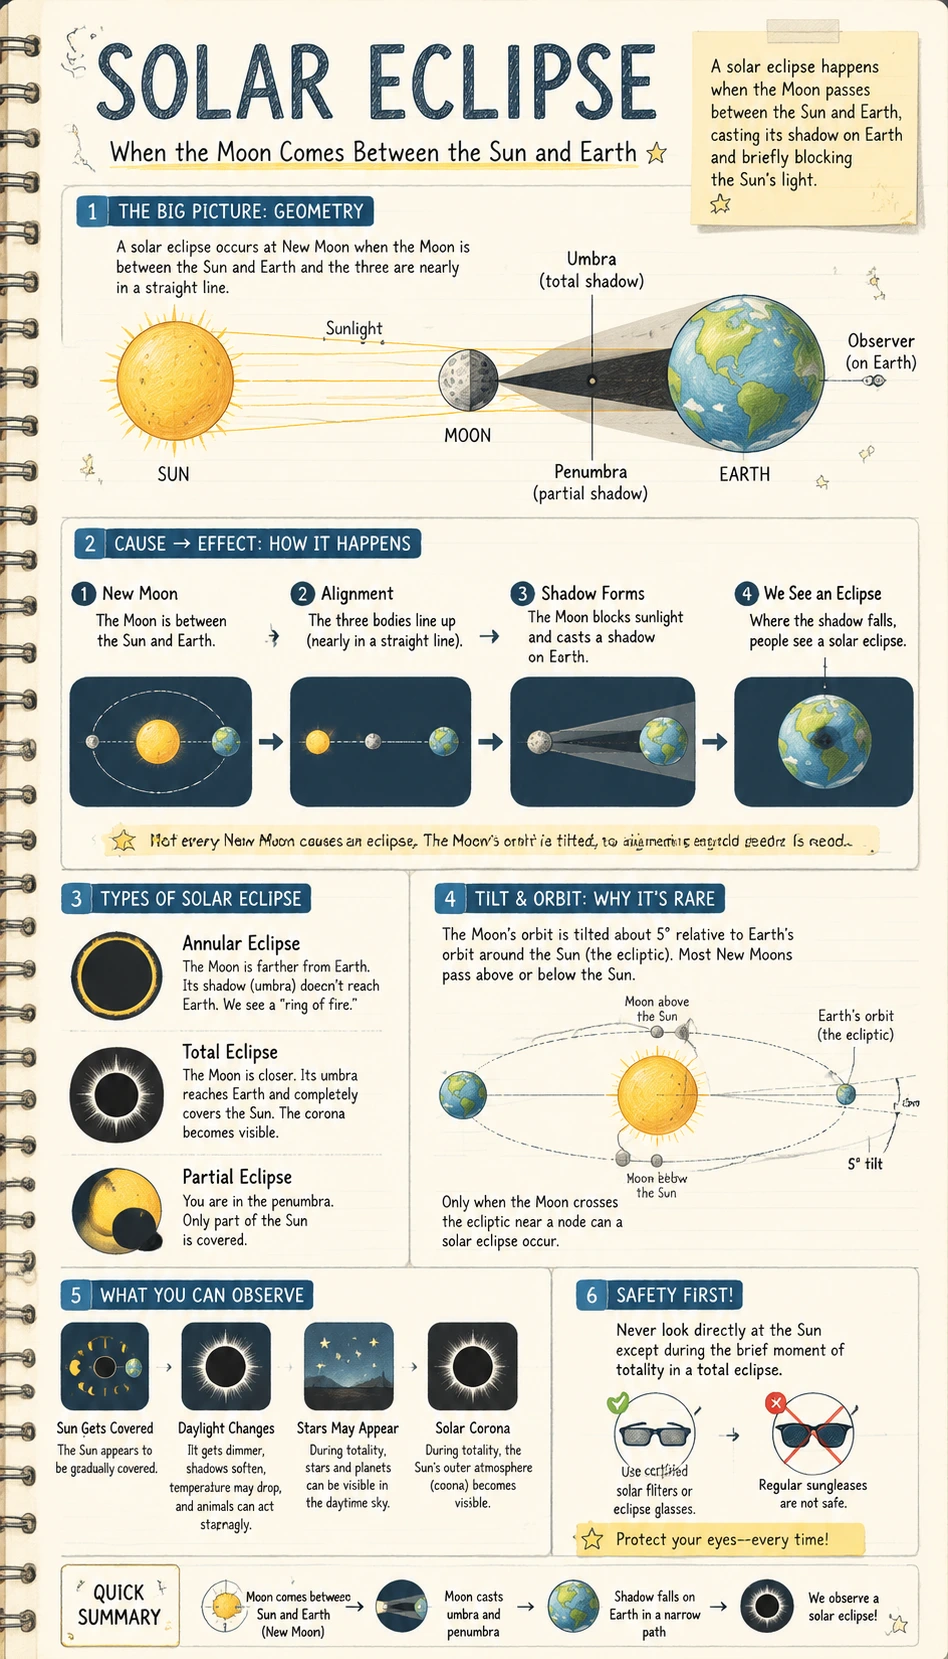
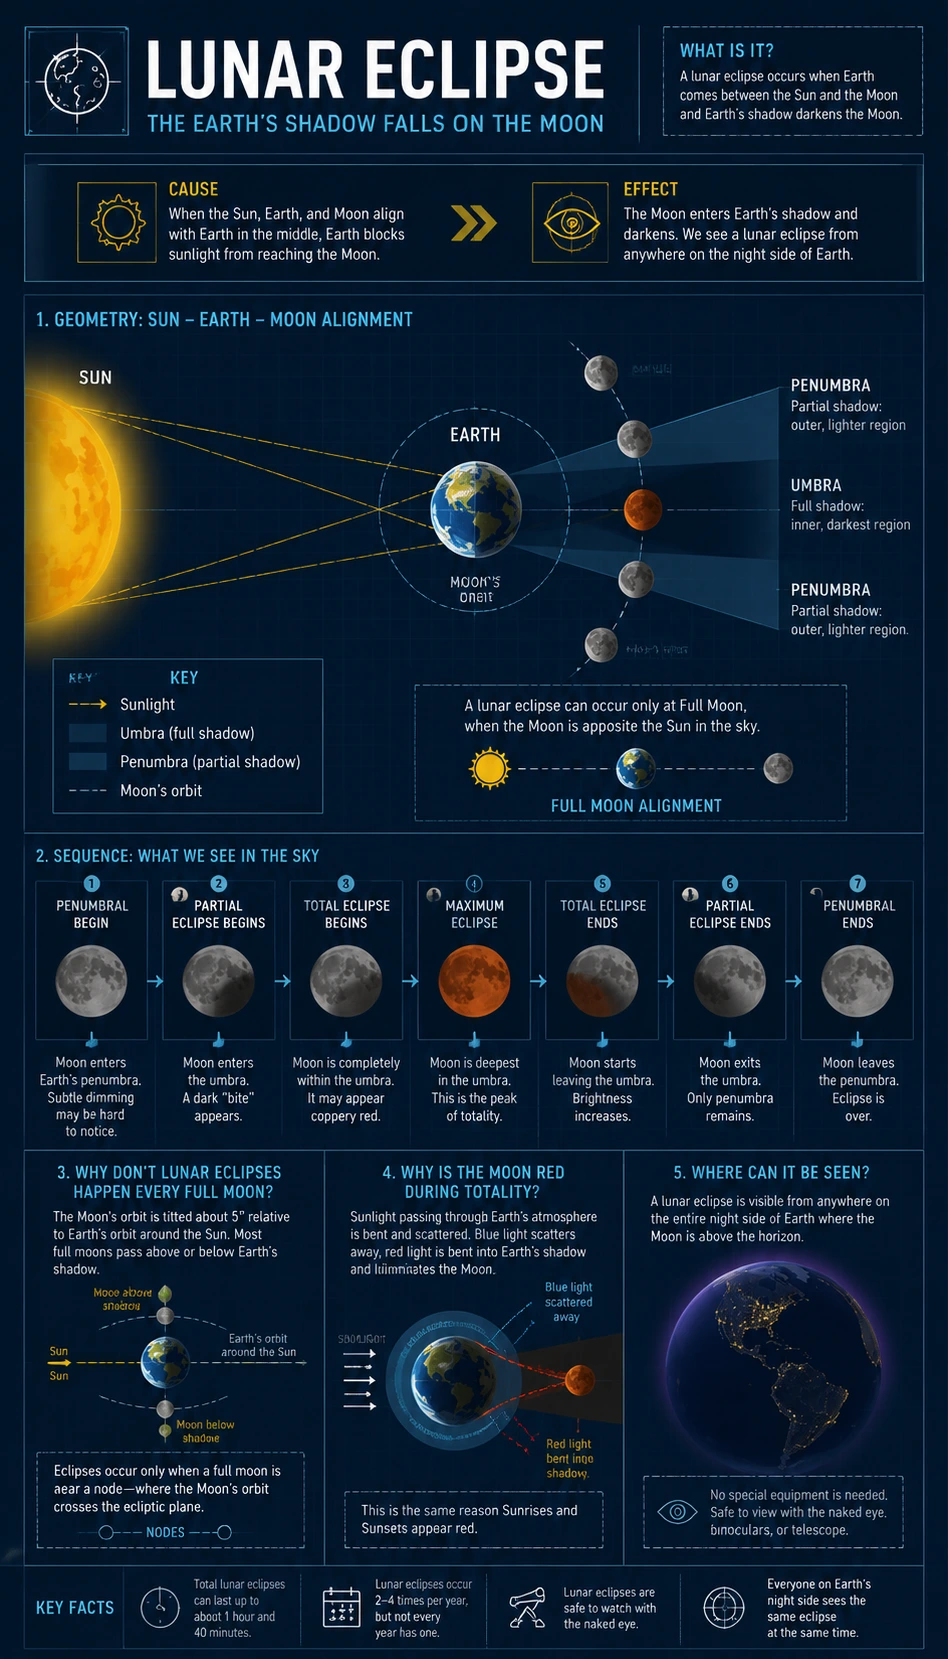
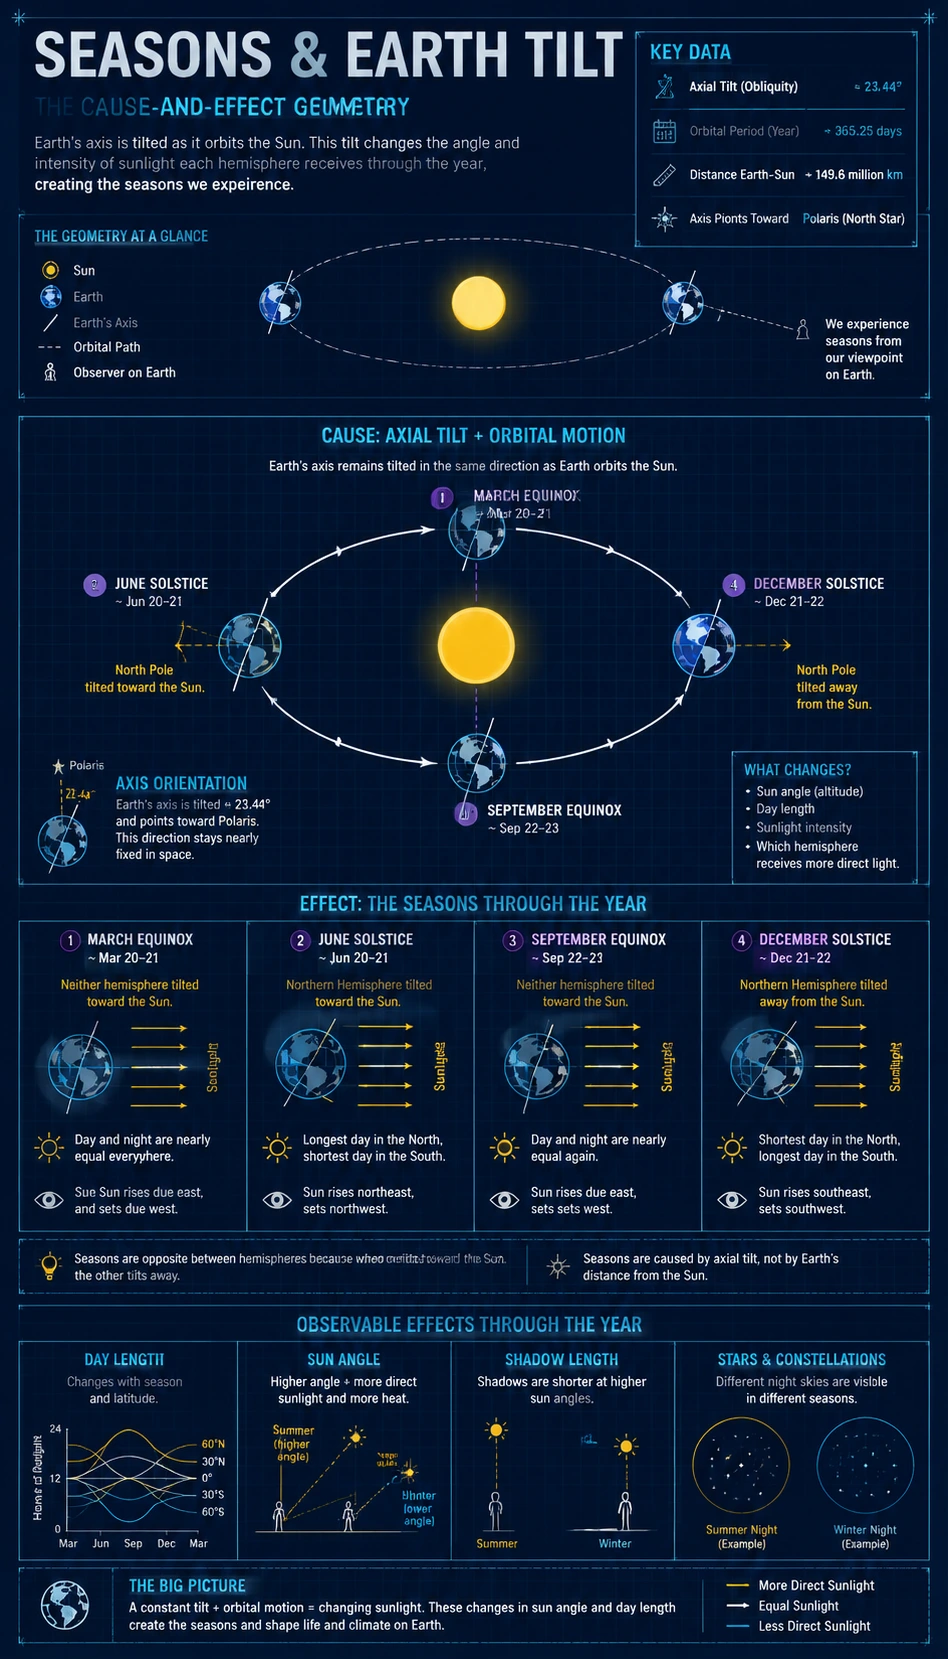
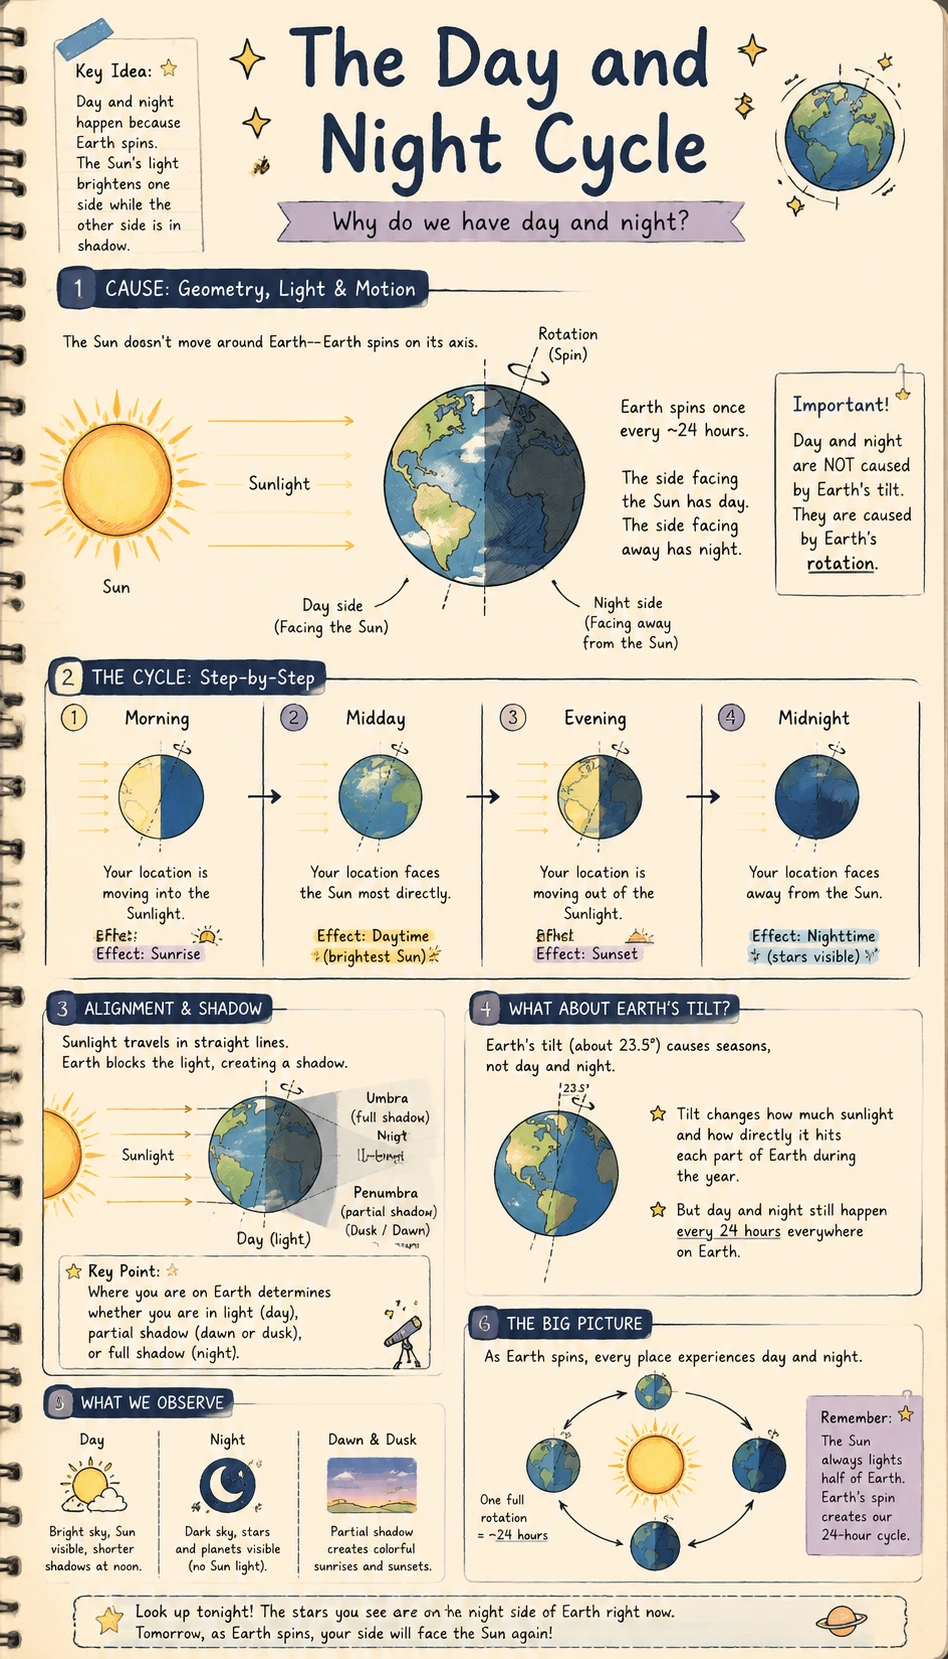
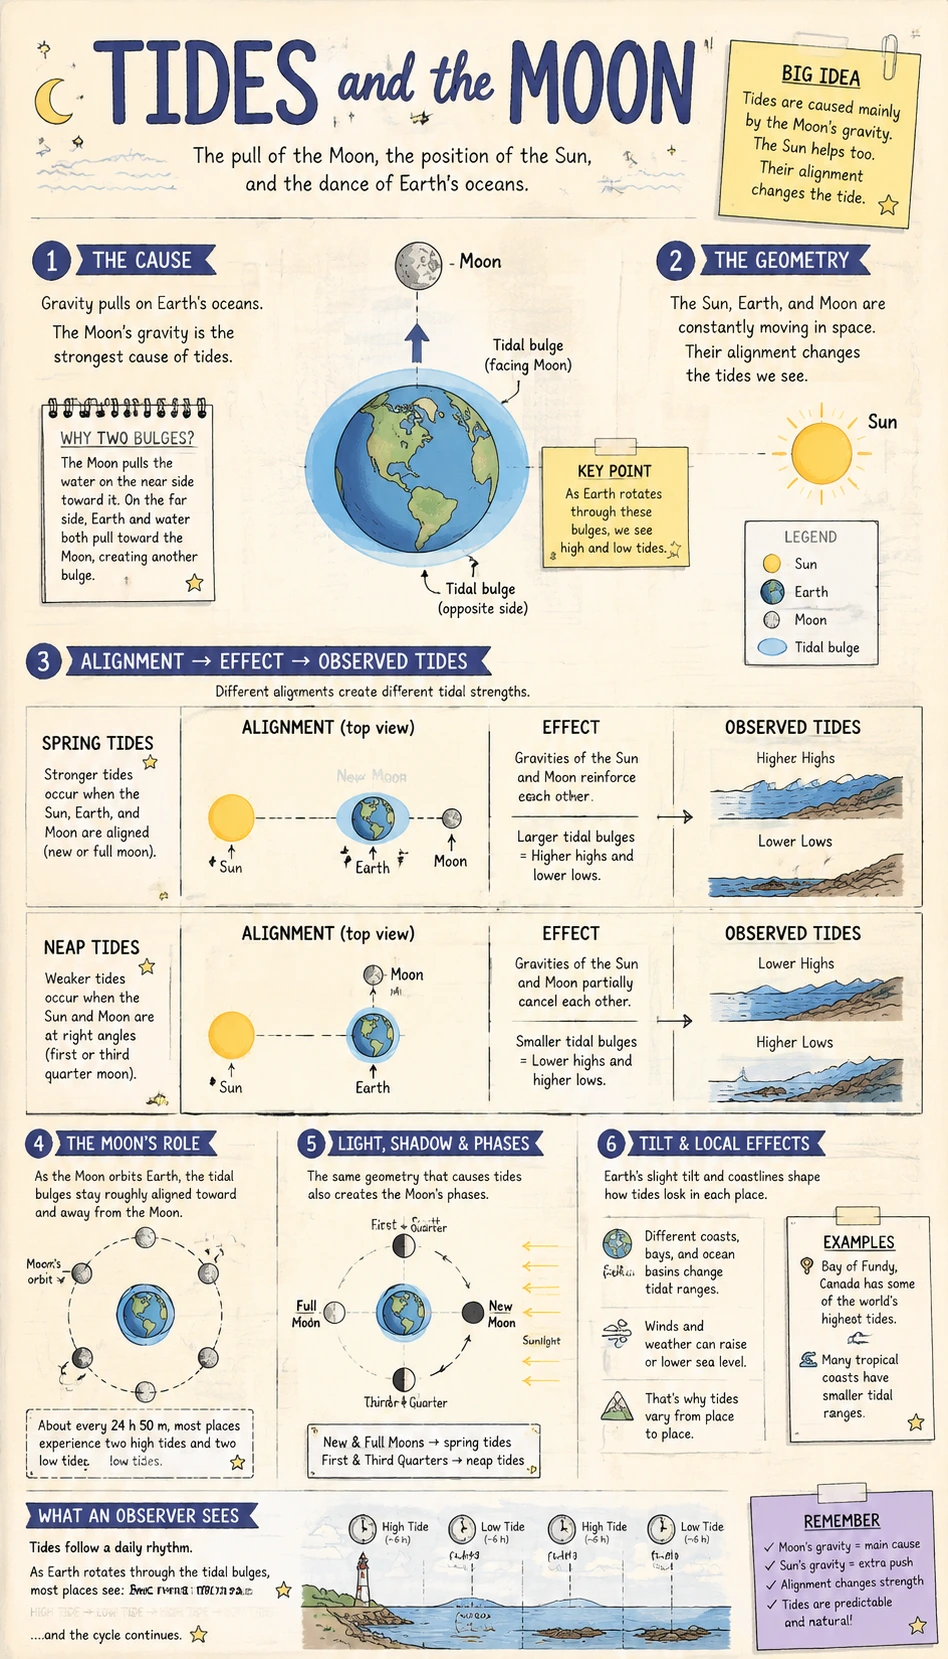
This Tides and the Moon Infographic explains tides and the moon through the geometry of light, shadow, motion, and viewpoint. Instead of treating the topic as a list of facts, the infographic can show relationships between celestial bodies and the visible effect an observer notices from Earth. It is useful for lessons, study guides, and science explainers that need clear sequencing, readable labels, and cause-and-effect structure. Built as an Astronomy Infographic Generator example, it keeps the astronomy concept visual, accurate, and easy to discuss.