SIDE-BY-SIDE EXAMPLES
Comparison Infographic Examples
Comparison infographic examples are useful when one topic is easier to understand through similarities, differences, advantages, tradeoffs, or alternatives. These templates focus on side-by-side clarity instead of dense narrative copy.
Open side-by-side templates for choices, tradeoffs, alternatives, and visual comparisons.
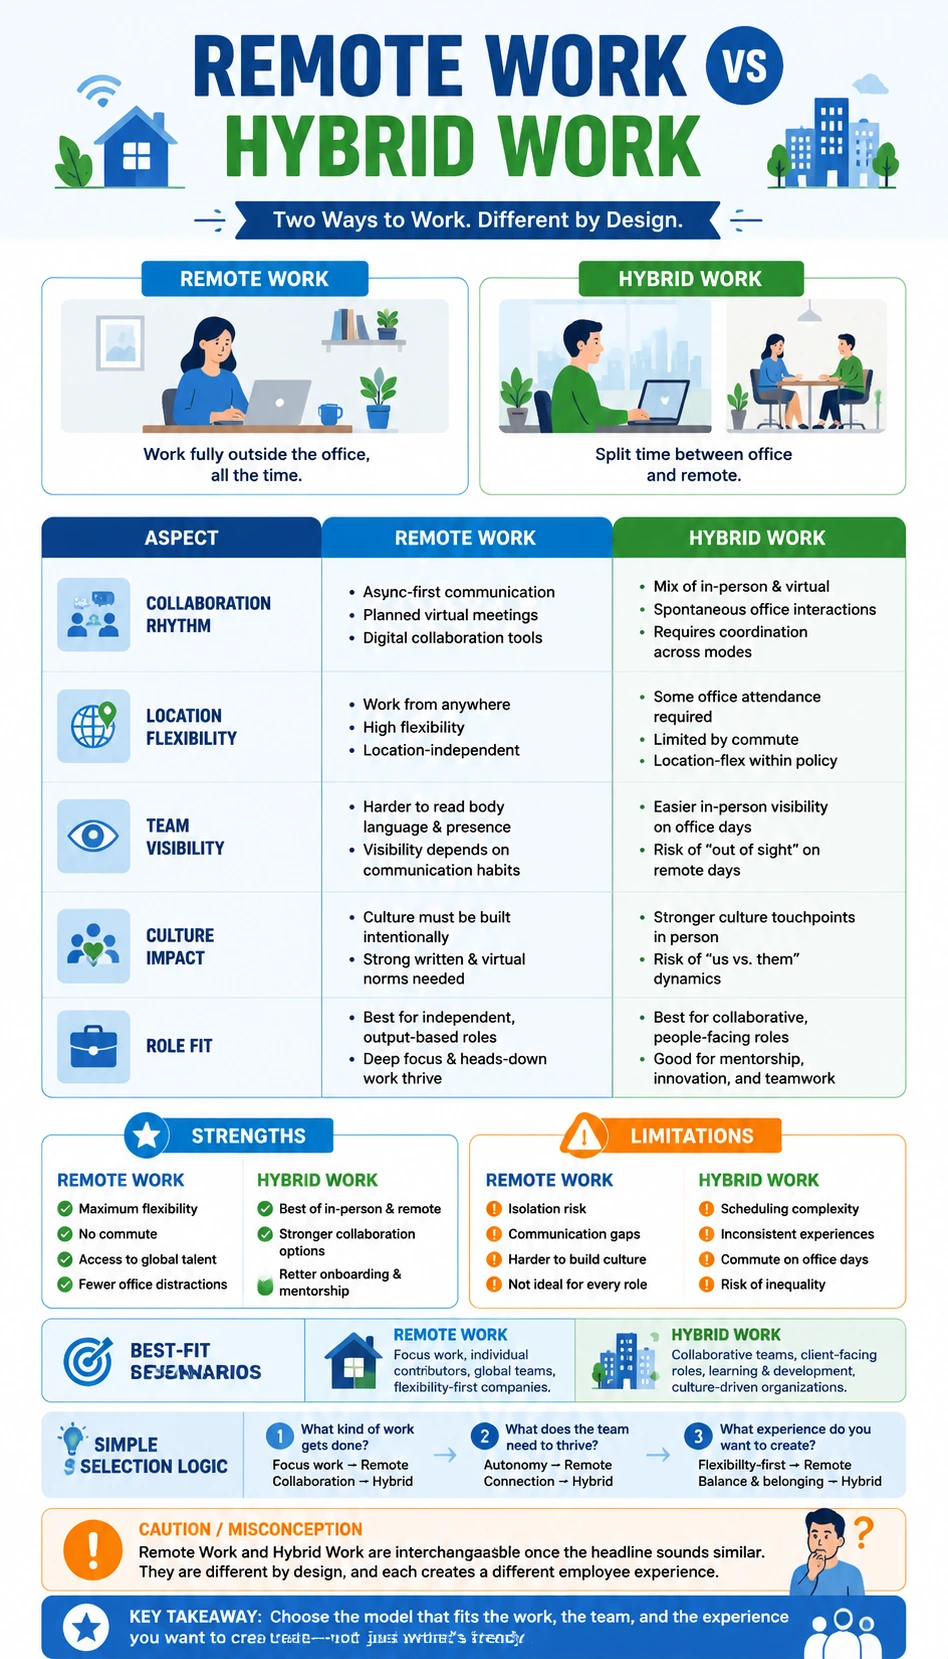
Remote Work vs Hybrid Work
A mobile-friendly remote work vs hybrid work comparison infographic template with clear trade-offs, use cases, and decision logic.
Open detail page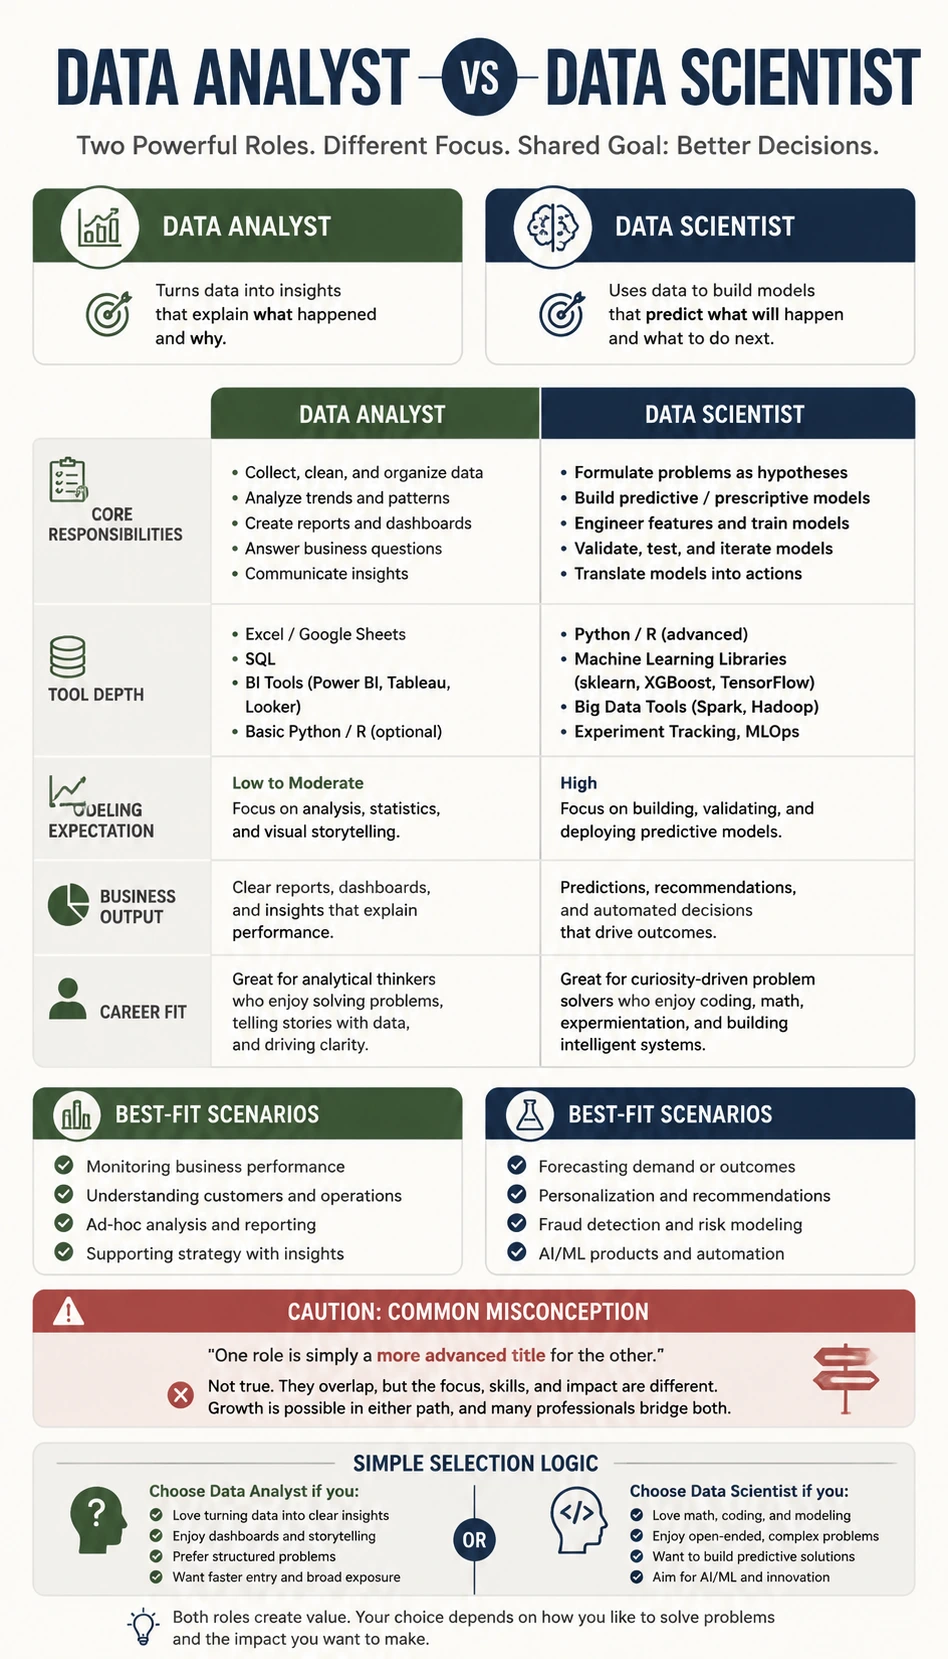
Data Analyst vs Data Scientist
A mobile-friendly data analyst vs data scientist comparison infographic template with clear trade-offs, use cases, and decision logic.
Open detail page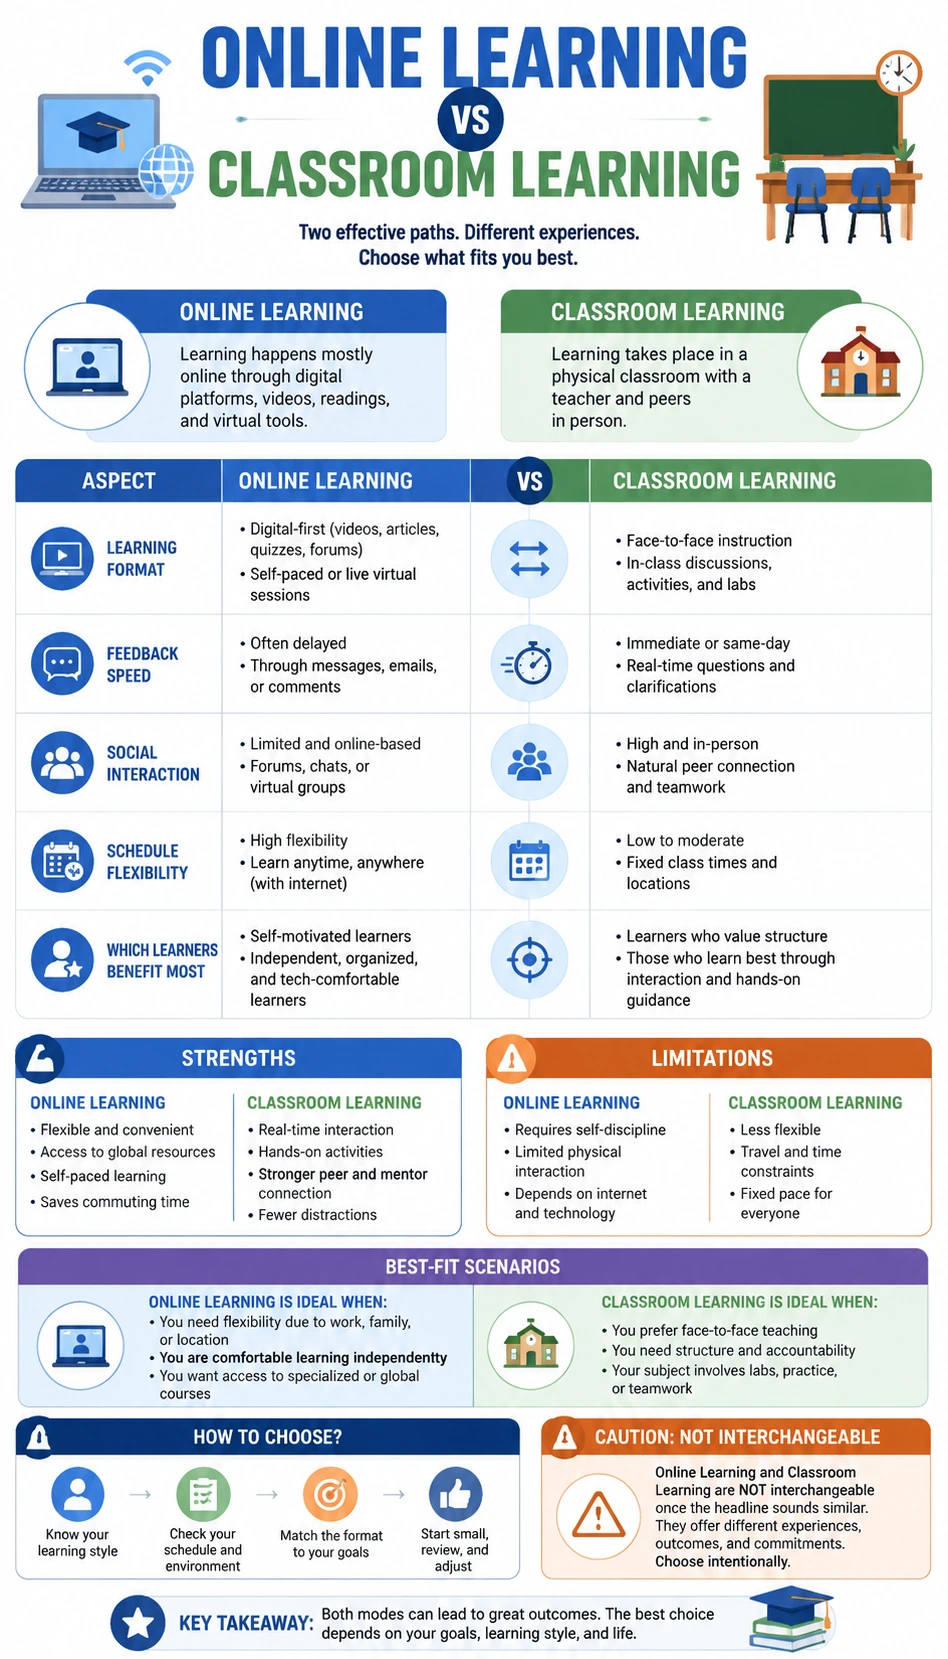
Online Learning vs Classroom Learning
A mobile-friendly online learning vs classroom learning comparison infographic template with clear trade-offs, use cases, and decision logic.
Open detail page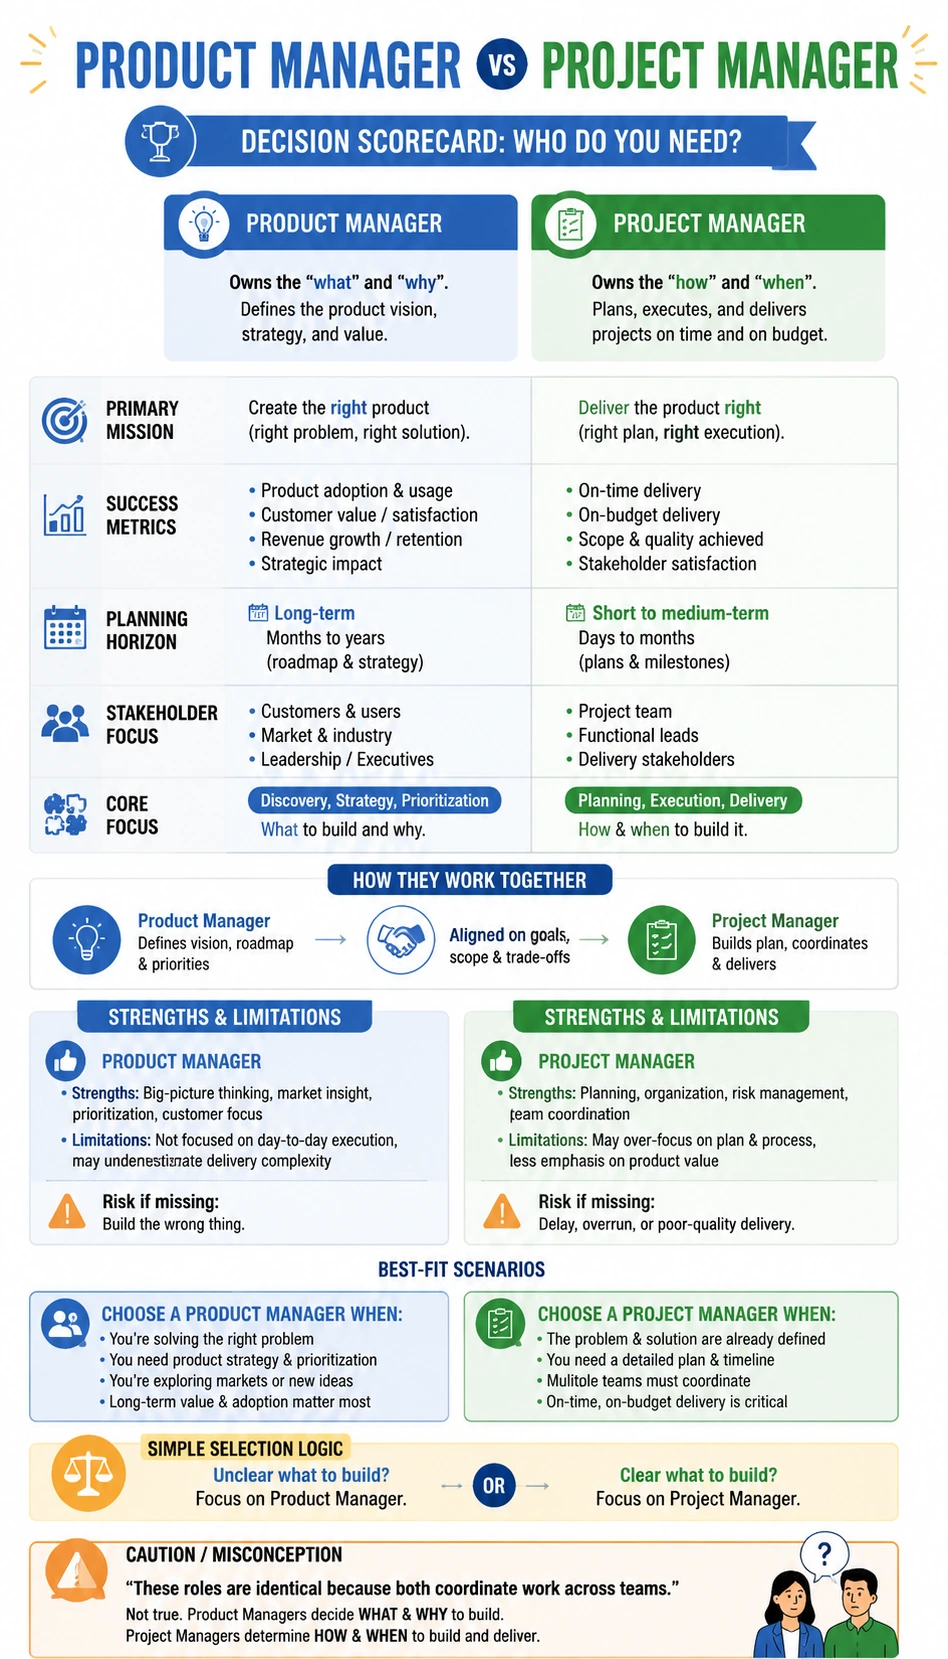
Product Manager vs Project Manager
A mobile-friendly product manager vs project manager comparison infographic template with clear trade-offs, use cases, and decision logic.
Open detail page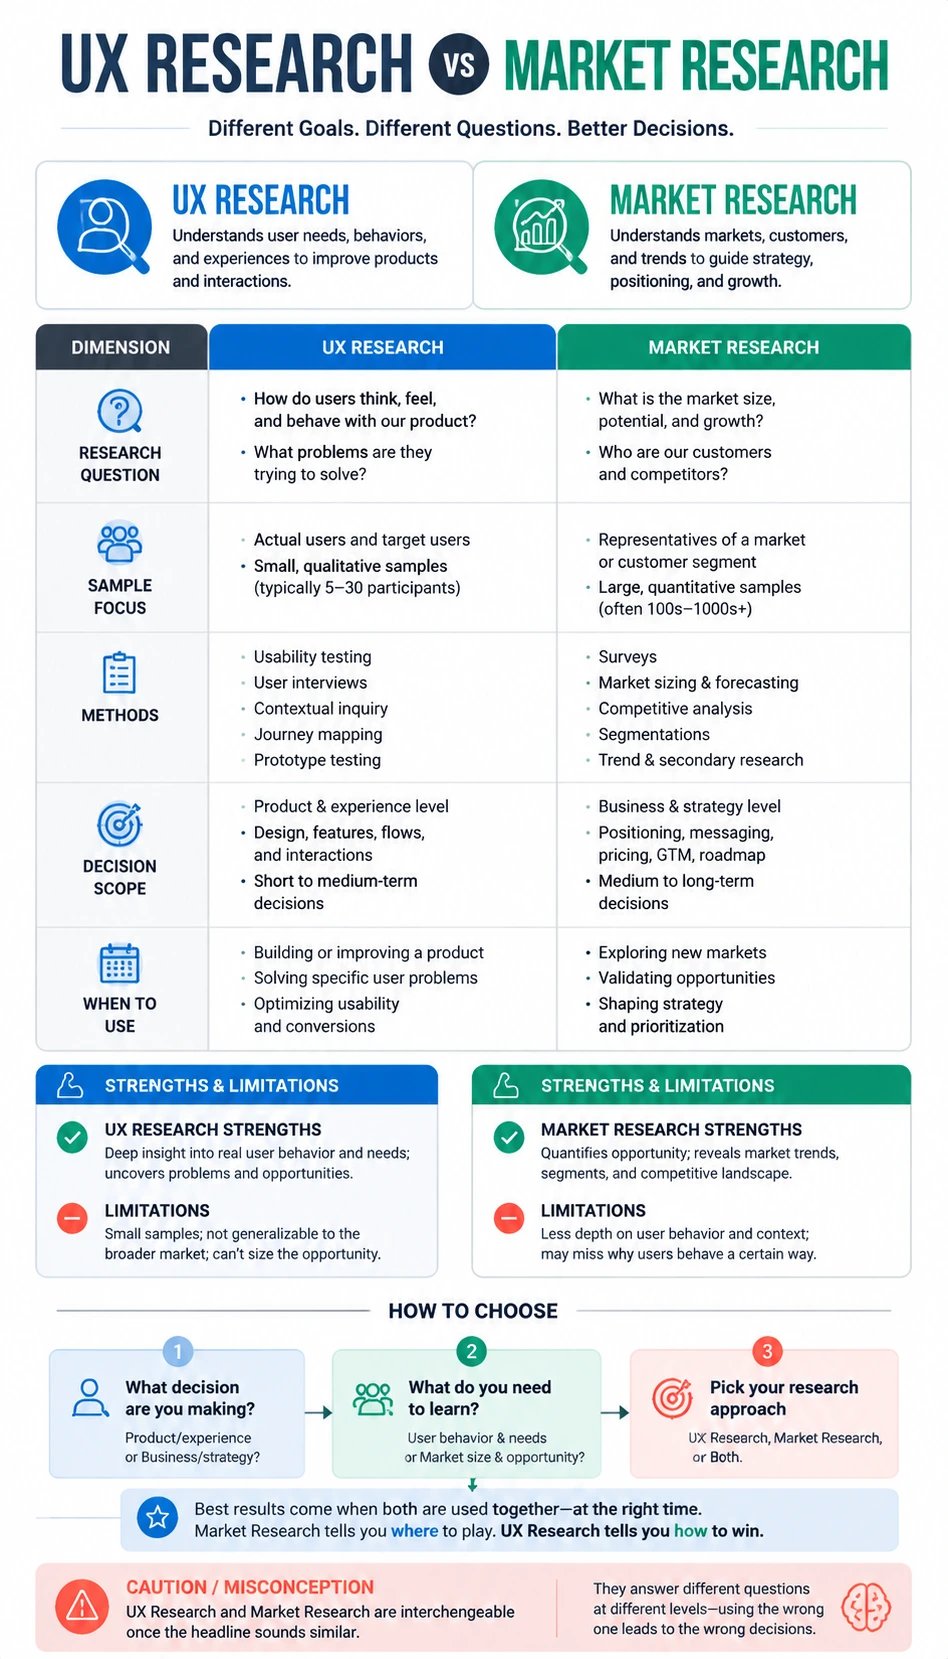
UX Research vs Market Research
A mobile-friendly ux research vs market research comparison infographic template with clear trade-offs, use cases, and decision logic.
Open detail page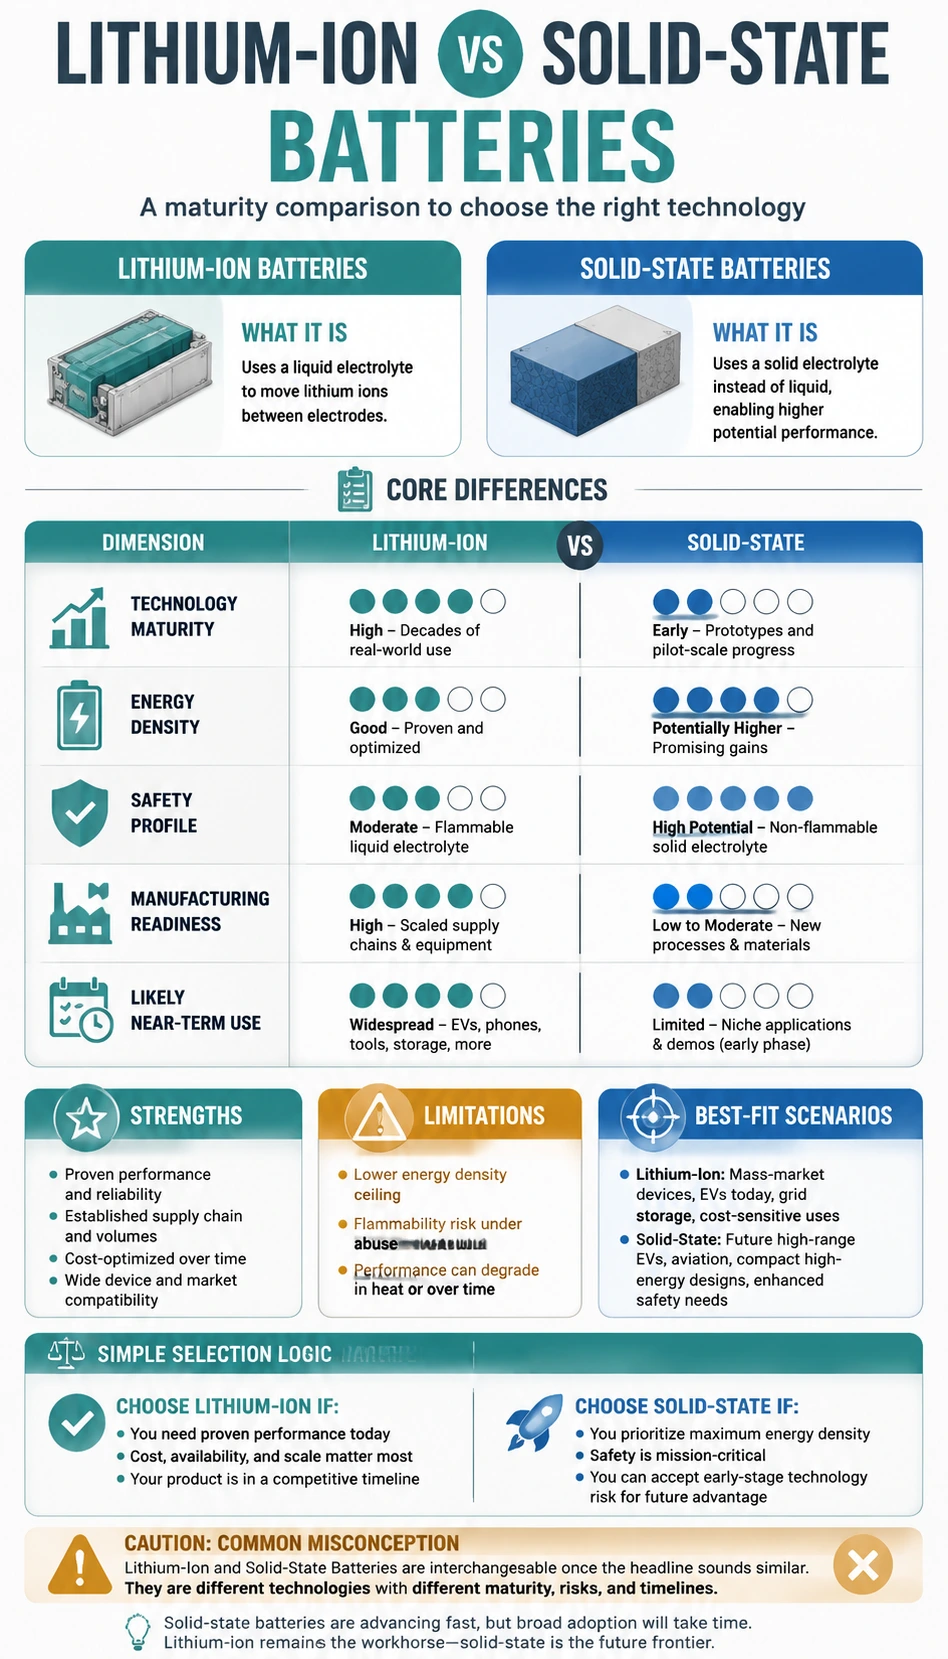
Lithium-Ion vs Solid-State Batteries
A mobile-friendly lithium-ion vs solid-state batteries comparison infographic template with clear trade-offs, use cases, and decision logic.
Open detail page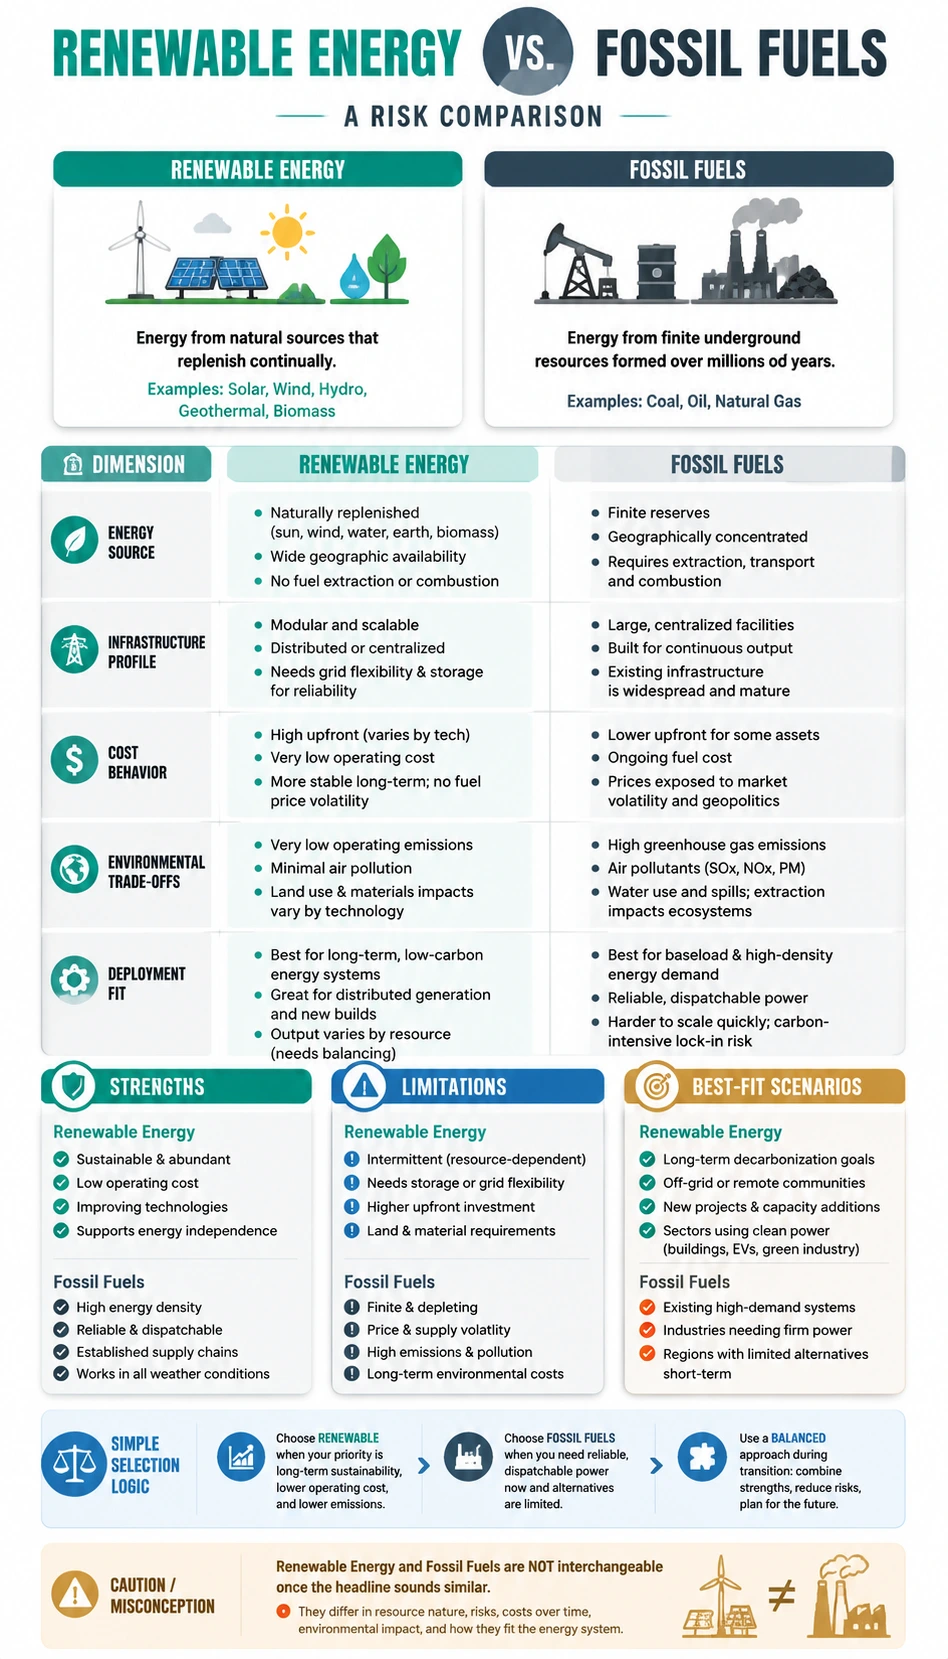
Renewable Energy vs Fossil Fuels
A mobile-friendly renewable energy vs fossil fuels comparison infographic template with clear trade-offs, use cases, and decision logic.
Open detail page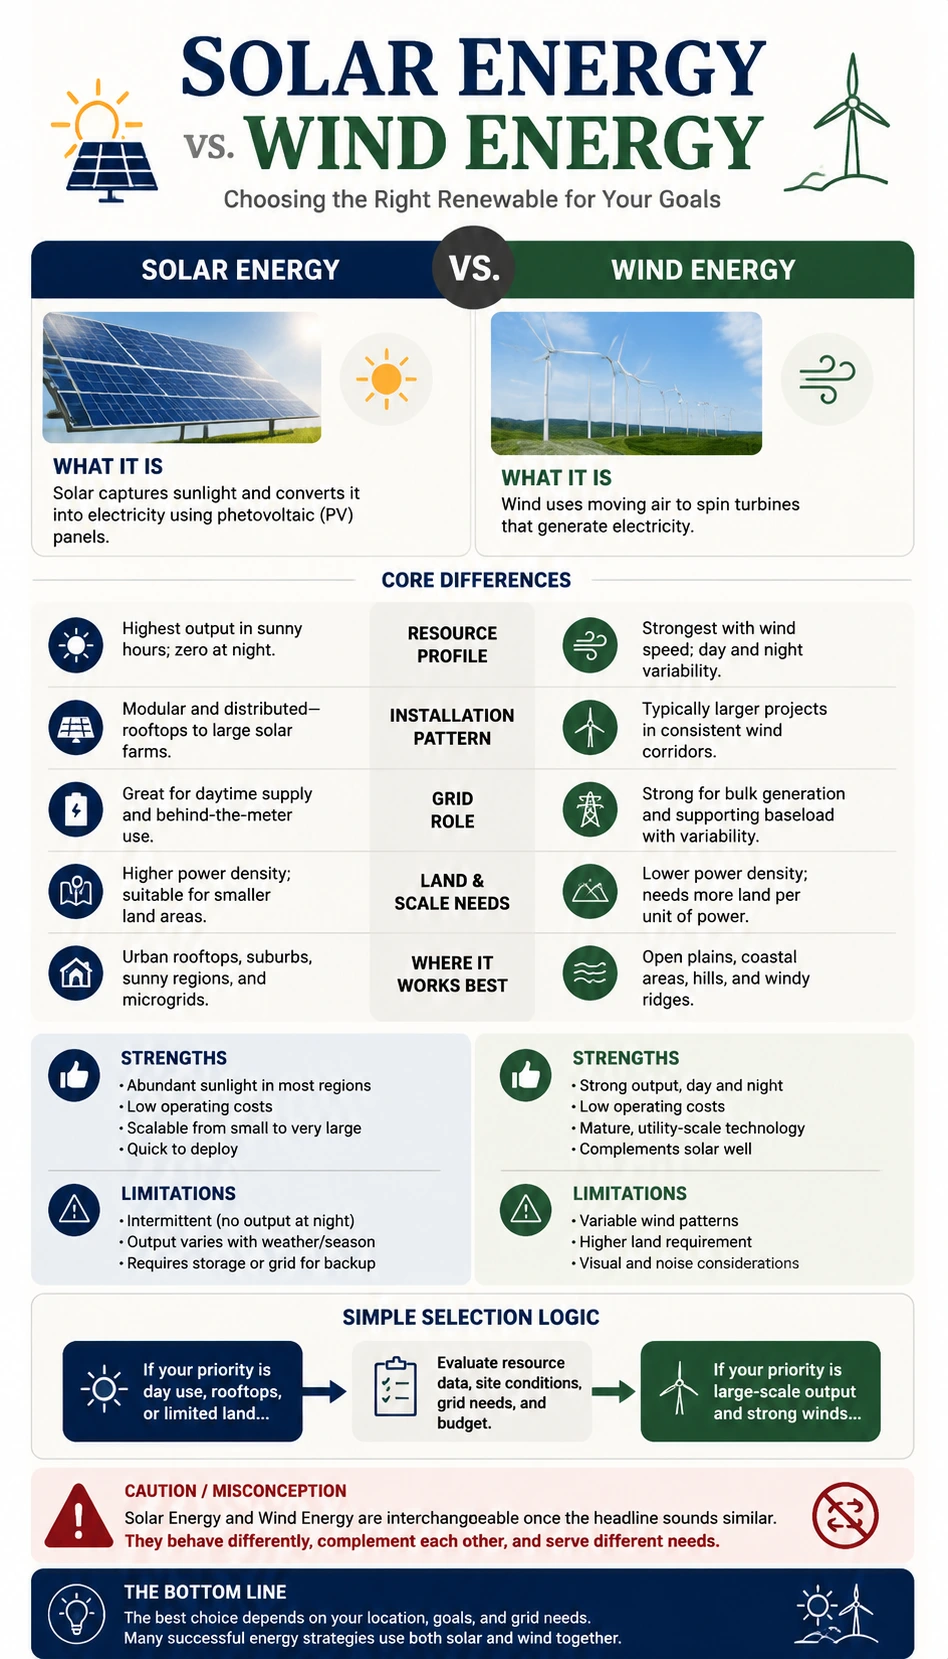
Solar Energy vs Wind Energy
A mobile-friendly solar energy vs wind energy comparison infographic template with clear trade-offs, use cases, and decision logic.
Open detail page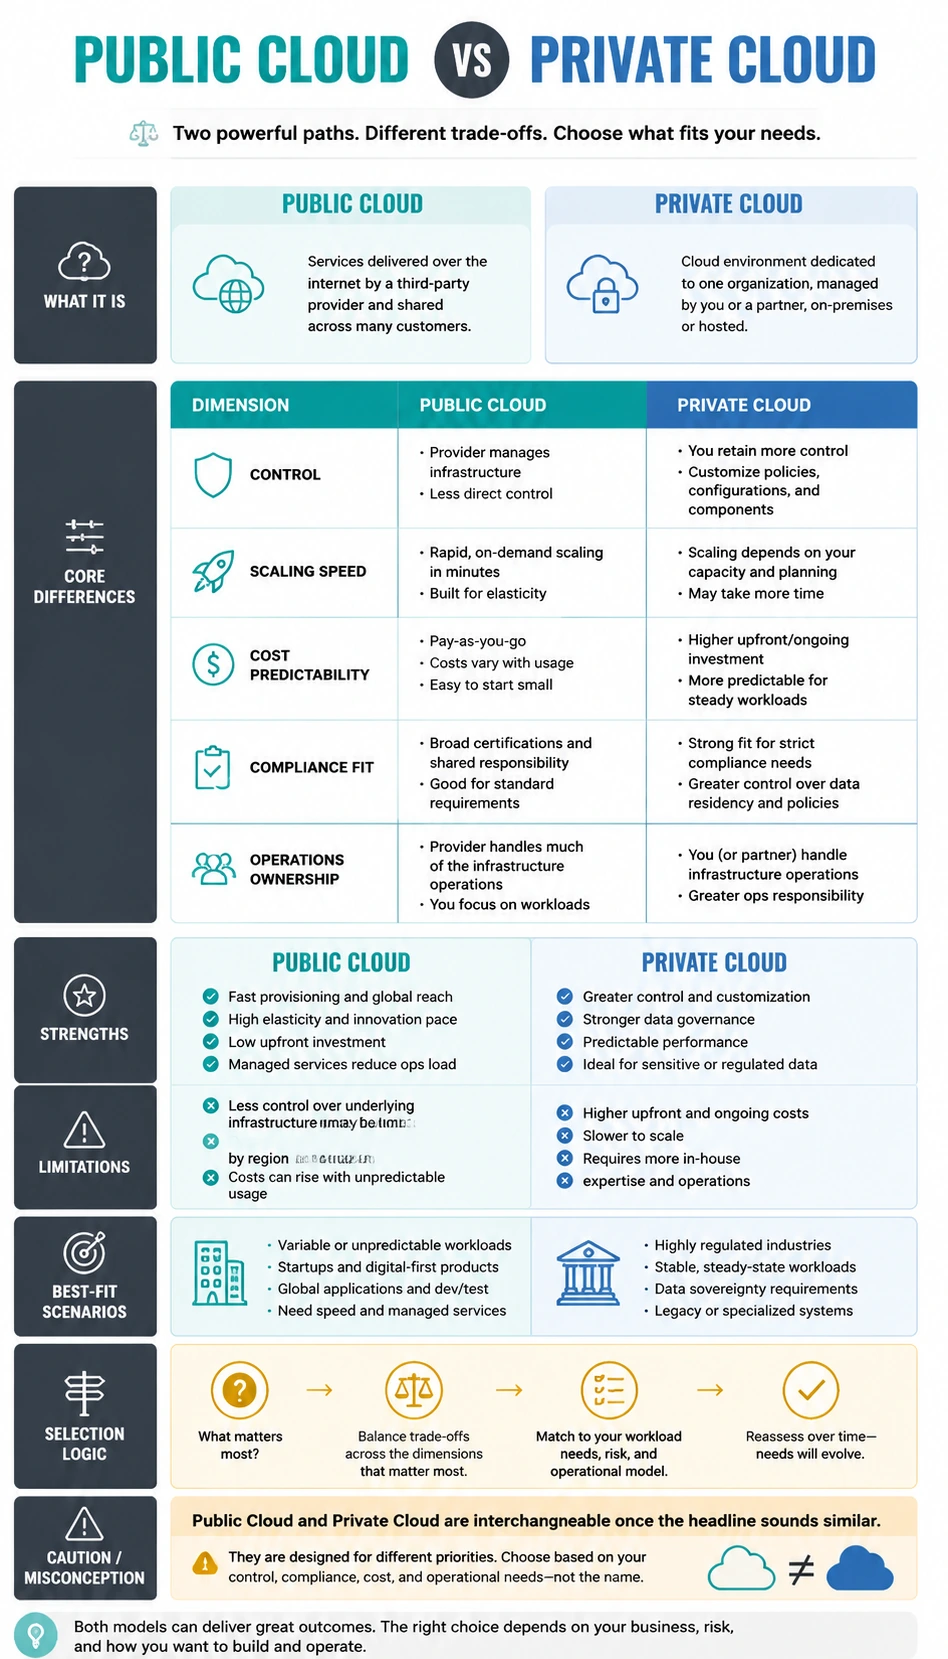
Public Cloud vs Private Cloud
A mobile-friendly public cloud vs private cloud comparison infographic template with clear trade-offs, use cases, and decision logic.
Open detail page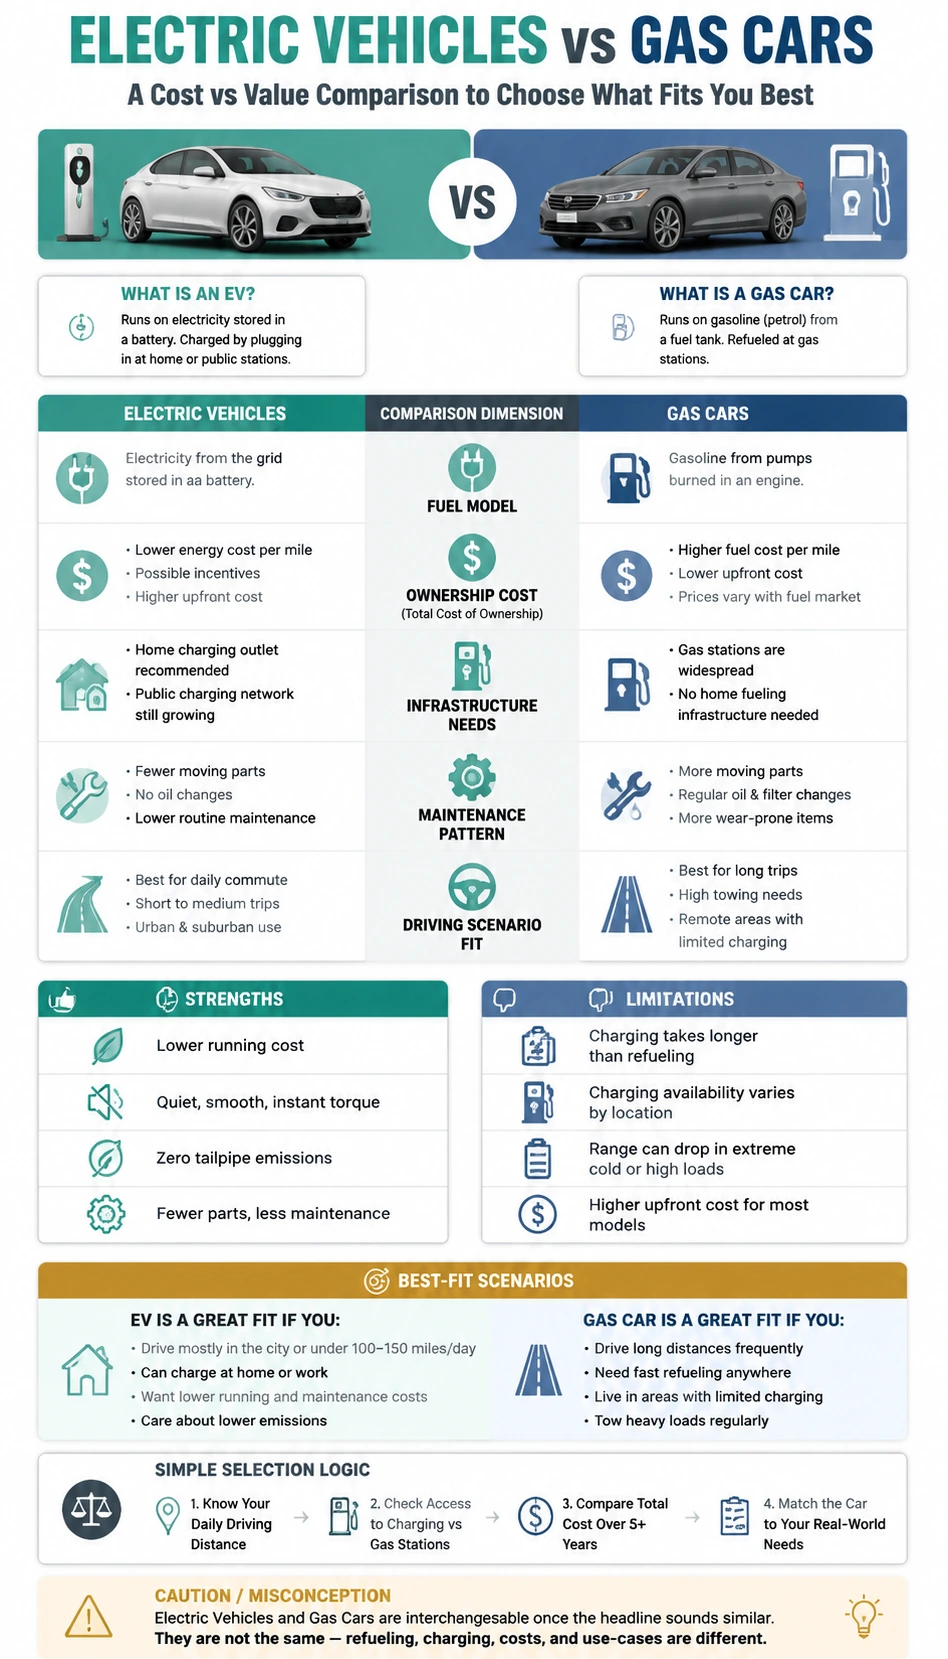
Electric Vehicles vs Gas Cars
A mobile-friendly electric vehicles vs gas cars comparison infographic template with clear trade-offs, use cases, and decision logic.
Open detail page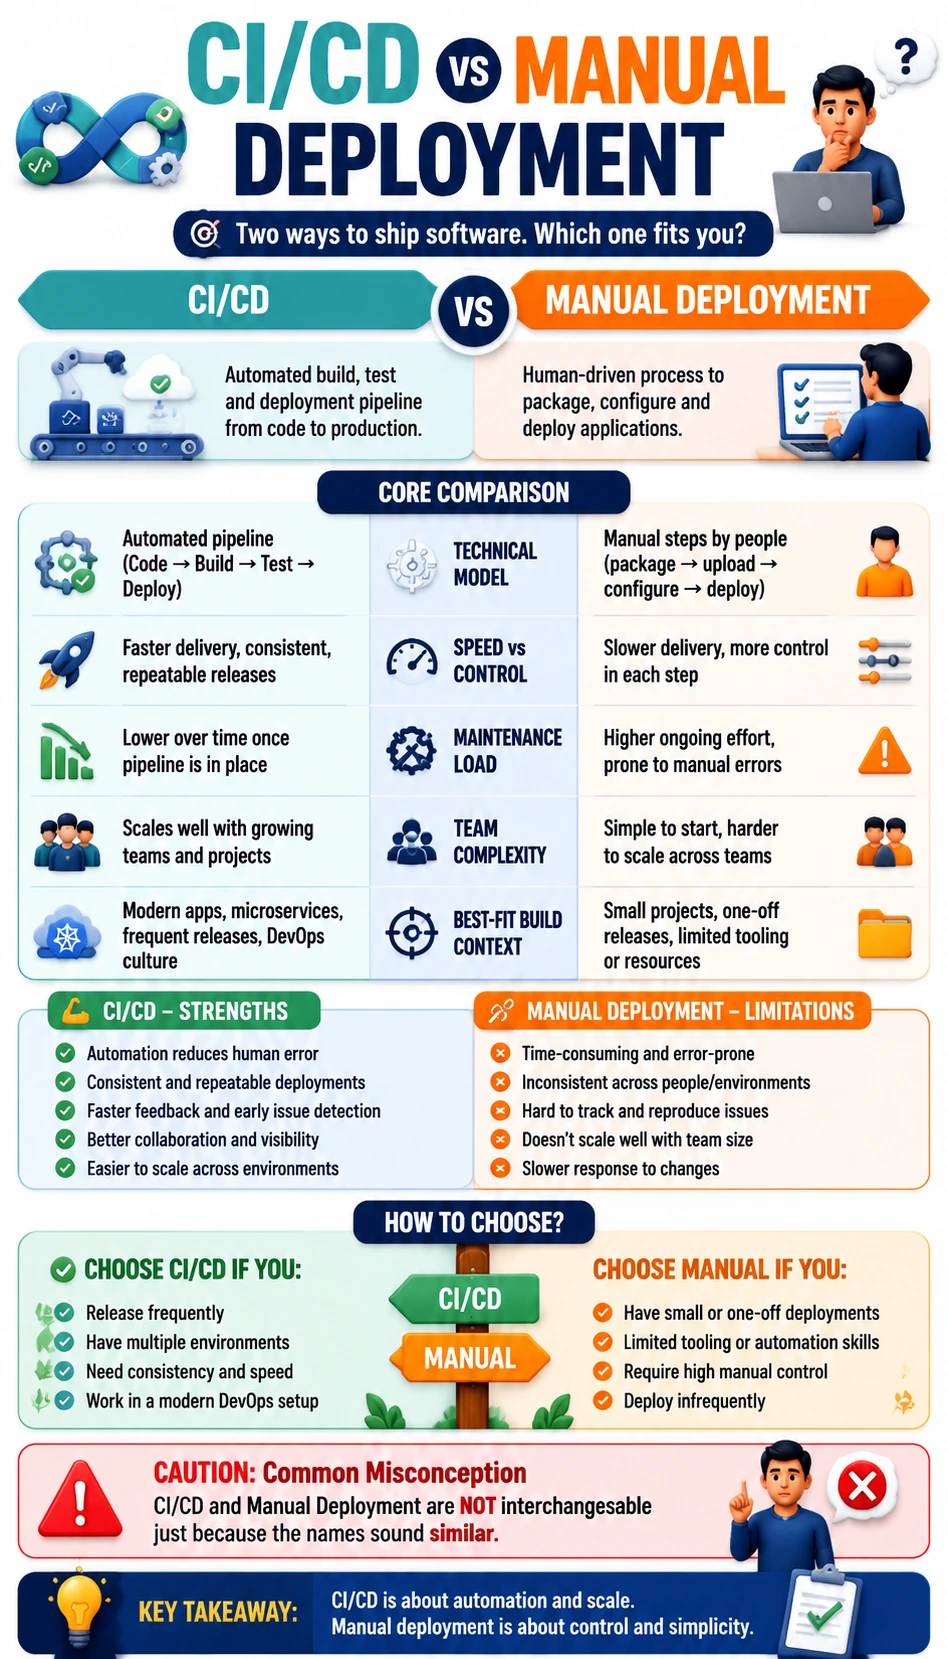
CI/CD vs Manual Deployment
A mobile-friendly ci/cd vs manual deployment comparison infographic template with clear trade-offs, use cases, and decision logic.
Open detail page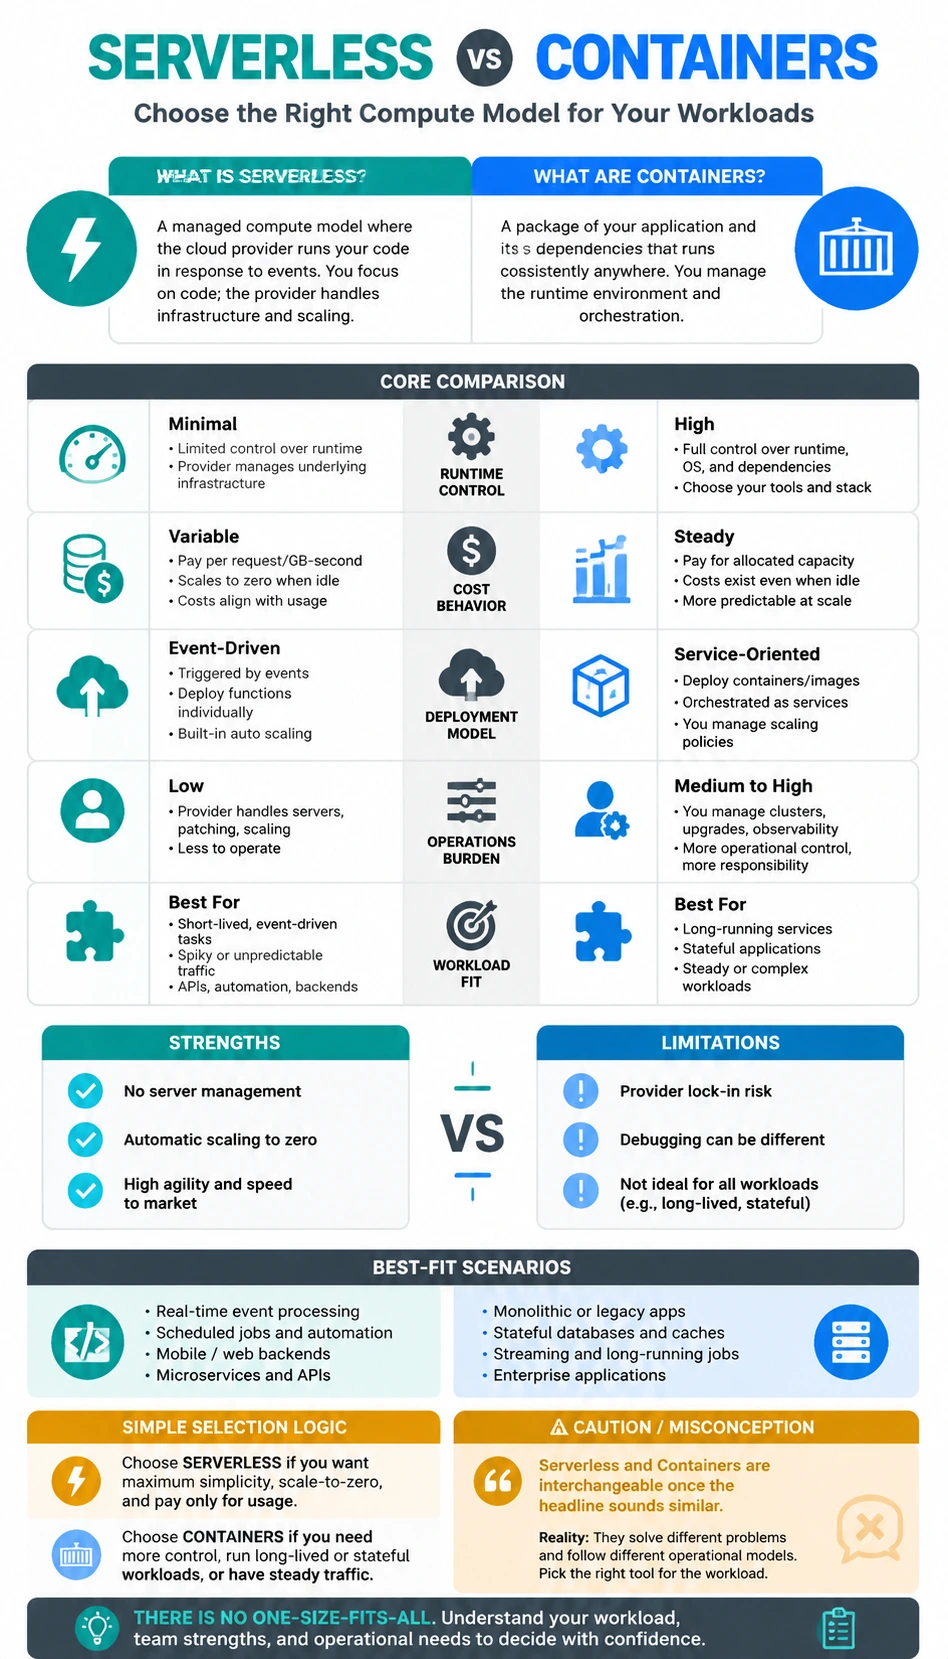
Serverless vs Containers
A mobile-friendly serverless vs containers comparison infographic template with clear trade-offs, use cases, and decision logic.
Open detail page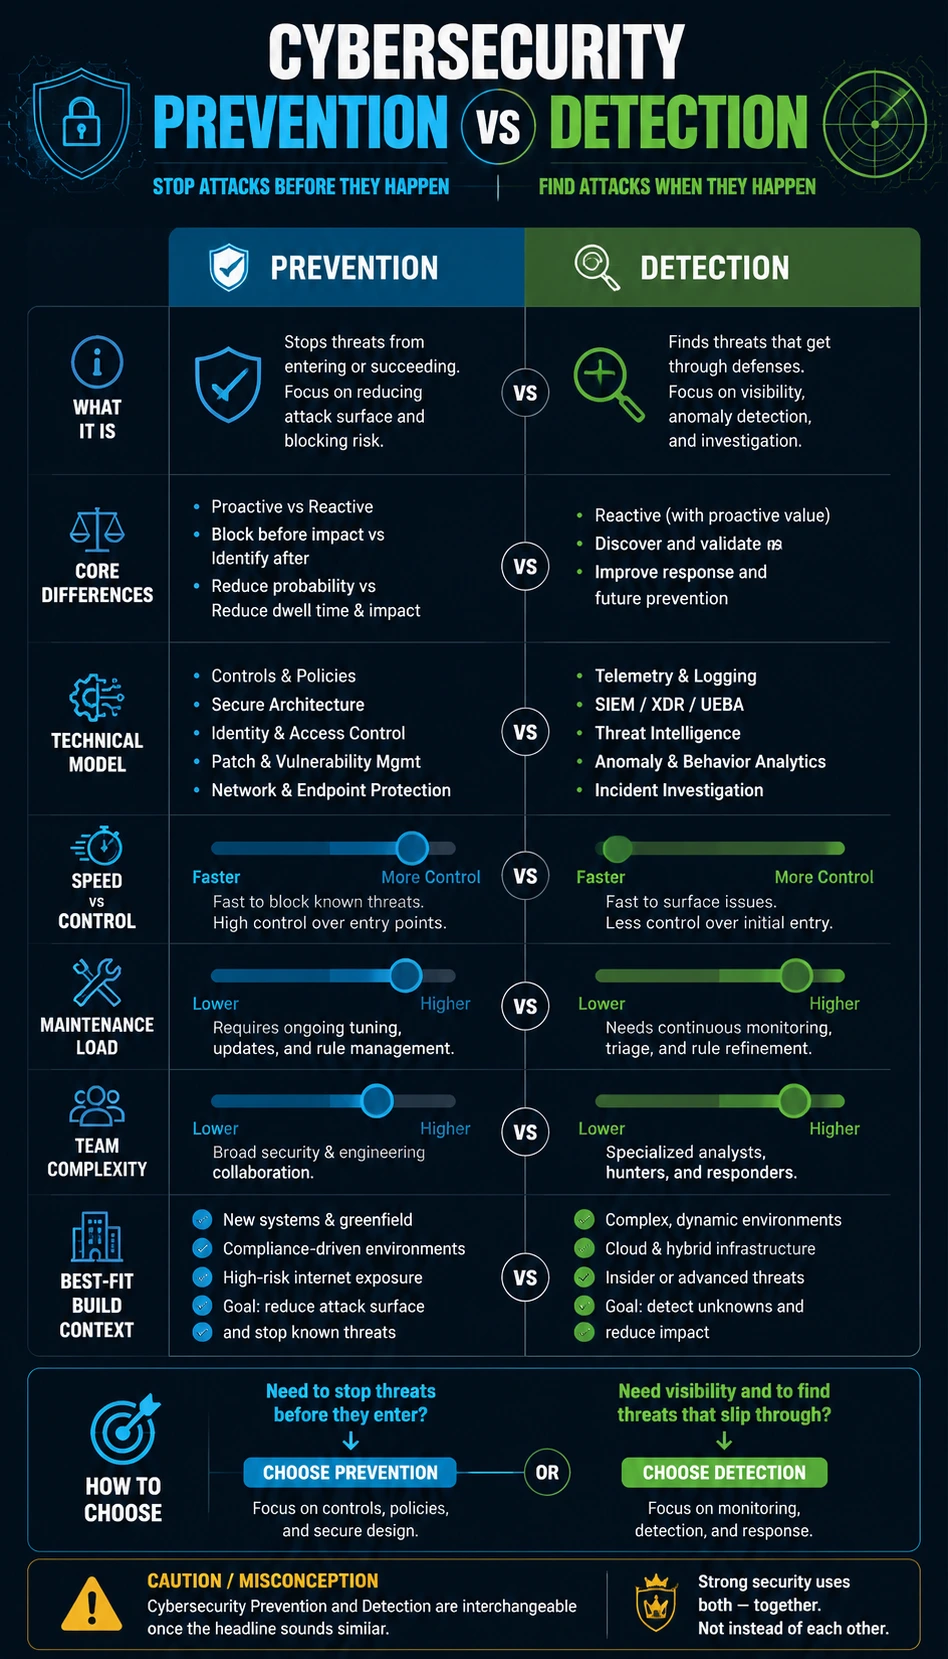
Cybersecurity Prevention vs Detection
A mobile-friendly cybersecurity prevention vs detection comparison infographic template with clear trade-offs, use cases, and decision logic.
Open detail page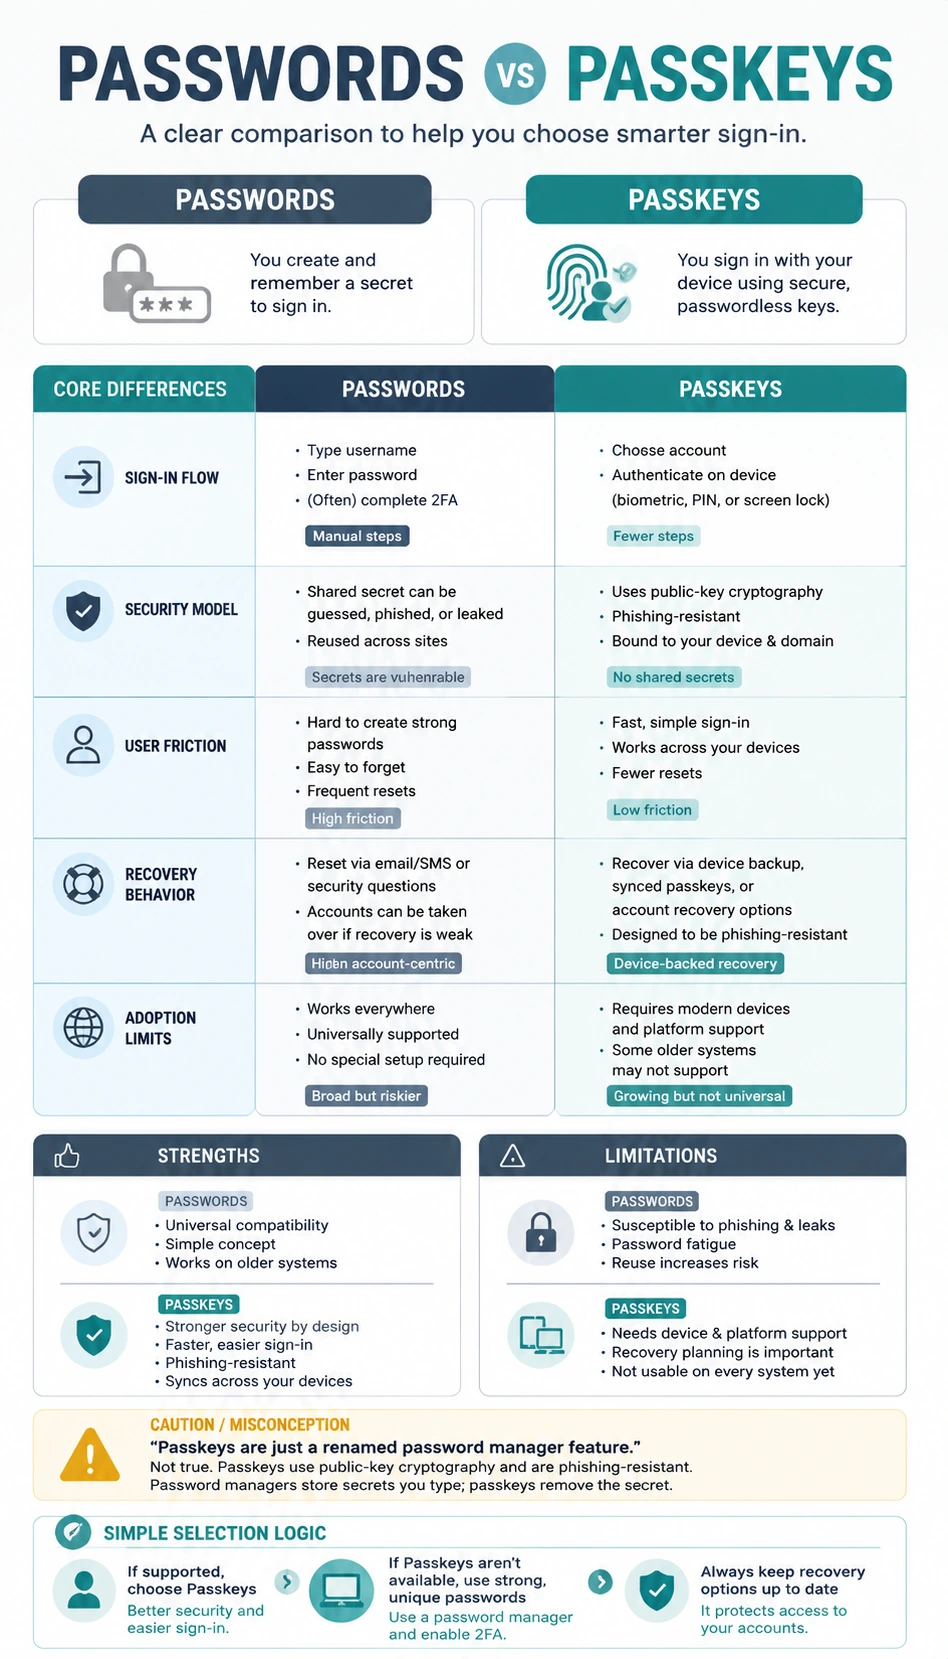
Passwords vs Passkeys
A mobile-friendly passwords vs passkeys comparison infographic template with clear trade-offs, use cases, and decision logic.
Open detail page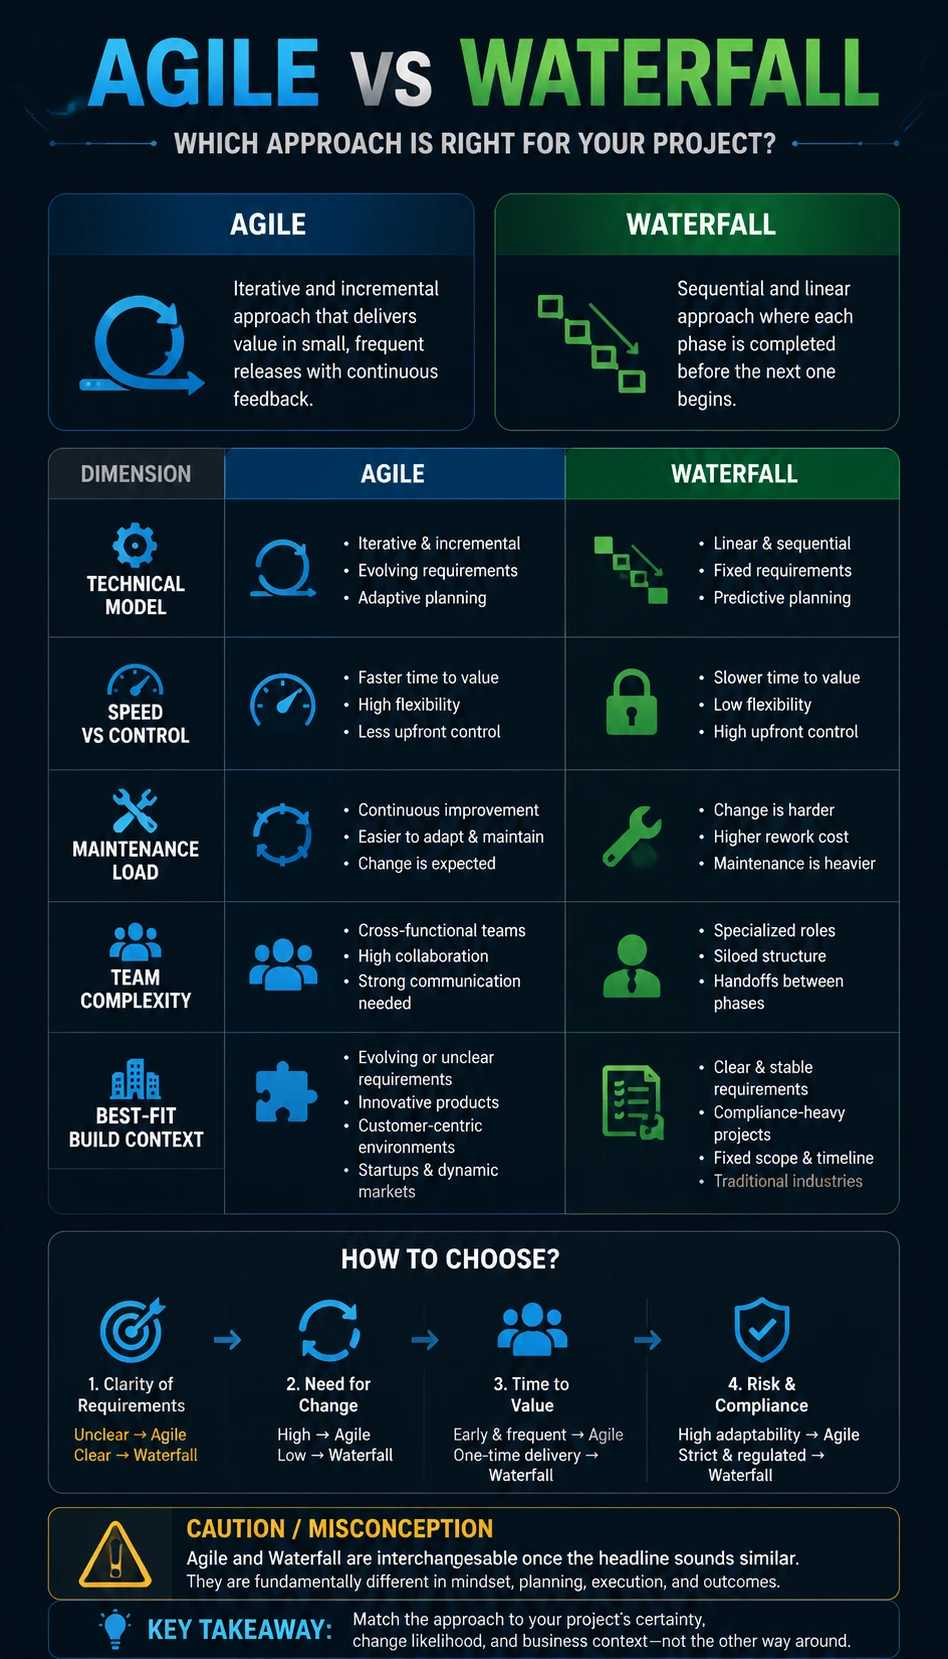
Agile vs Waterfall
A mobile-friendly agile vs waterfall comparison infographic template with clear trade-offs, use cases, and decision logic.
Open detail page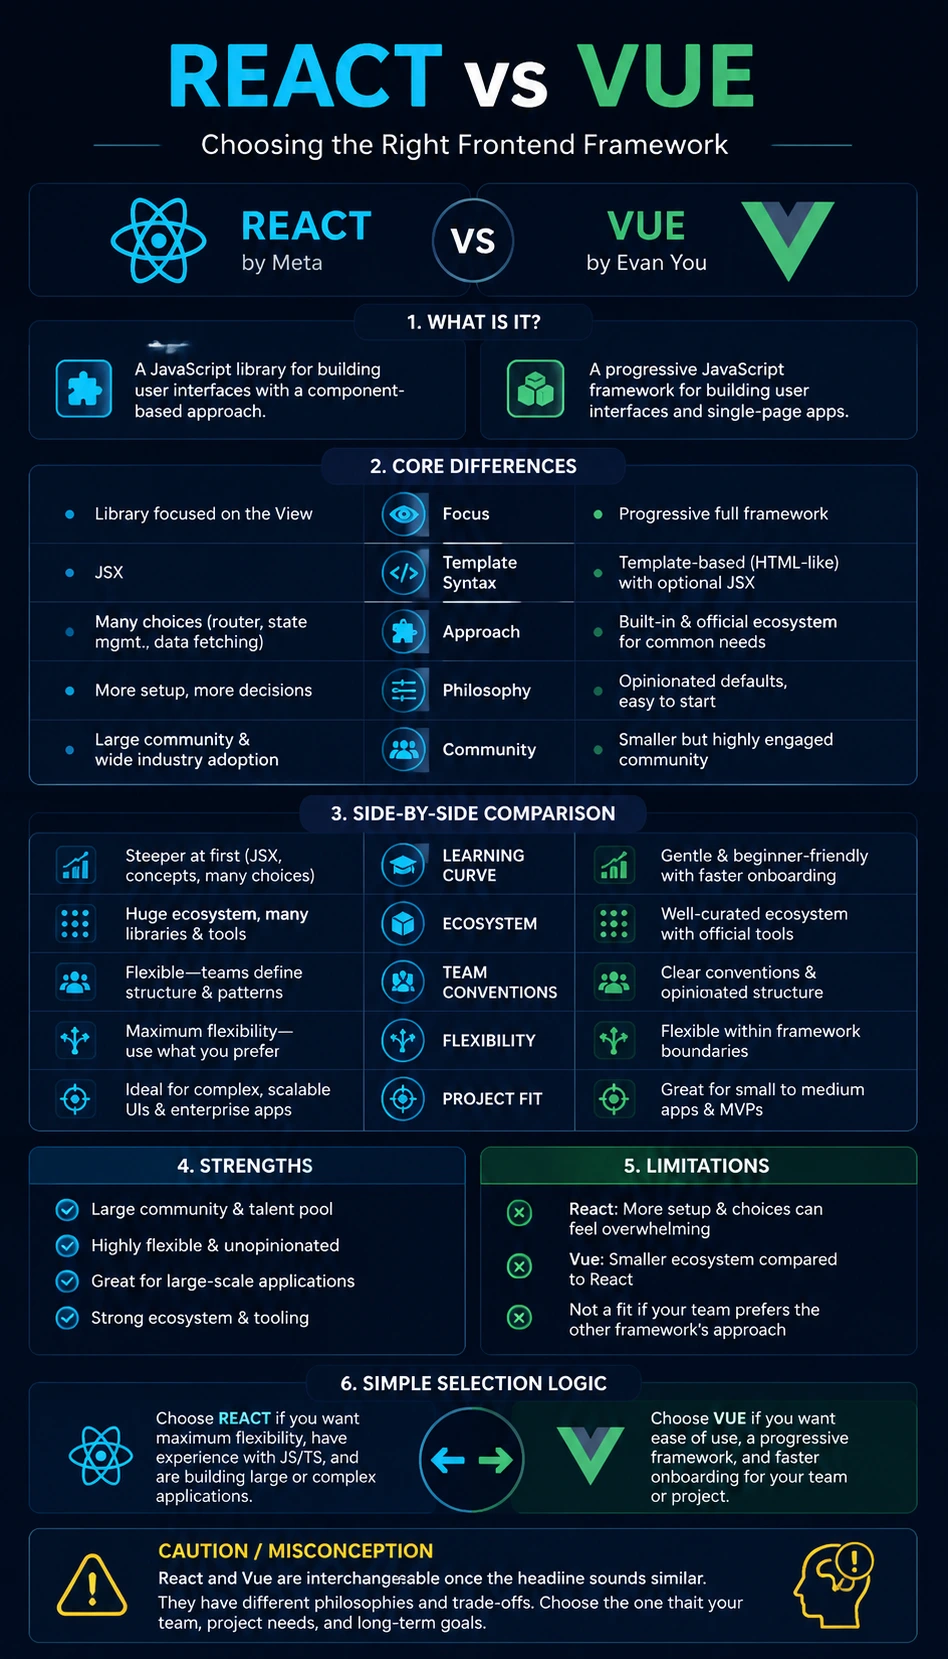
React vs Vue
A mobile-friendly react vs vue comparison infographic template with clear trade-offs, use cases, and decision logic.
Open detail page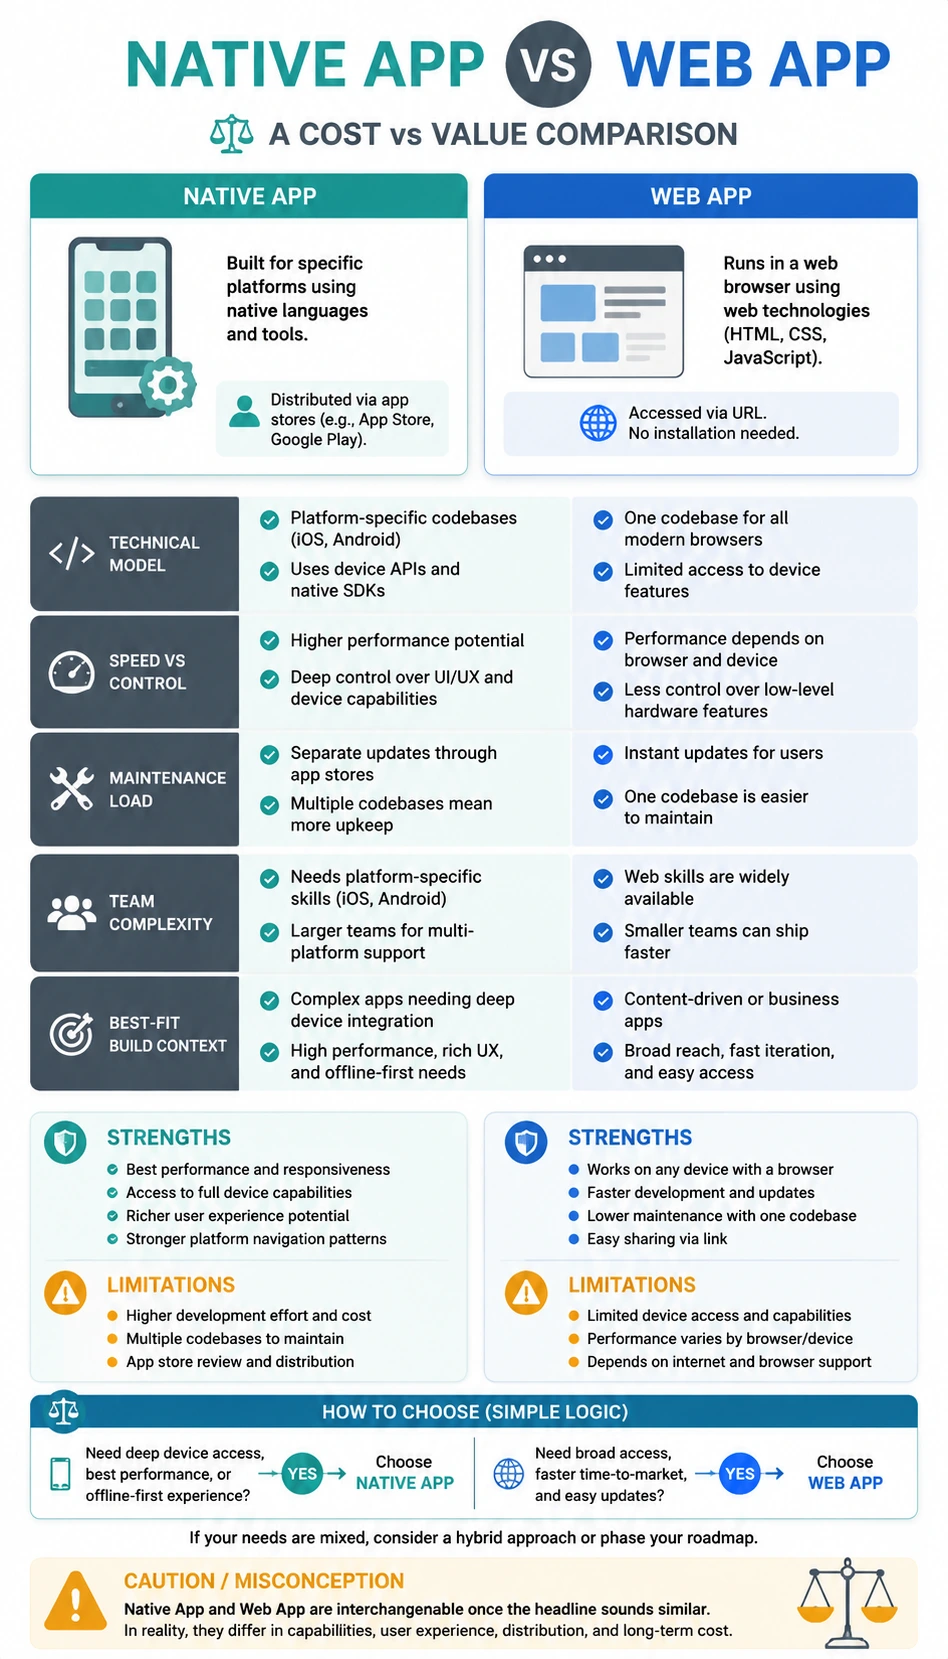
Native App vs Web App
A mobile-friendly native app vs web app comparison infographic template with clear trade-offs, use cases, and decision logic.
Open detail page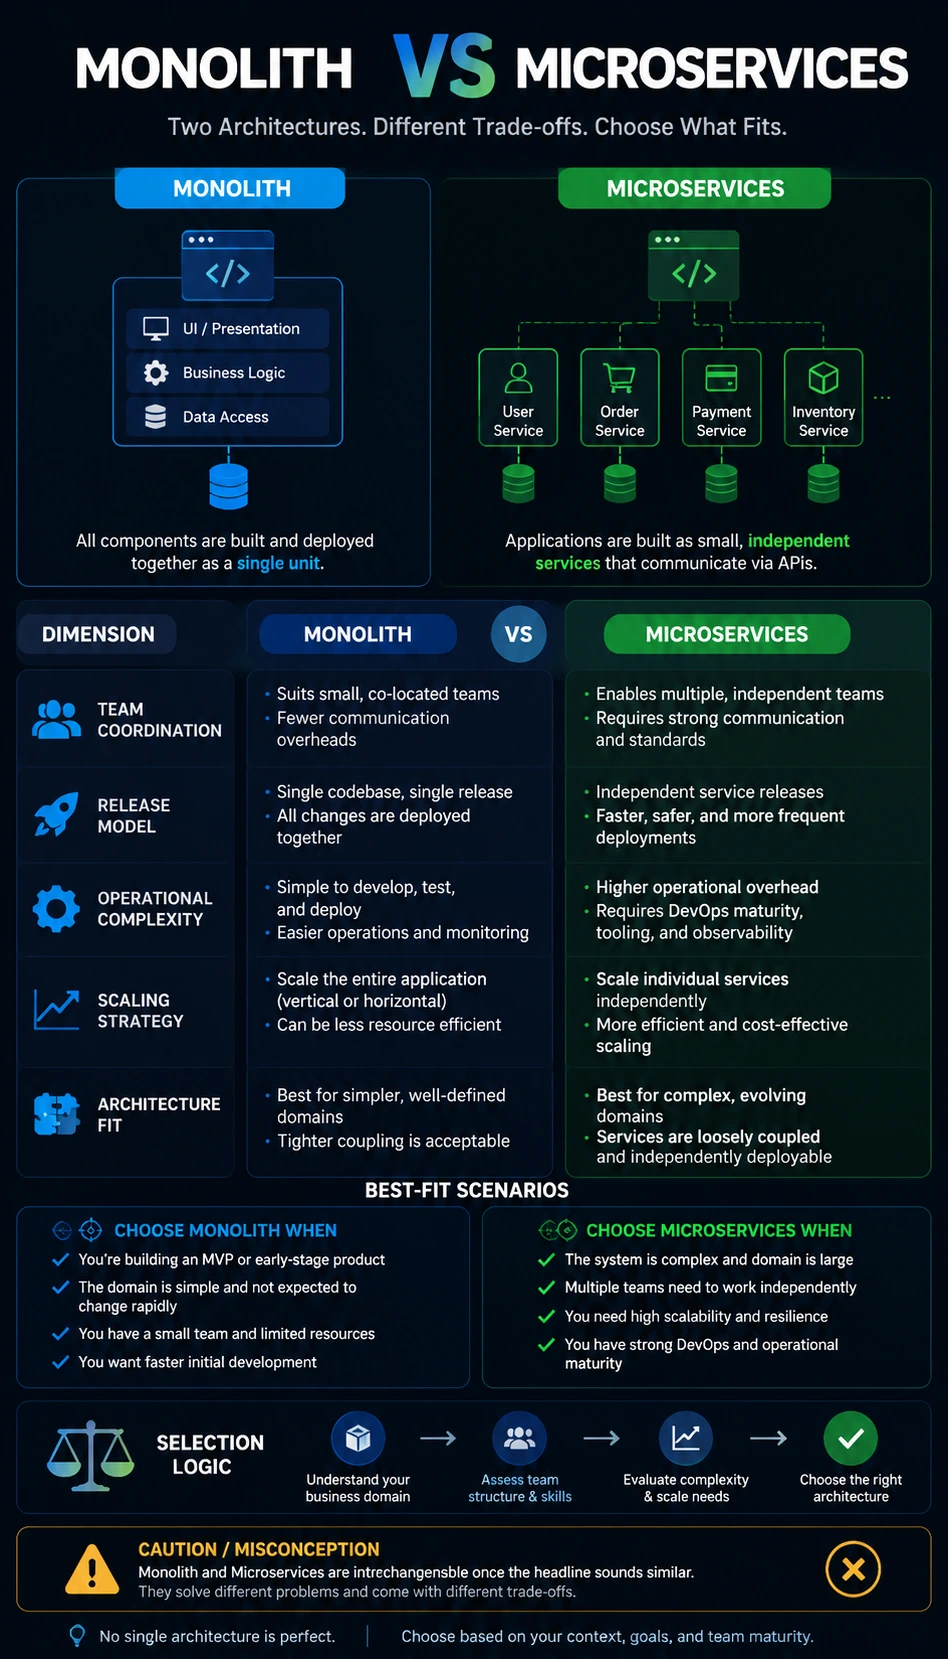
Monolith vs Microservices
A mobile-friendly monolith vs microservices comparison infographic template with clear trade-offs, use cases, and decision logic.
Open detail page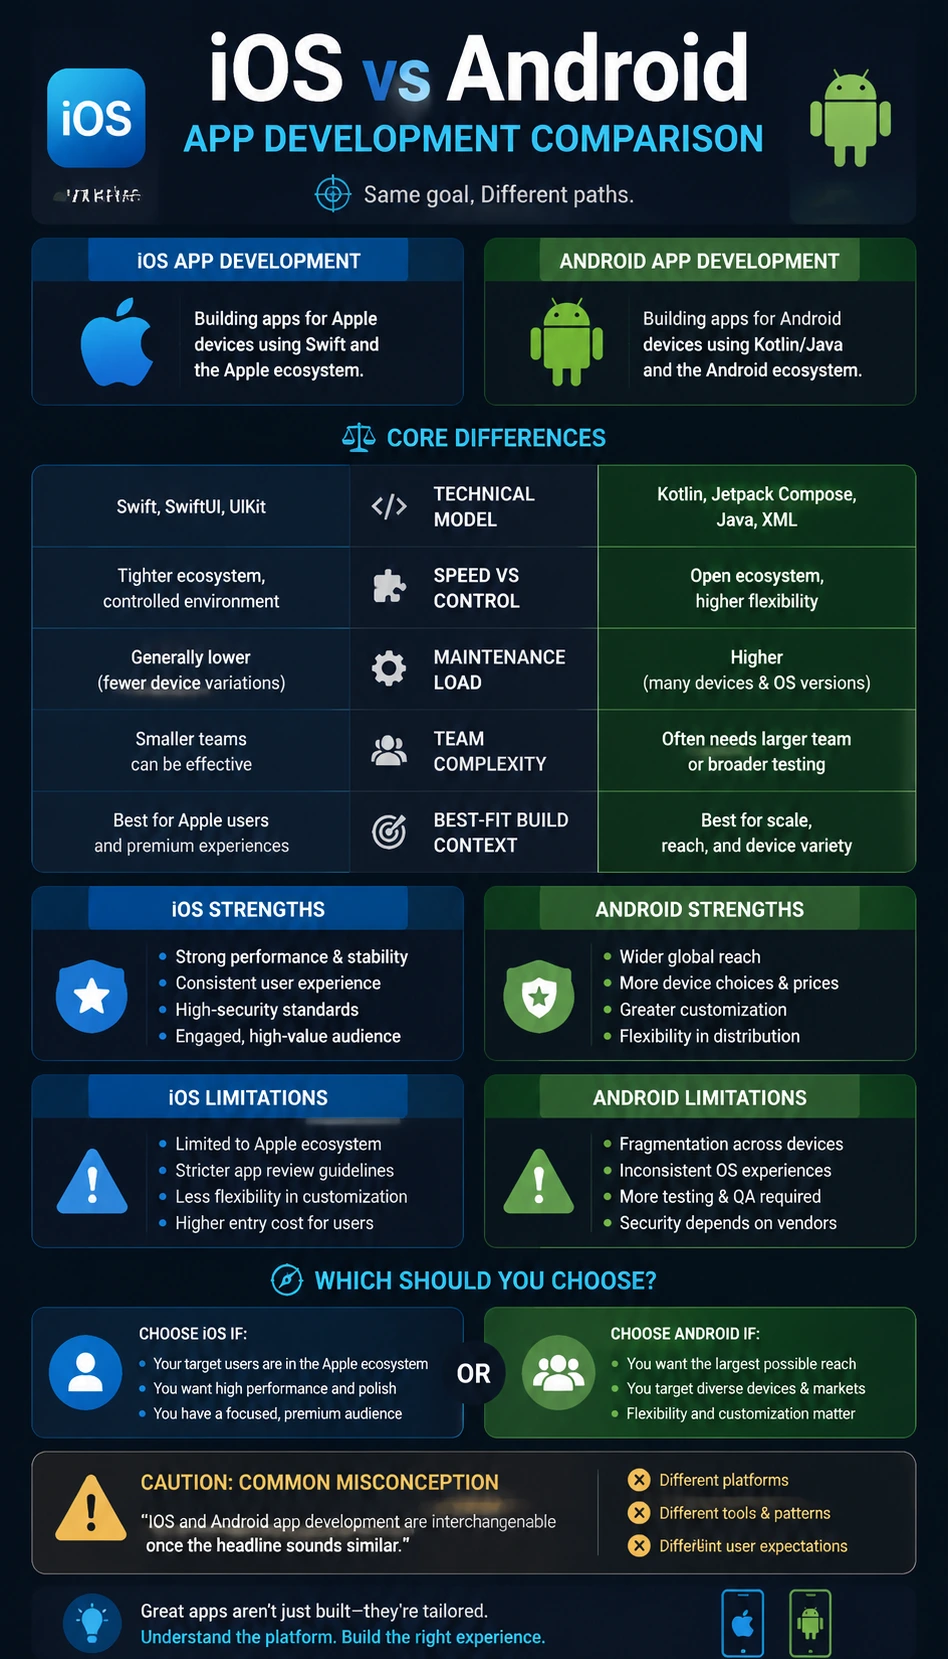
iOS vs Android App Development
A mobile-friendly ios vs android app development comparison infographic template with clear trade-offs, use cases, and decision logic.
Open detail page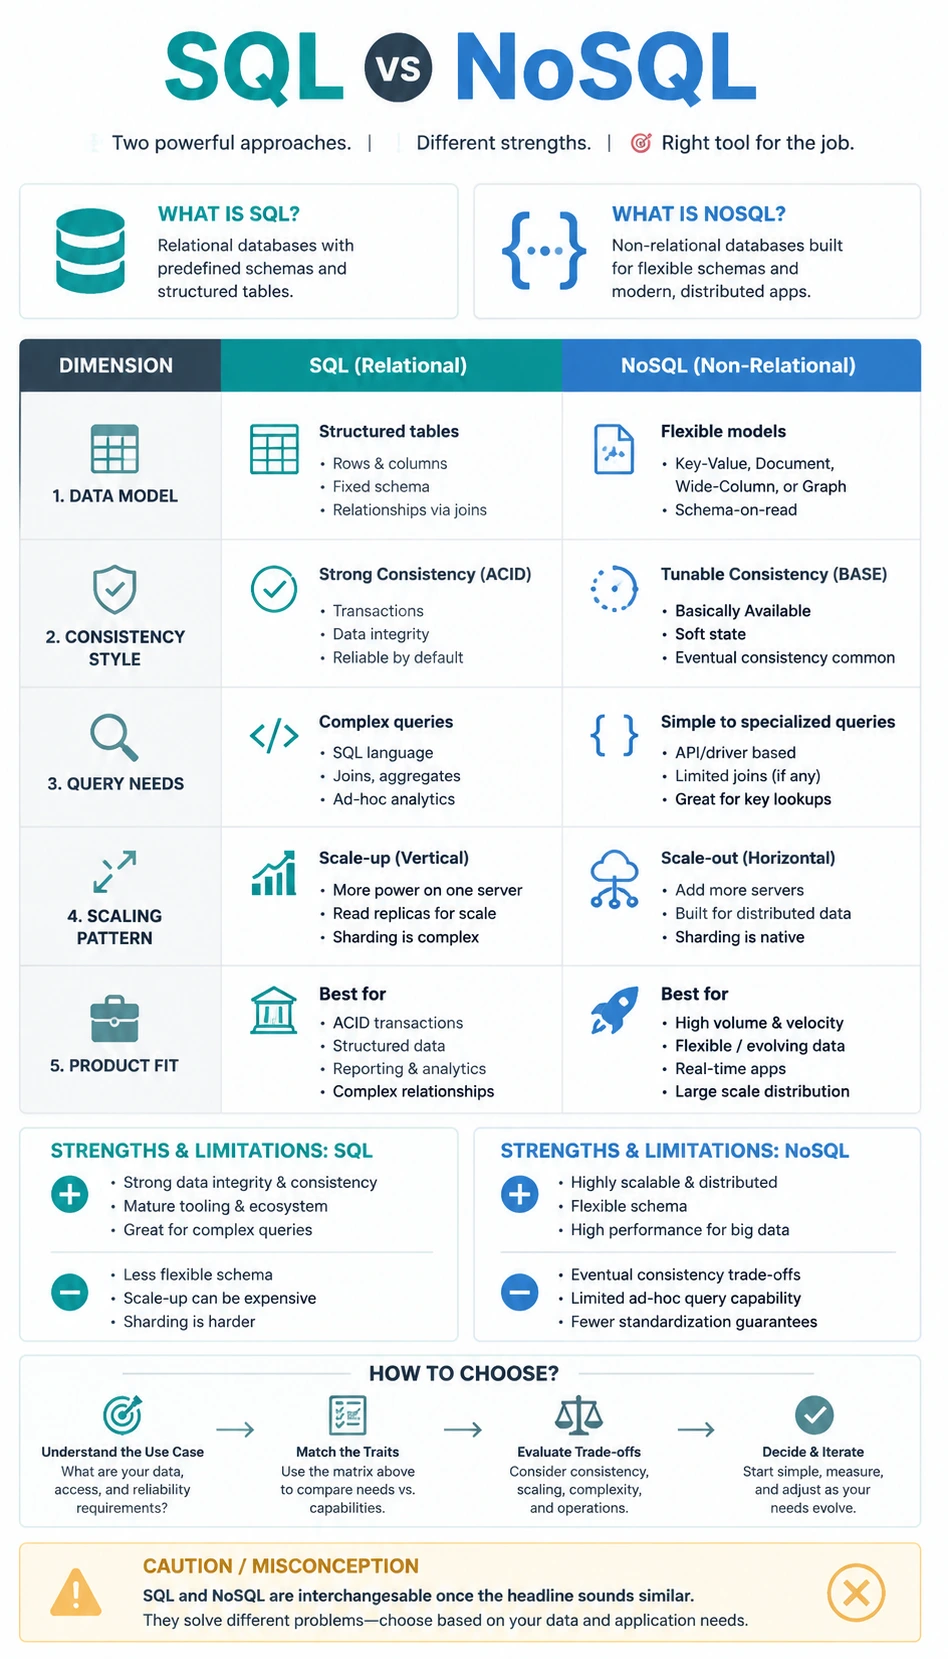
SQL vs NoSQL
A mobile-friendly sql vs nosql comparison infographic template with clear trade-offs, use cases, and decision logic.
Open detail page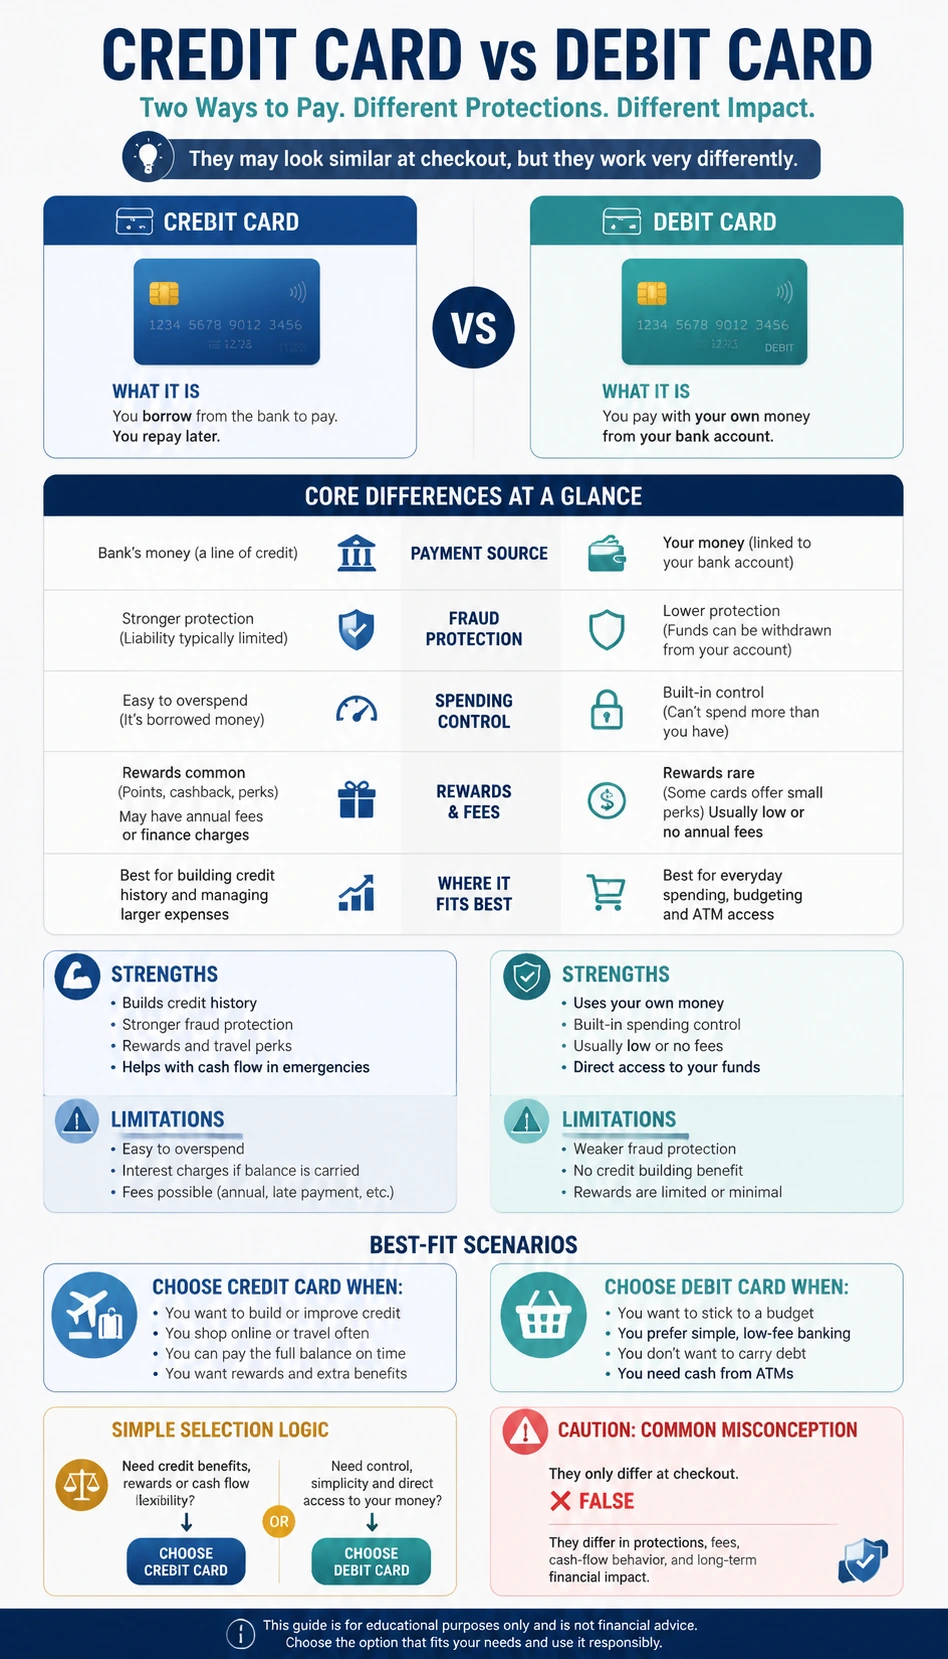
Credit Card vs Debit Card
A mobile-friendly credit card vs debit card comparison infographic template with clear trade-offs, use cases, and decision logic.
Open detail page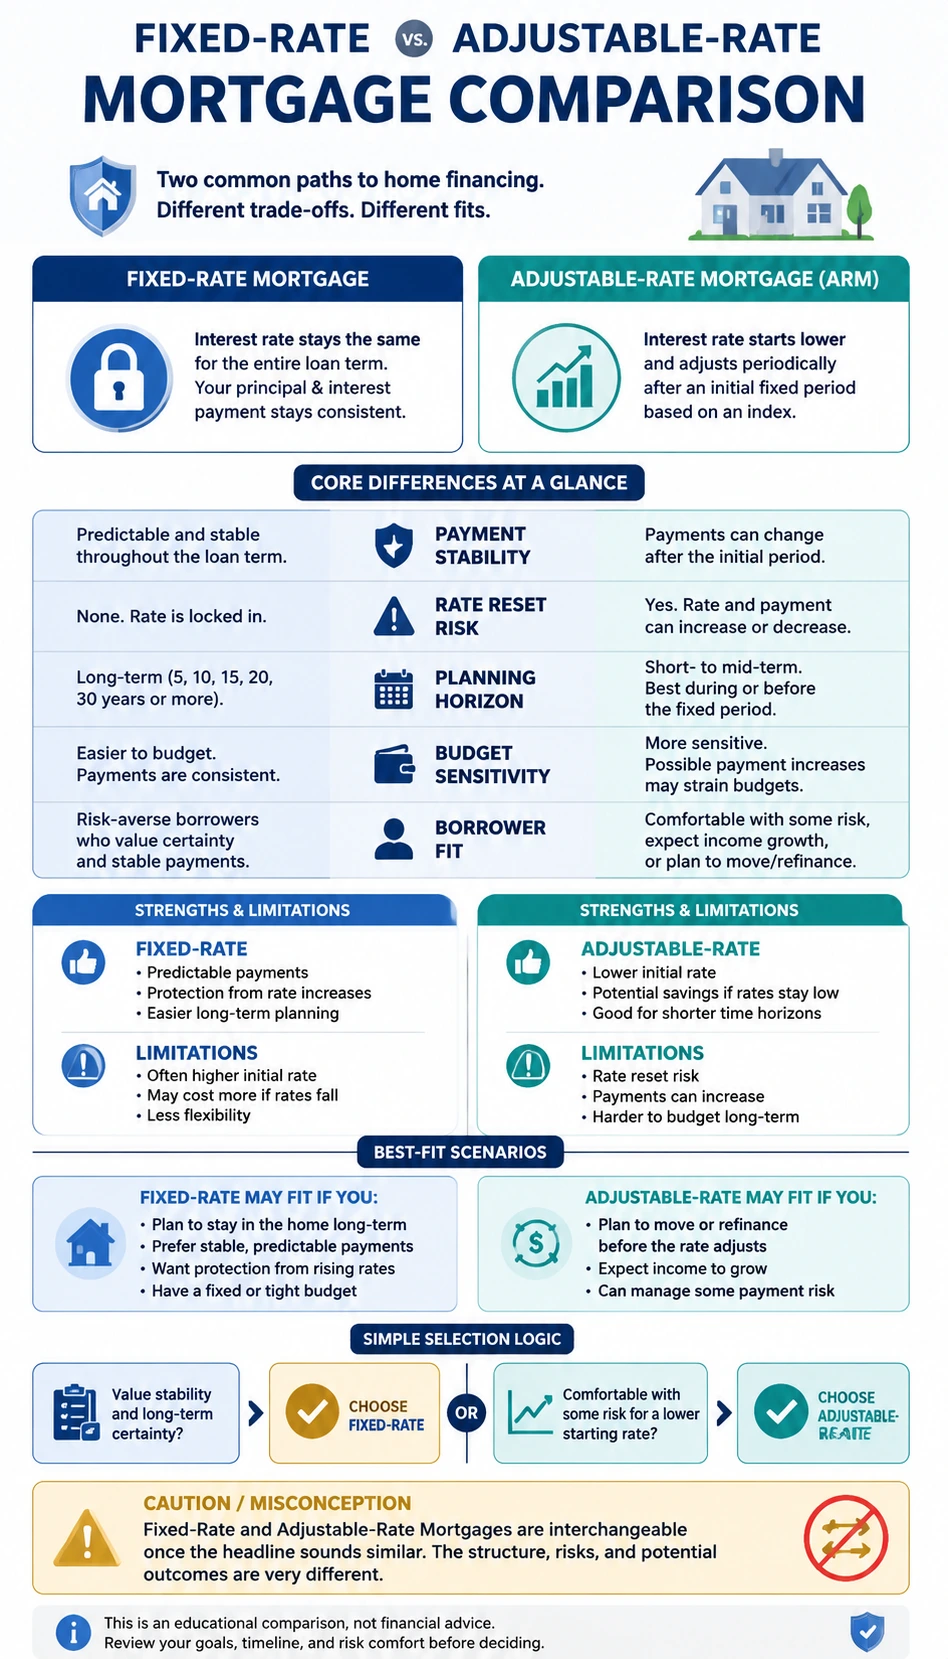
Fixed-Rate vs Adjustable-Rate Mortgage
A mobile-friendly fixed-rate vs adjustable-rate mortgage comparison infographic template with clear trade-offs, use cases, and decision logic.
Open detail page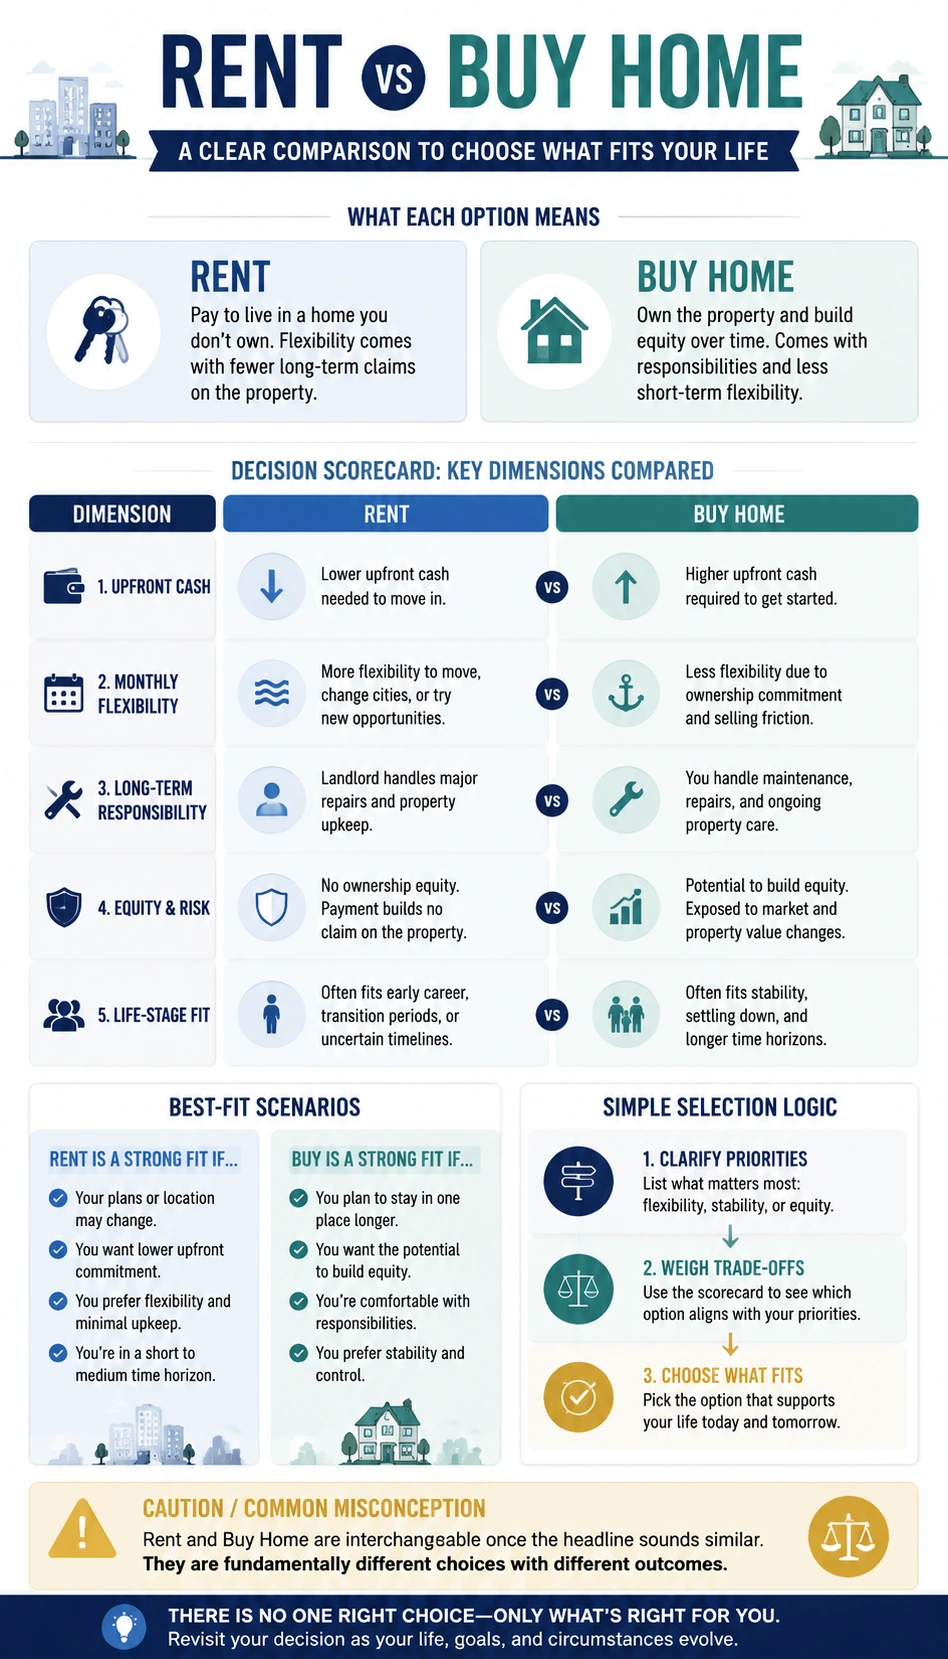
Rent vs Buy Home
A mobile-friendly rent vs buy home comparison infographic template with clear trade-offs, use cases, and decision logic.
Open detail page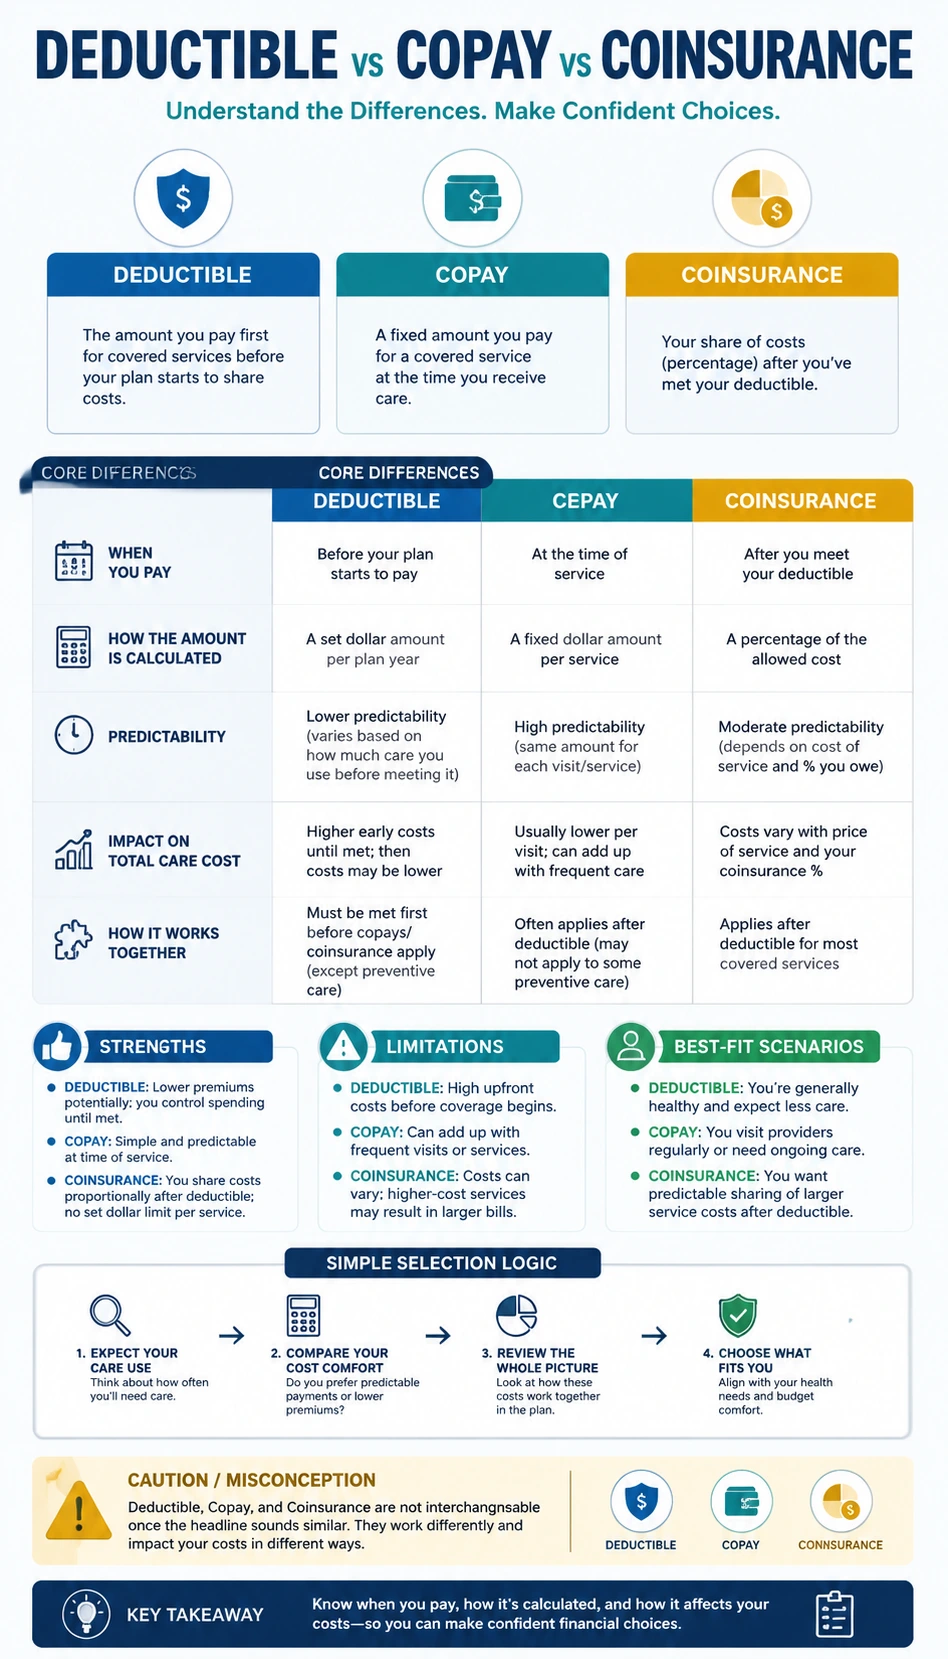
Deductible vs Copay vs Coinsurance
A mobile-friendly deductible vs copay vs coinsurance comparison infographic template with clear trade-offs, use cases, and decision logic.
Open detail page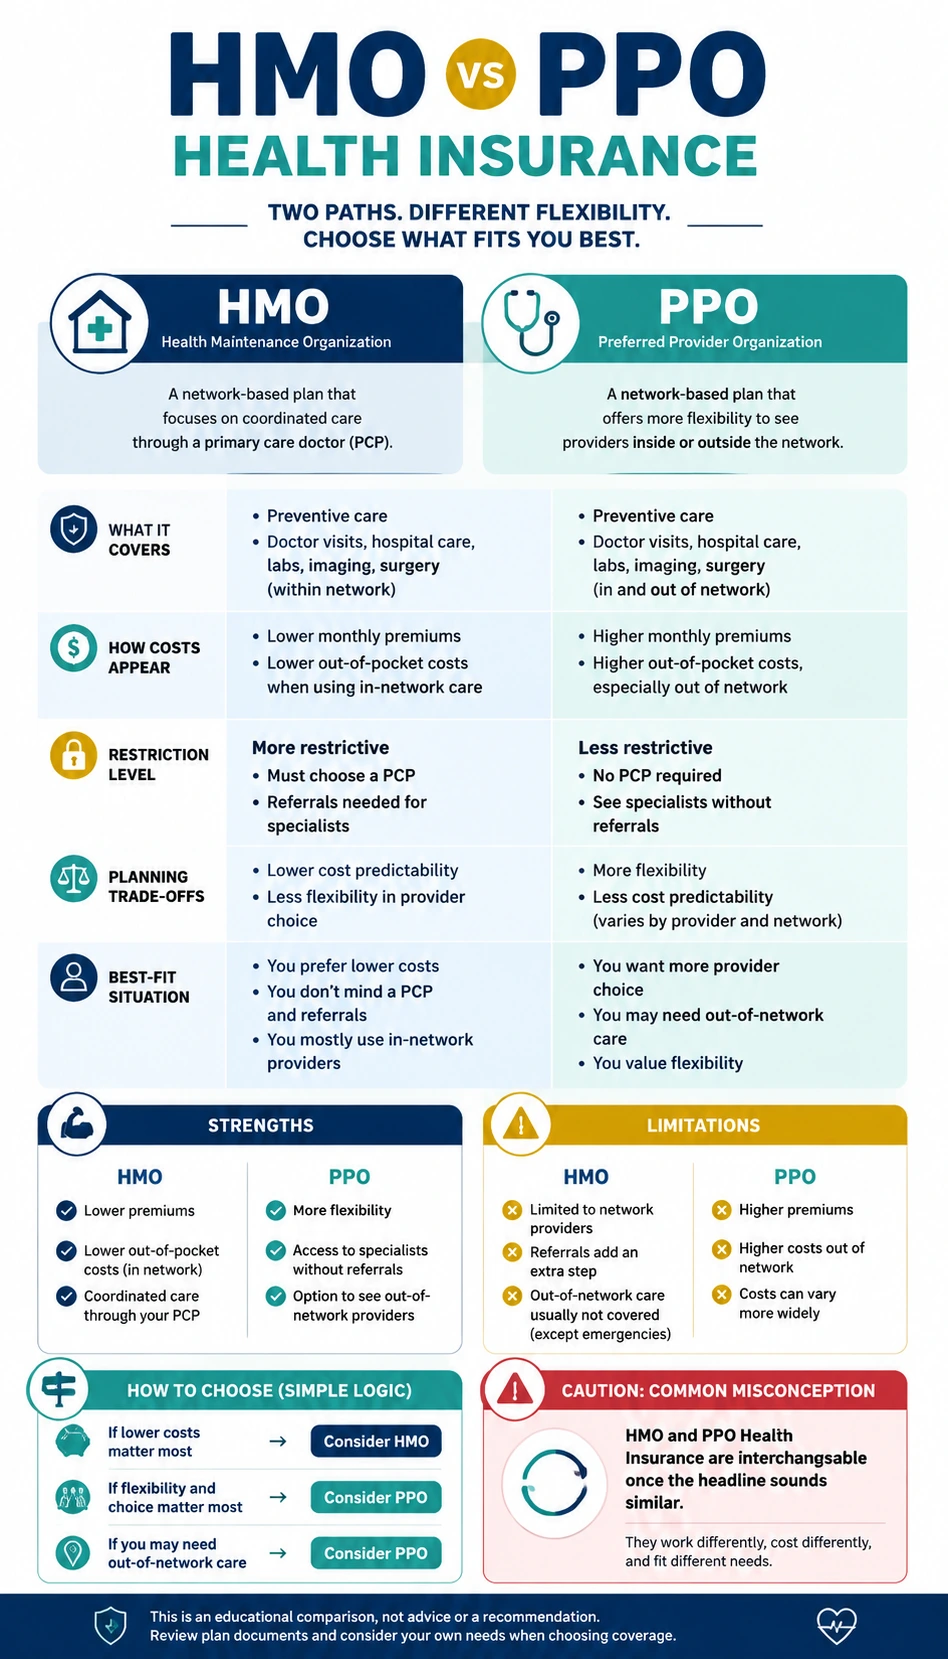
HMO vs PPO Health Insurance
A mobile-friendly hmo vs ppo health insurance comparison infographic template with clear trade-offs, use cases, and decision logic.
Open detail page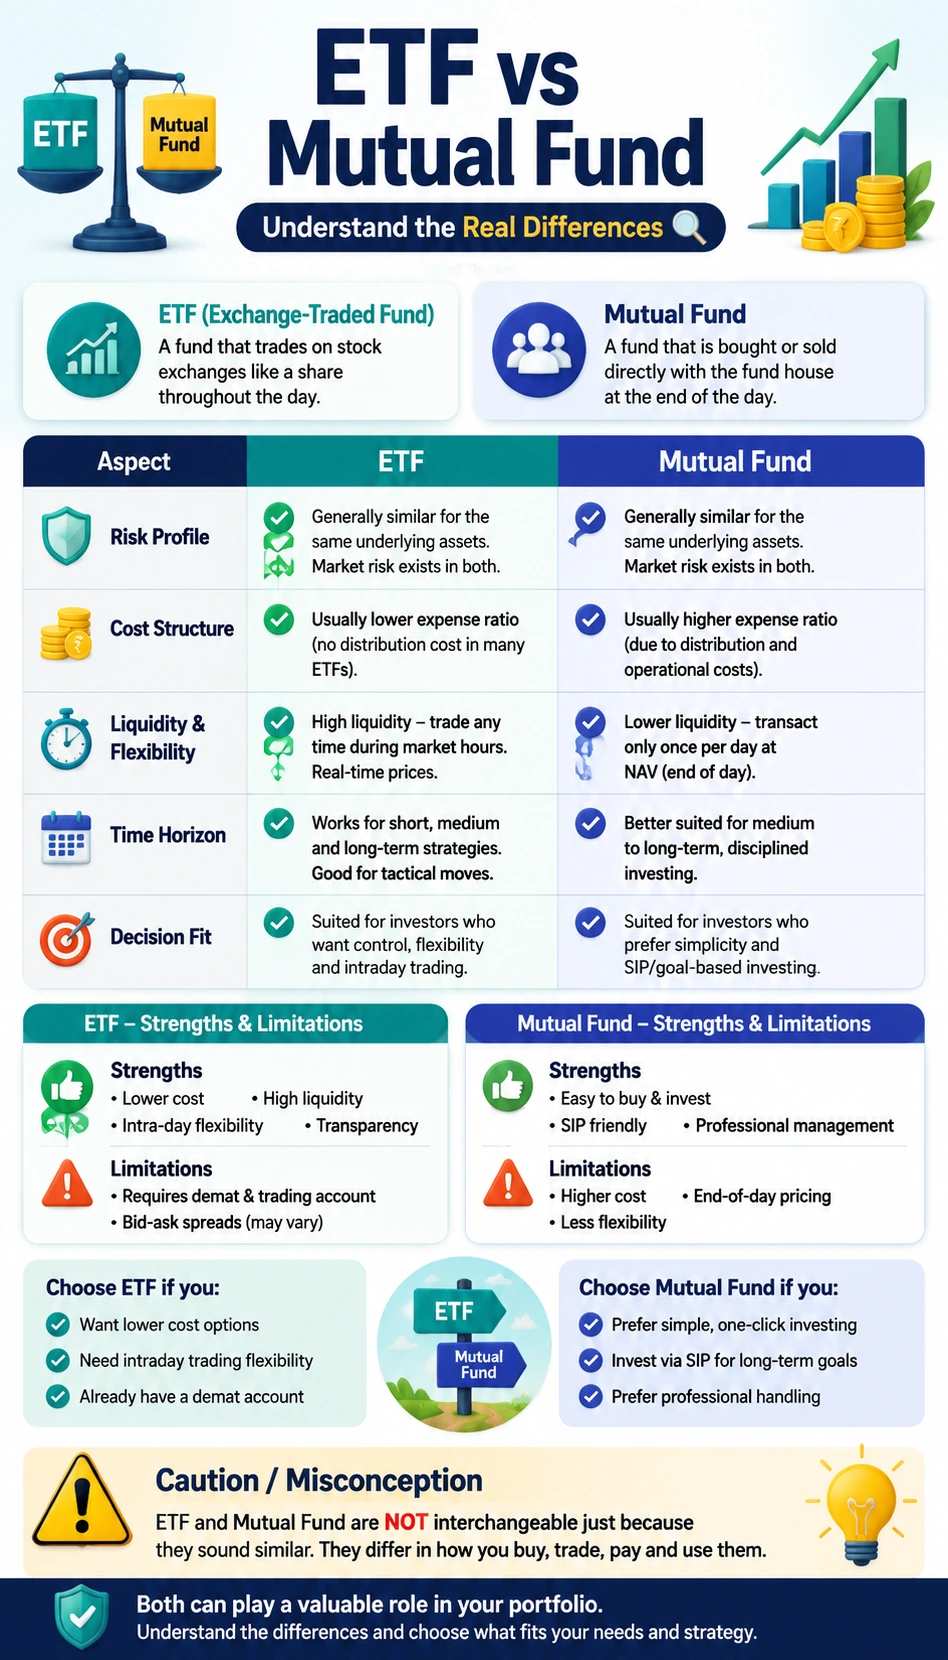
ETF vs Mutual Fund
A mobile-friendly etf vs mutual fund comparison infographic template with clear trade-offs, use cases, and decision logic.
Open detail page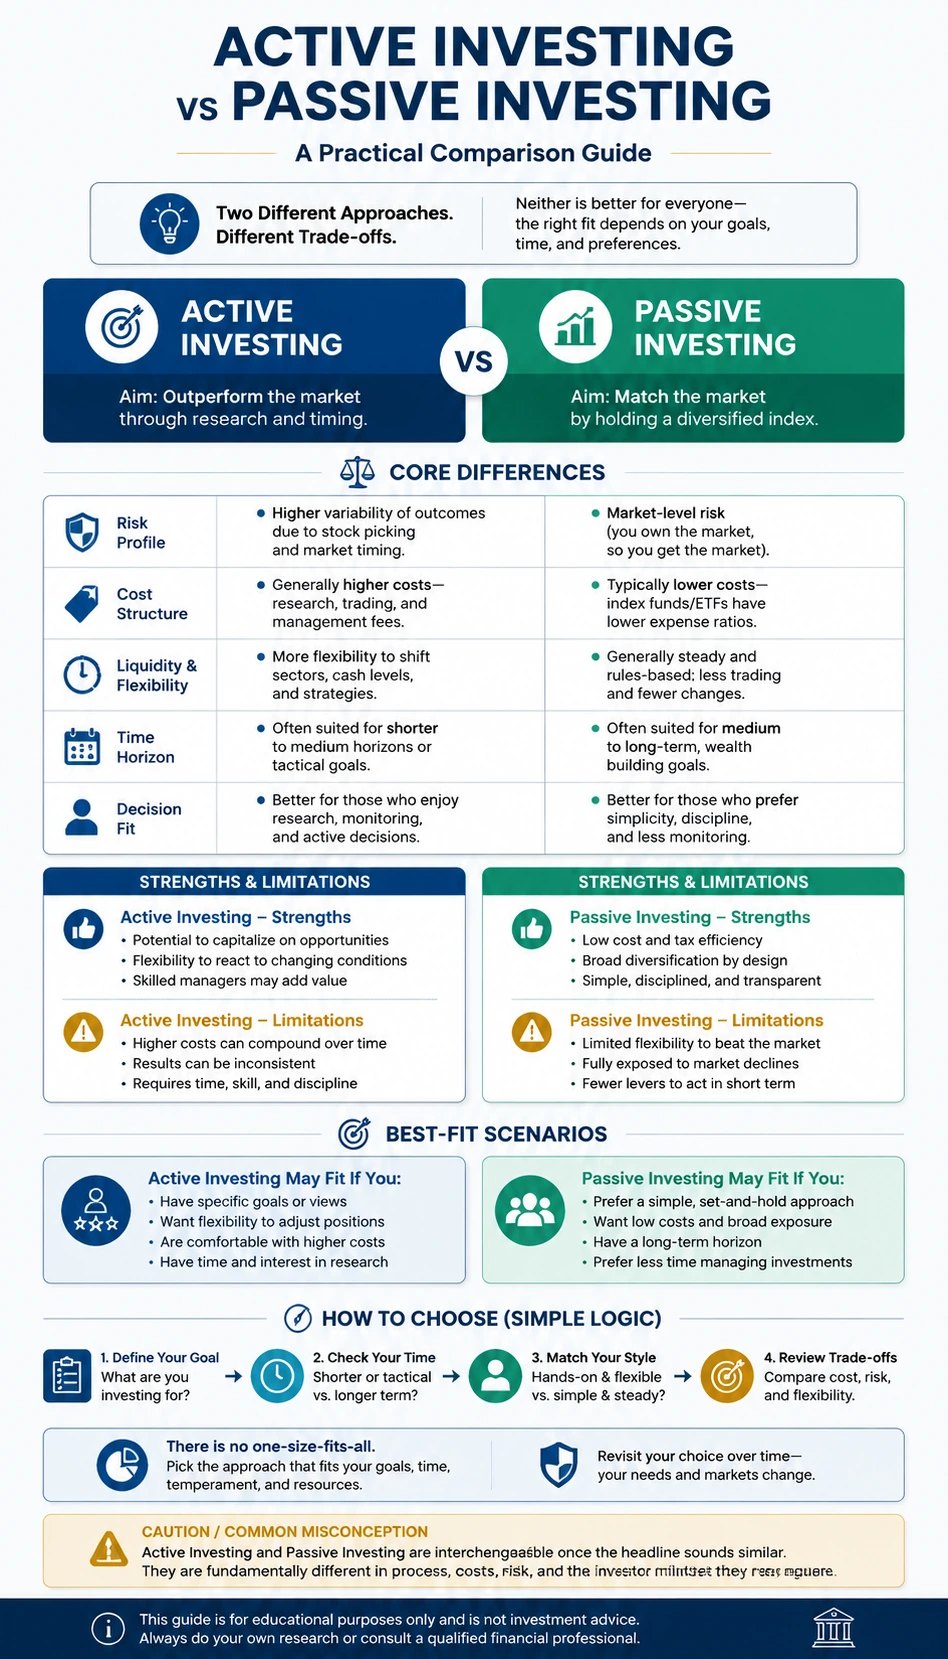
Active Investing vs Passive Investing
A mobile-friendly active investing vs passive investing comparison infographic template with clear trade-offs, use cases, and decision logic.
Open detail page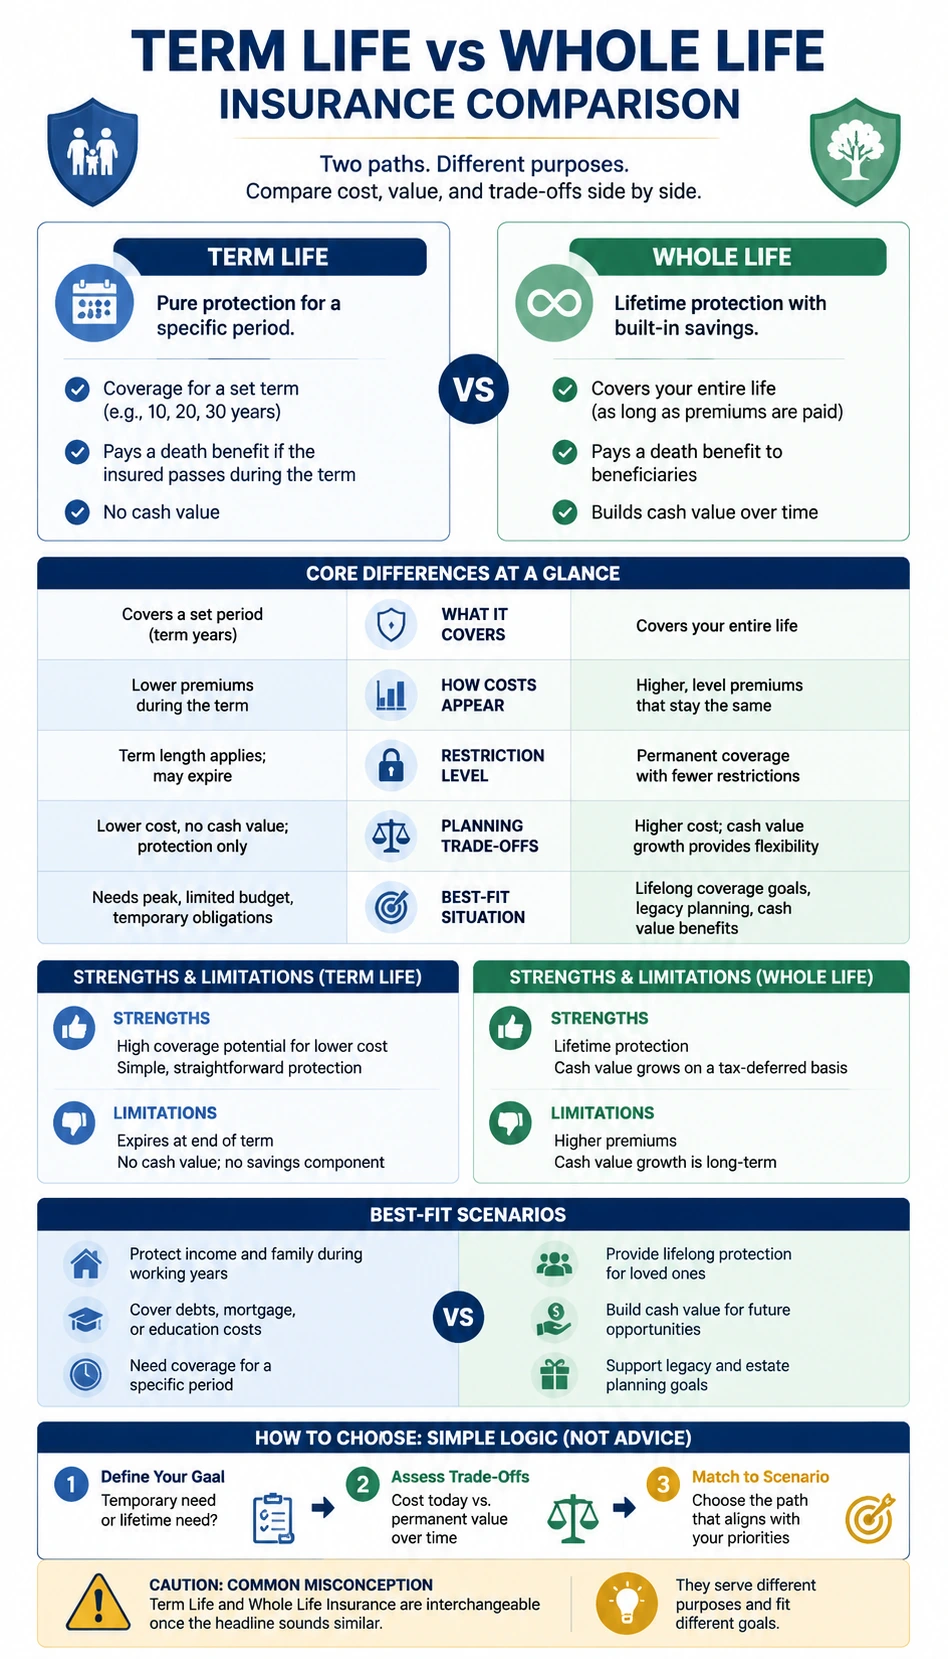
Term Life vs Whole Life Insurance
A mobile-friendly term life vs whole life insurance comparison infographic template with clear trade-offs, use cases, and decision logic.
Open detail page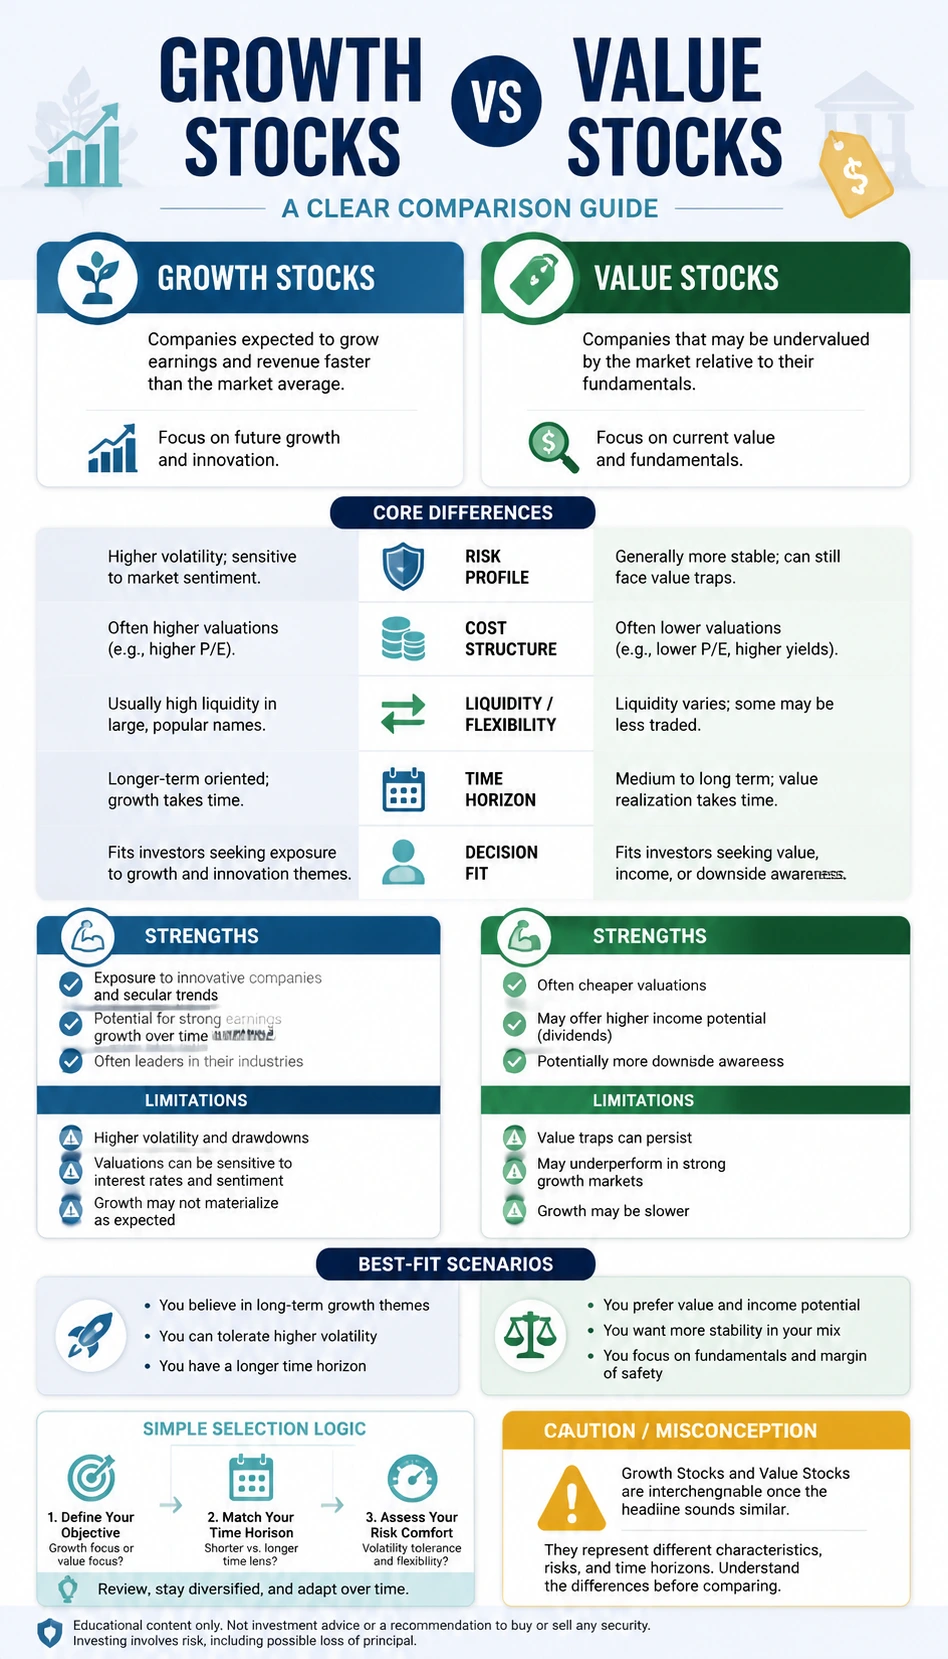
Growth Stocks vs Value Stocks
A mobile-friendly growth stocks vs value stocks comparison infographic template with clear trade-offs, use cases, and decision logic.
Open detail page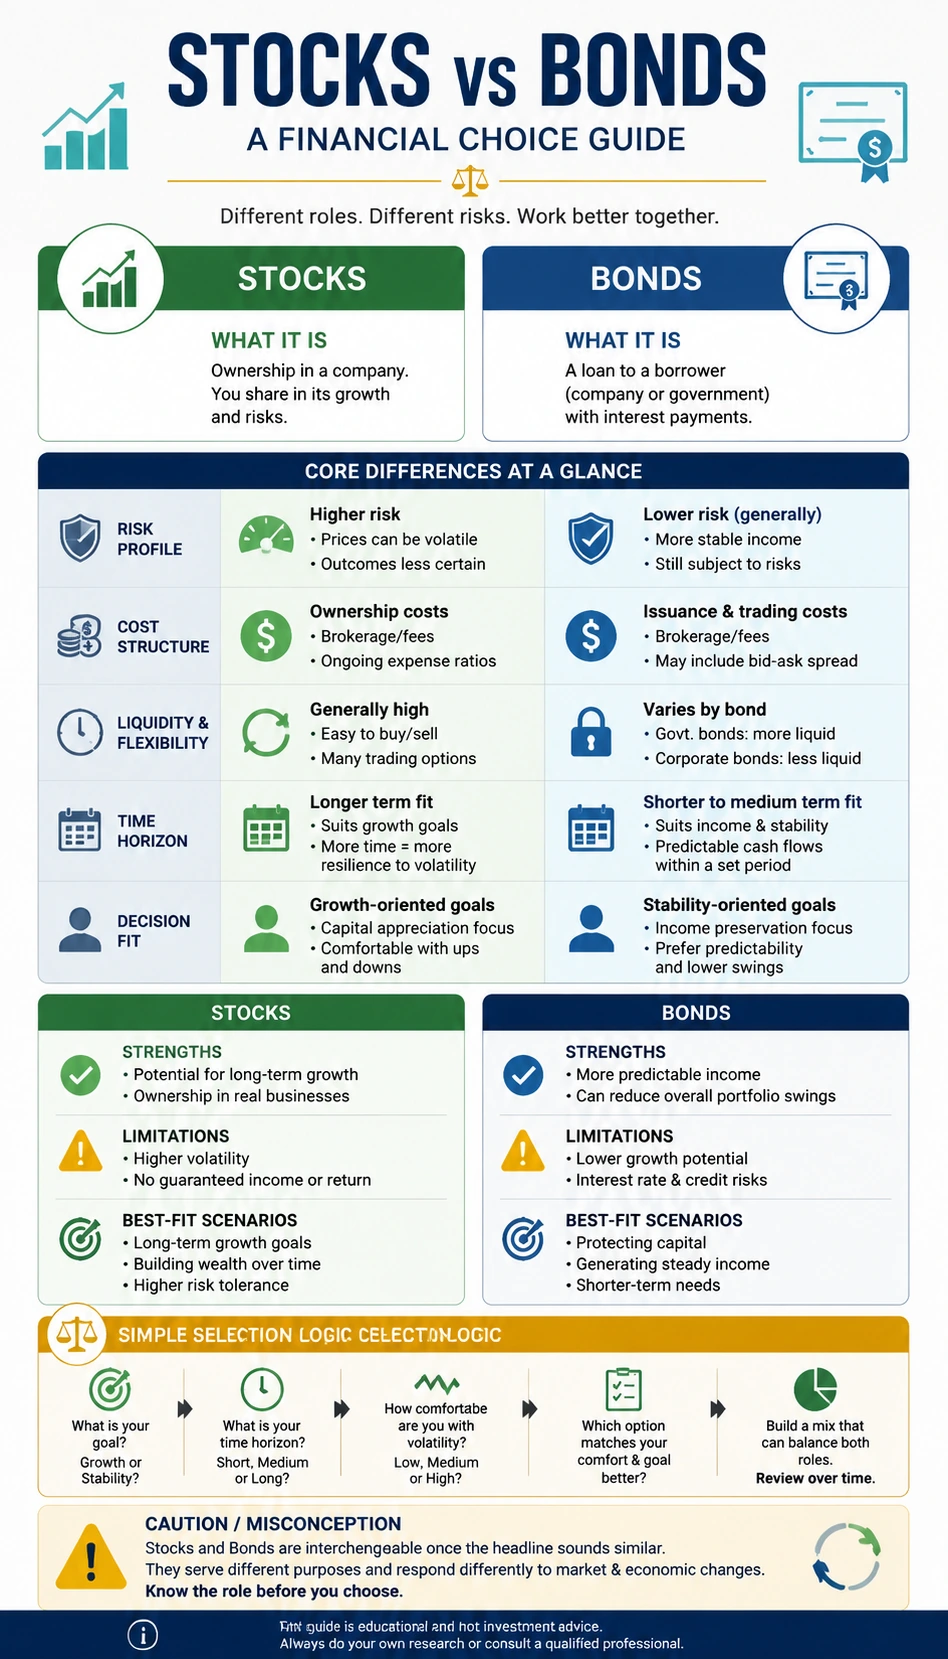
Stocks vs Bonds
A mobile-friendly stocks vs bonds comparison infographic template with clear trade-offs, use cases, and decision logic.
Open detail page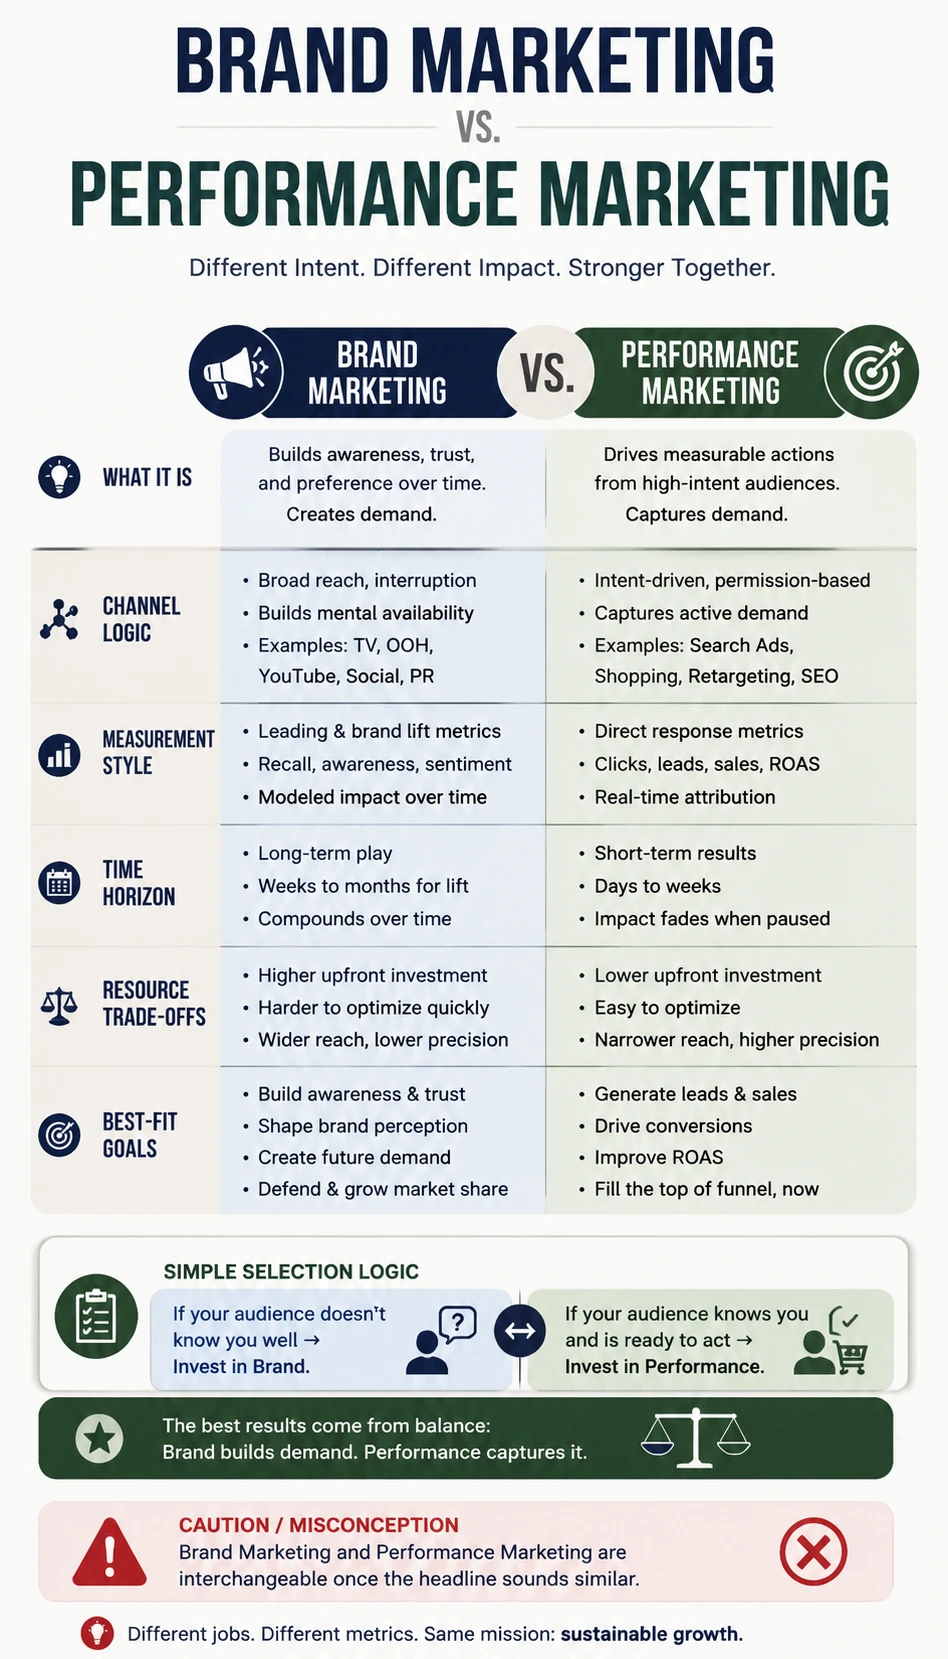
Brand Marketing vs Performance Marketing
A mobile-friendly brand marketing vs performance marketing comparison infographic template with clear trade-offs, use cases, and decision logic.
Open detail page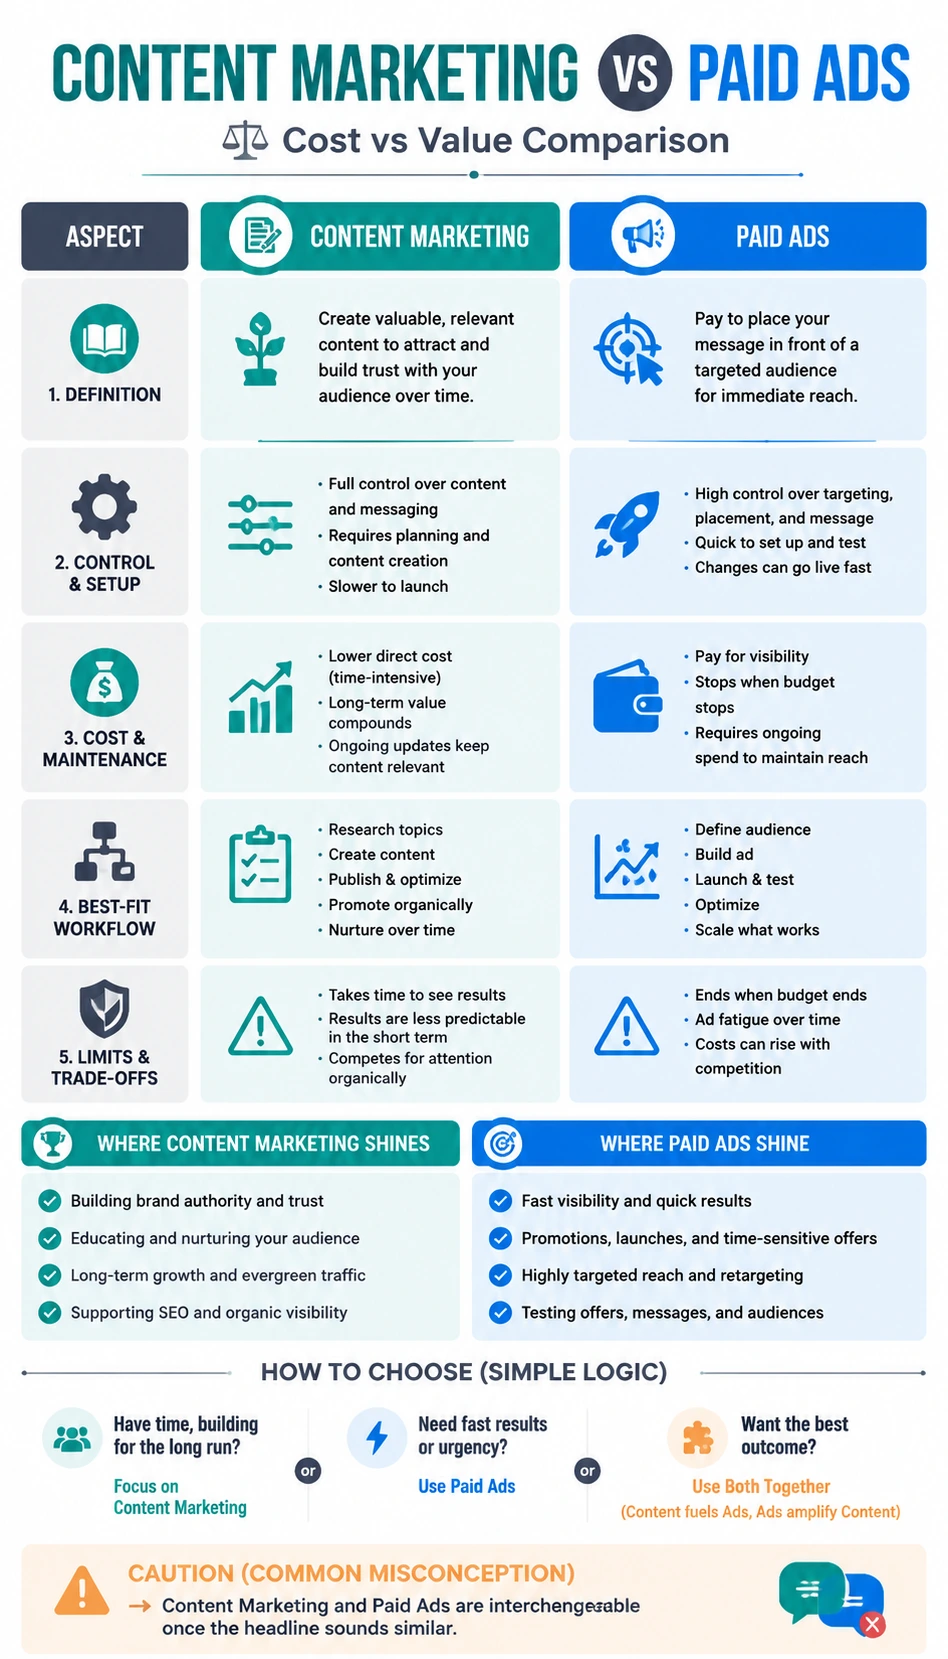
Content Marketing vs Paid Ads
A mobile-friendly content marketing vs paid ads comparison infographic template with clear trade-offs, use cases, and decision logic.
Open detail page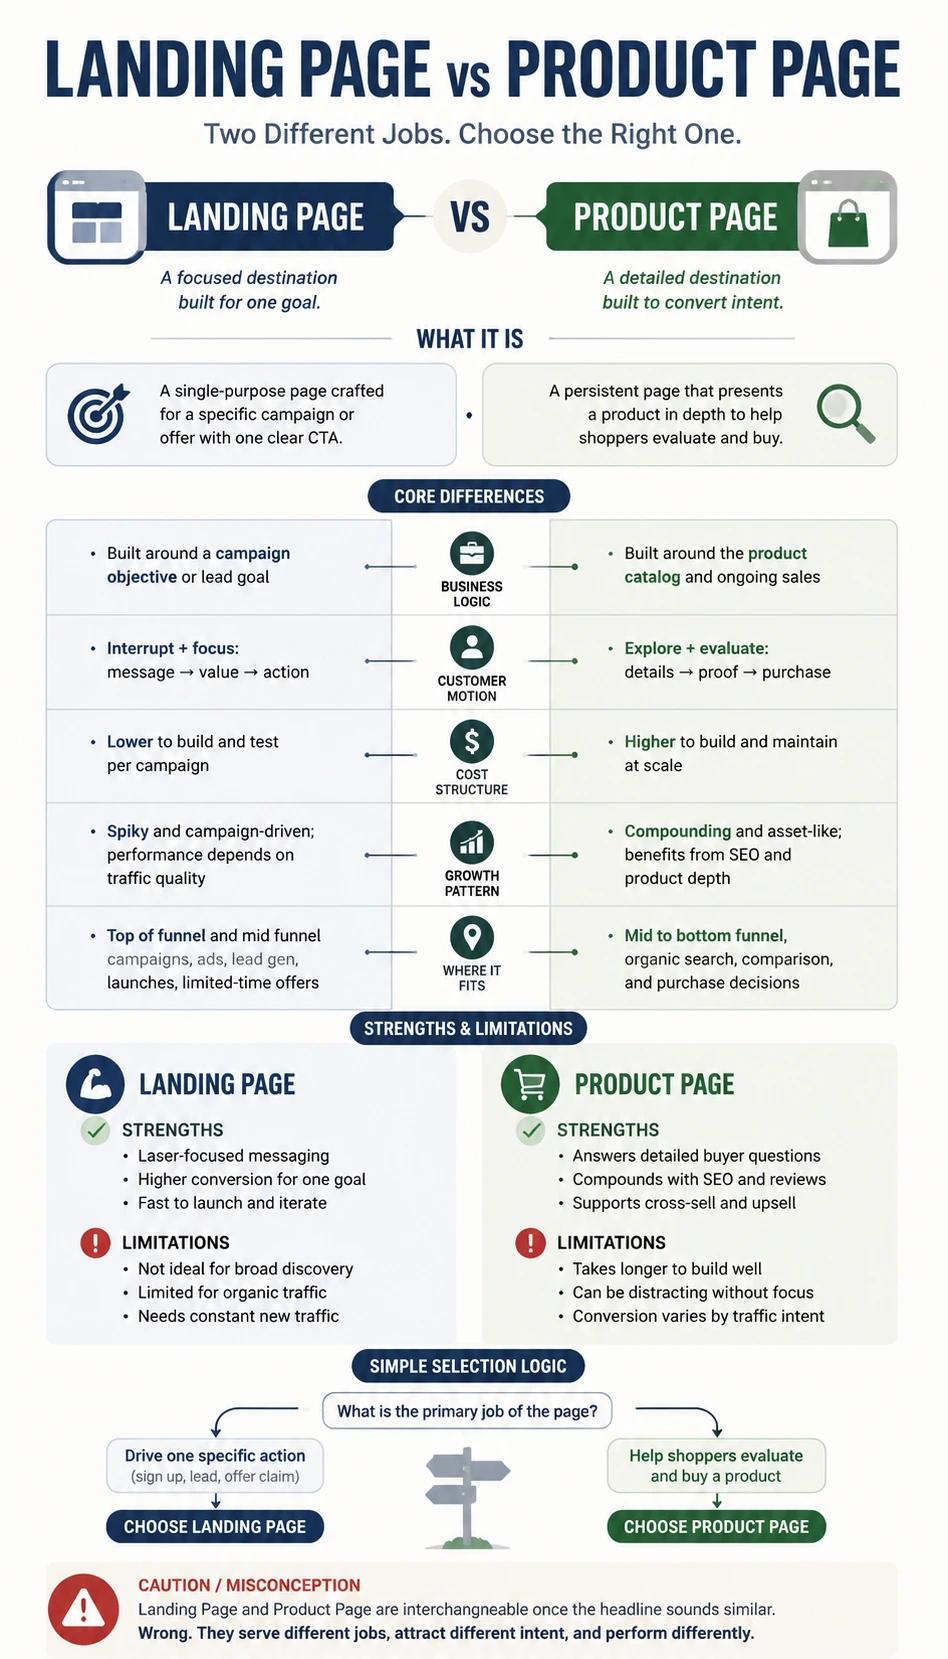
Landing Page vs Product Page
A mobile-friendly landing page vs product page comparison infographic template with clear trade-offs, use cases, and decision logic.
Open detail page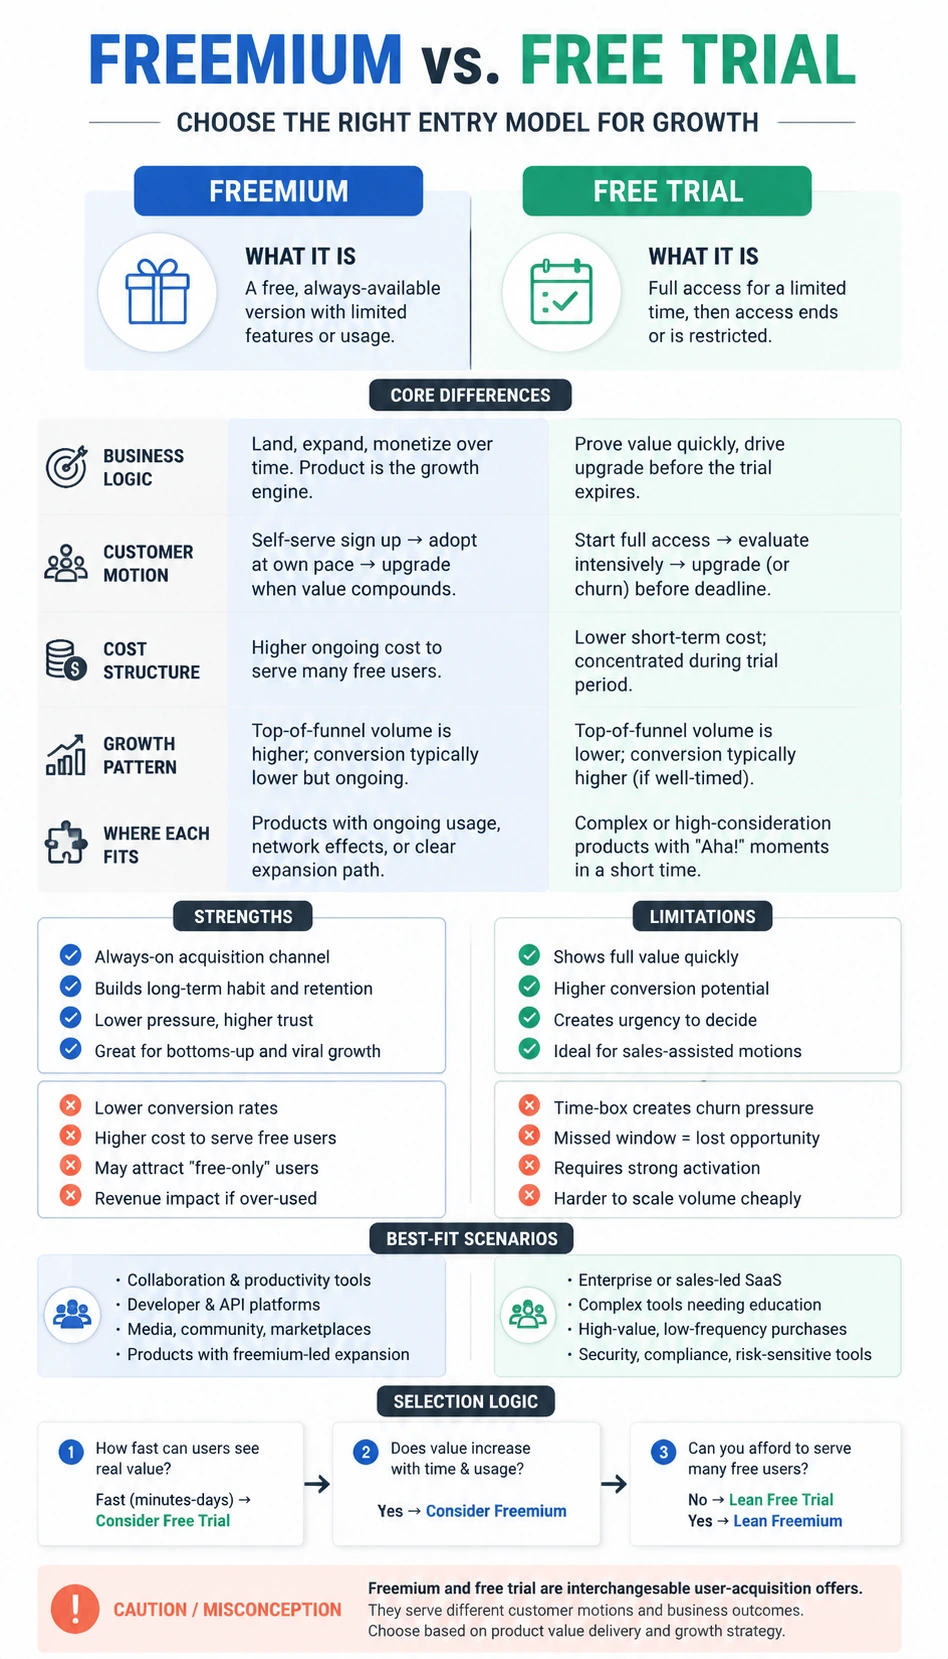
Freemium vs Free Trial
A mobile-friendly freemium vs free trial comparison infographic template with clear trade-offs, use cases, and decision logic.
Open detail page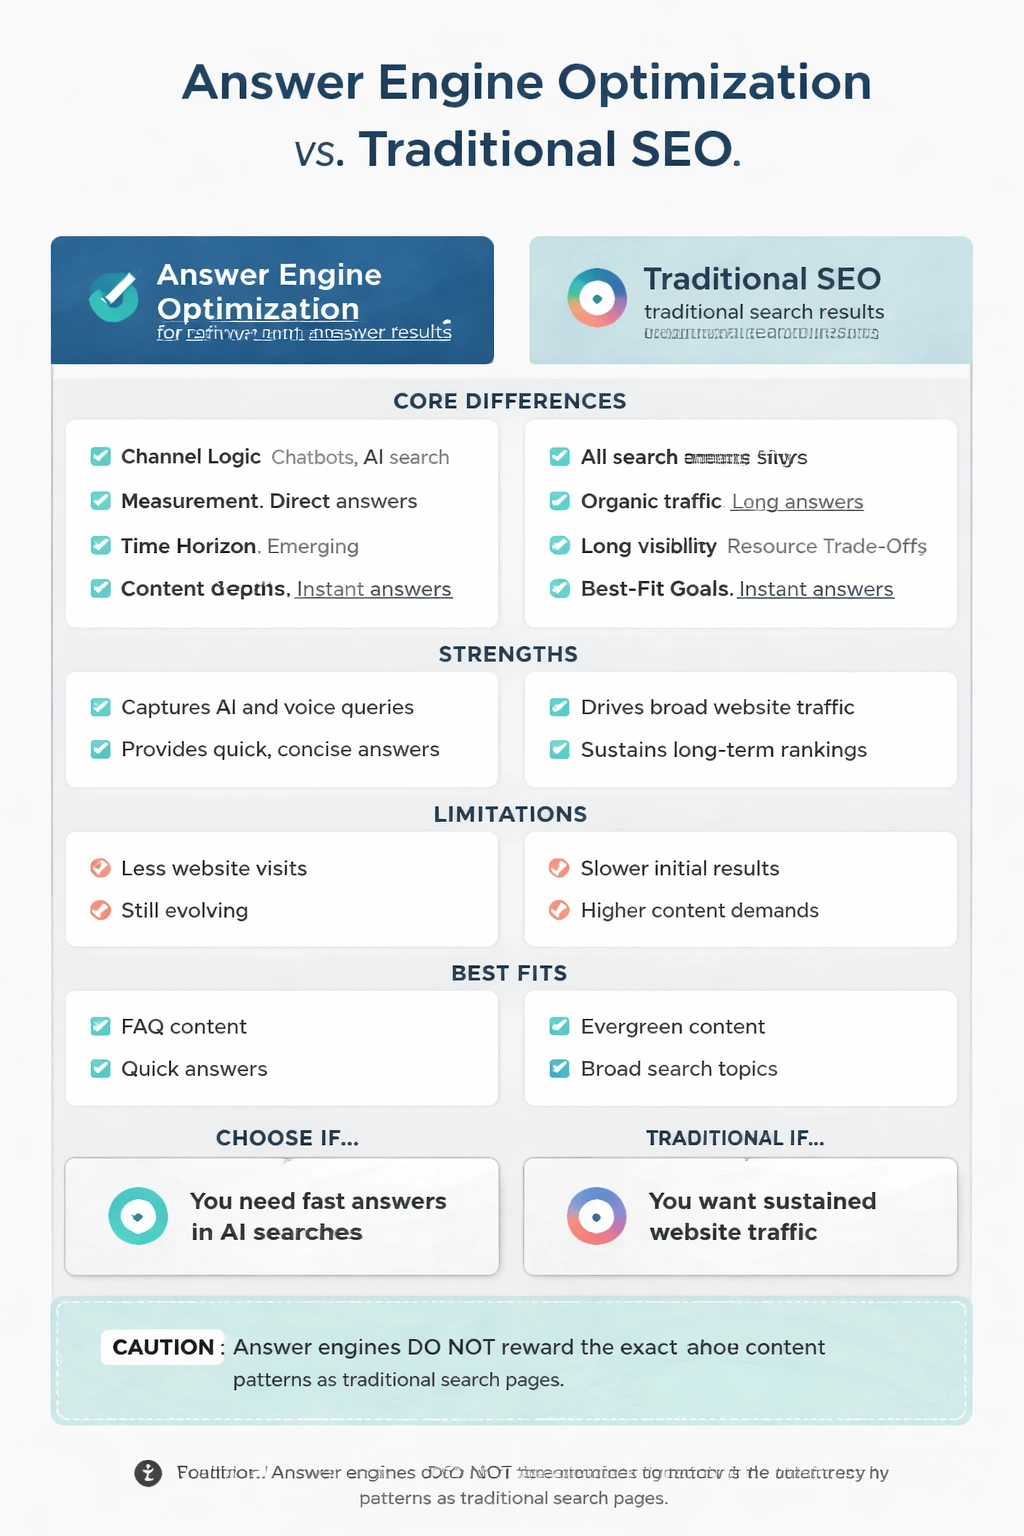
Answer Engine Optimization vs Traditional SEO
A mobile-friendly answer engine optimization vs traditional seo comparison infographic template with clear trade-offs, use cases, and decision logic.
Open detail page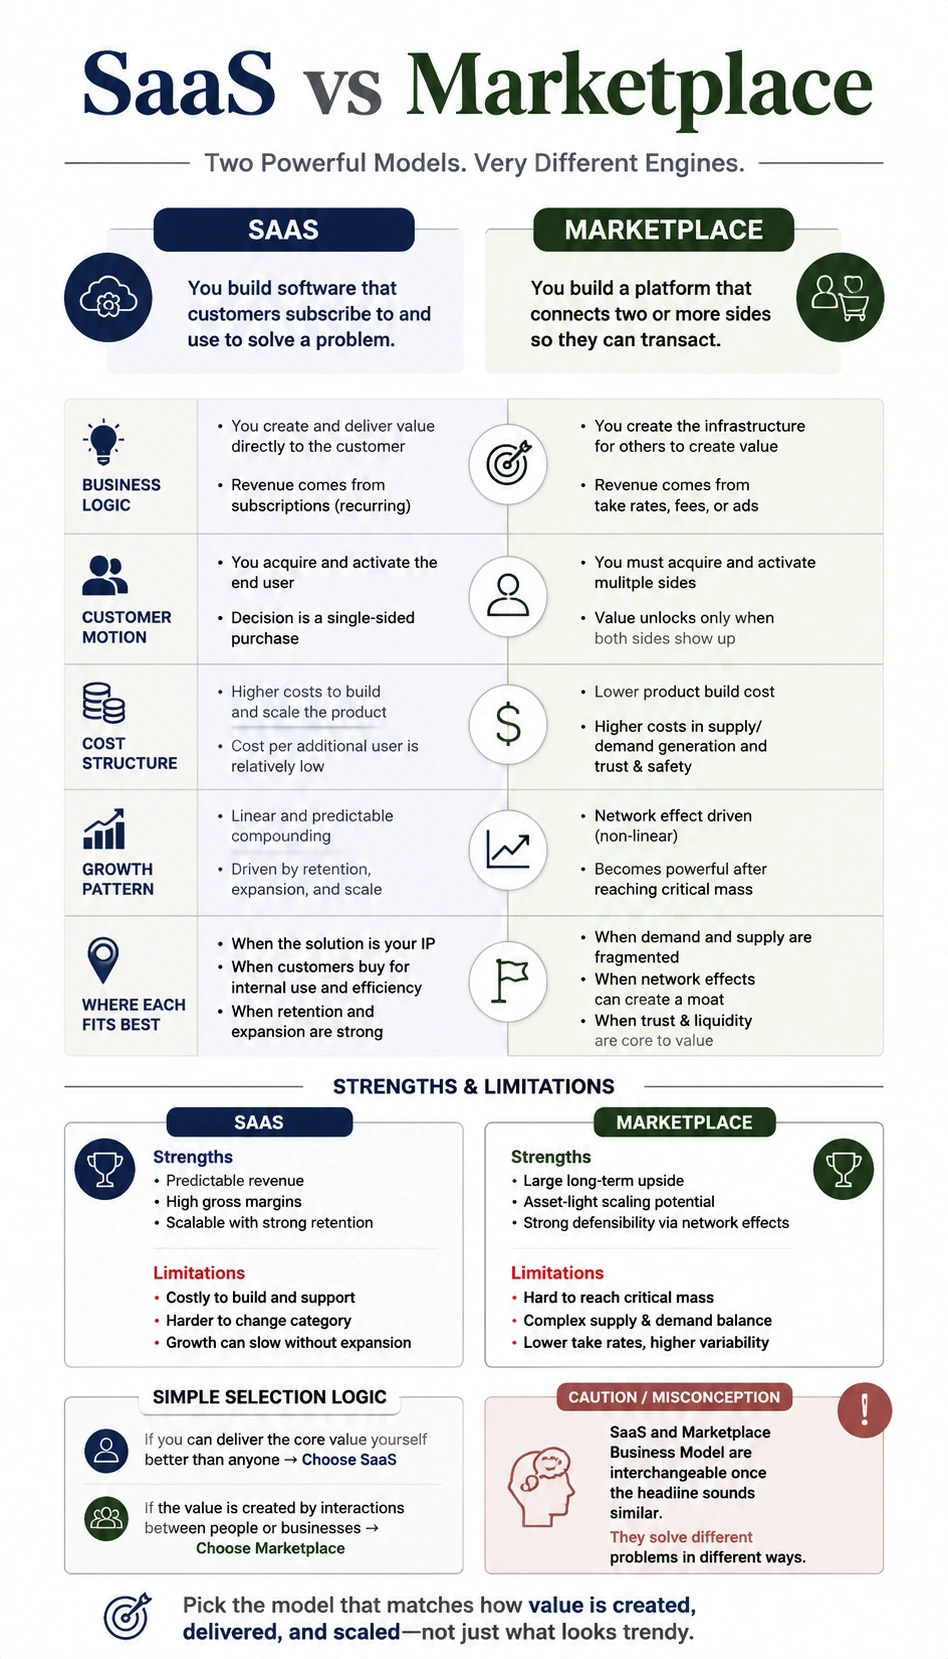
SaaS vs Marketplace Business Model
A mobile-friendly saas vs marketplace business model comparison infographic template with clear trade-offs, use cases, and decision logic.
Open detail page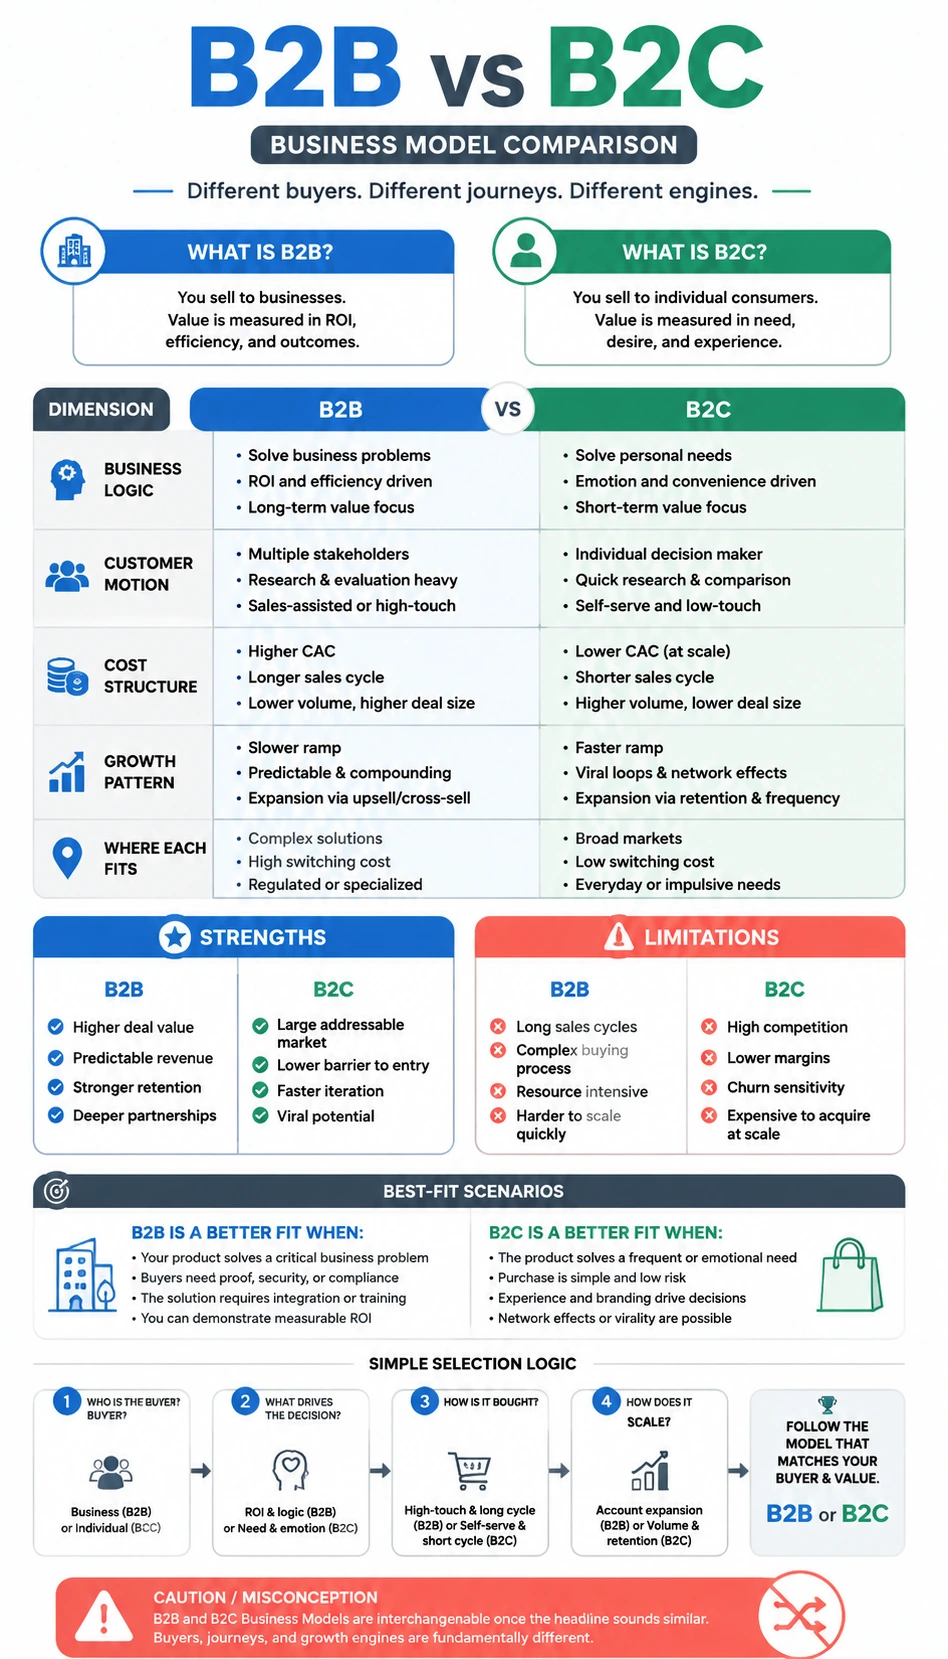
B2B vs B2C Business Model
A mobile-friendly b2b vs b2c business model comparison infographic template with clear trade-offs, use cases, and decision logic.
Open detail page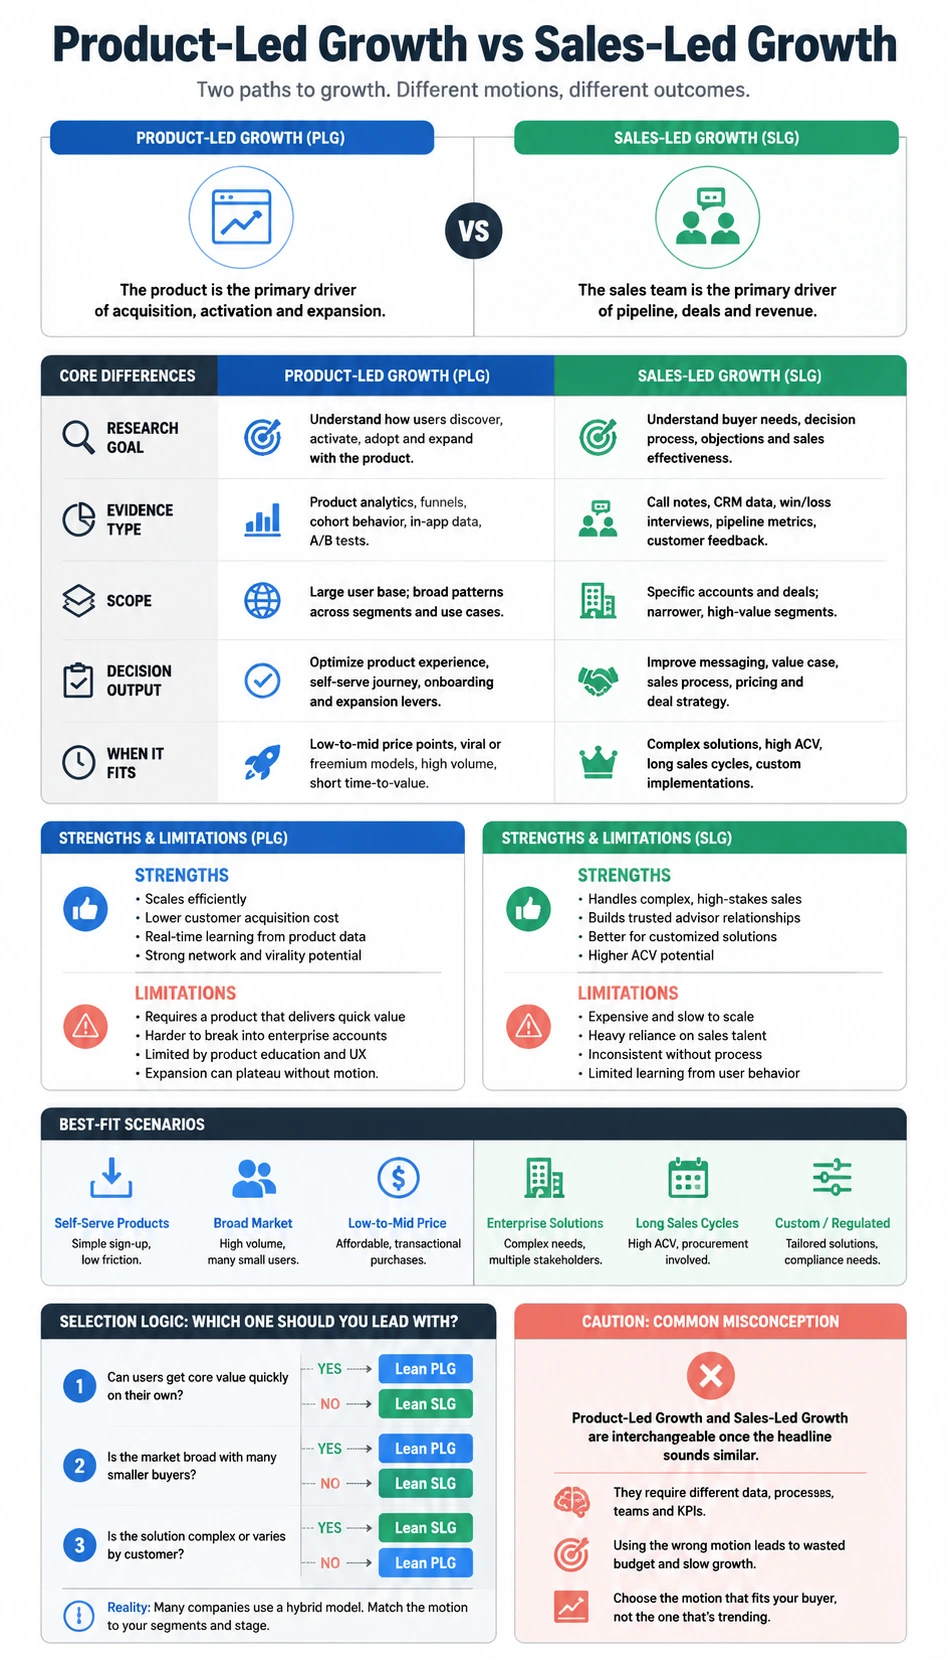
Product-Led Growth vs Sales-Led Growth
A mobile-friendly product-led growth vs sales-led growth comparison infographic template with clear trade-offs, use cases, and decision logic.
Open detail page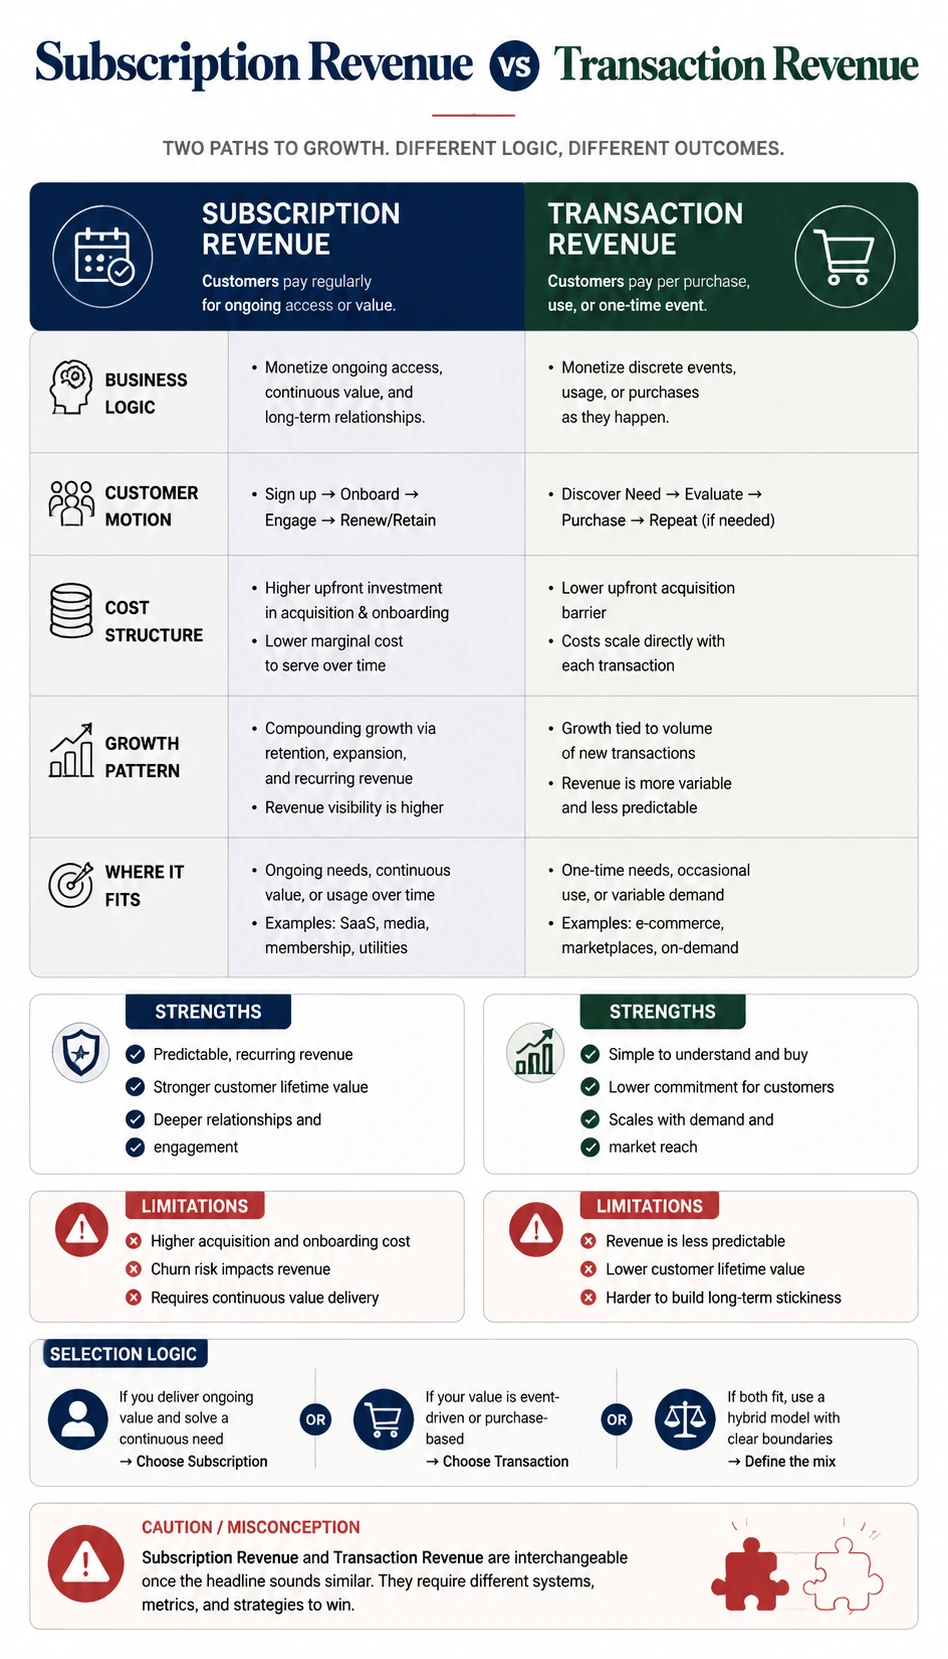
Subscription Revenue vs Transaction Revenue
A mobile-friendly subscription revenue vs transaction revenue comparison infographic template with clear trade-offs, use cases, and decision logic.
Open detail page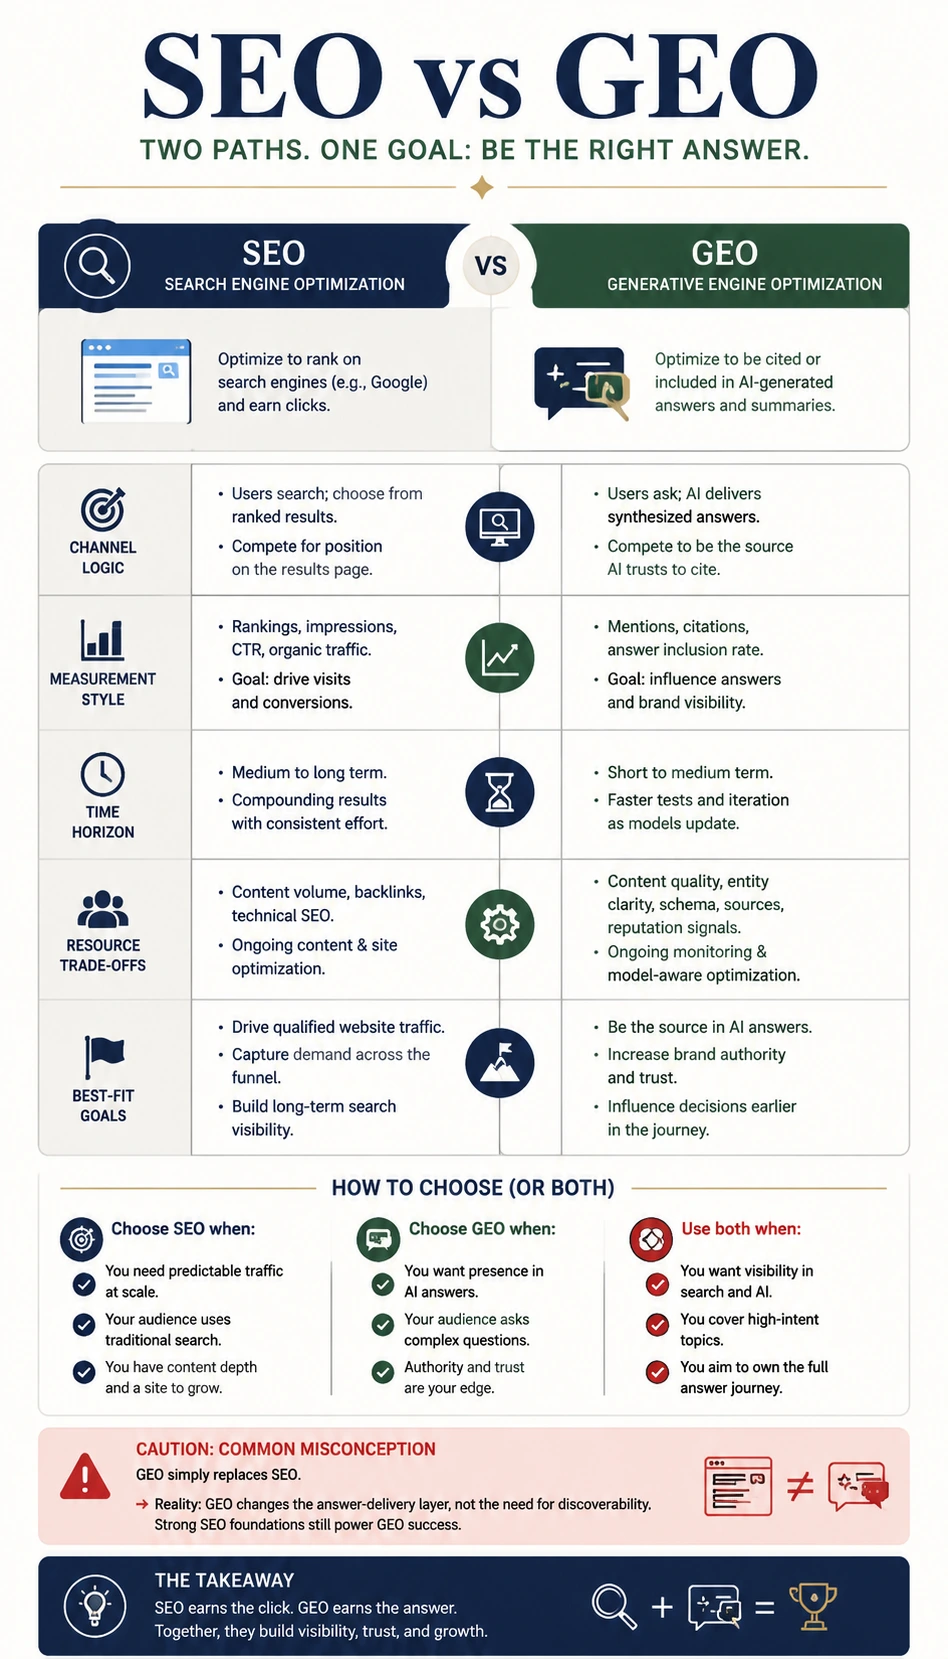
SEO vs GEO
A mobile-friendly seo vs geo comparison infographic template with clear trade-offs, use cases, and decision logic.
Open detail page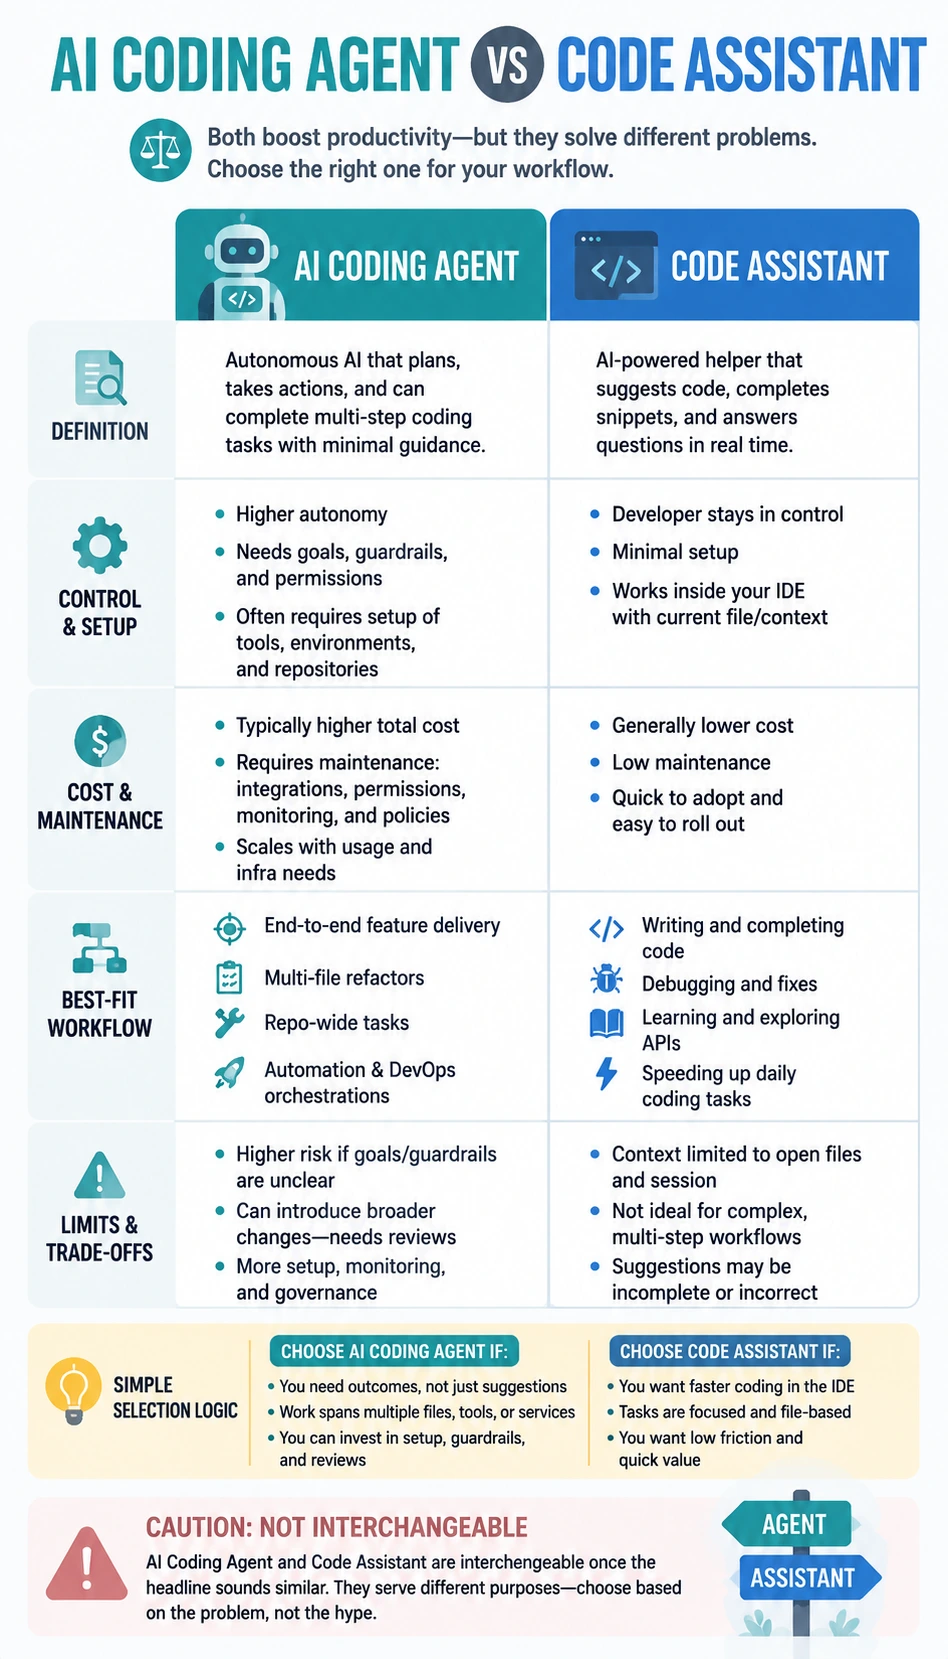
AI Coding Agent vs Code Assistant
A mobile-friendly ai coding agent vs code assistant comparison infographic template with clear trade-offs, use cases, and decision logic.
Open detail page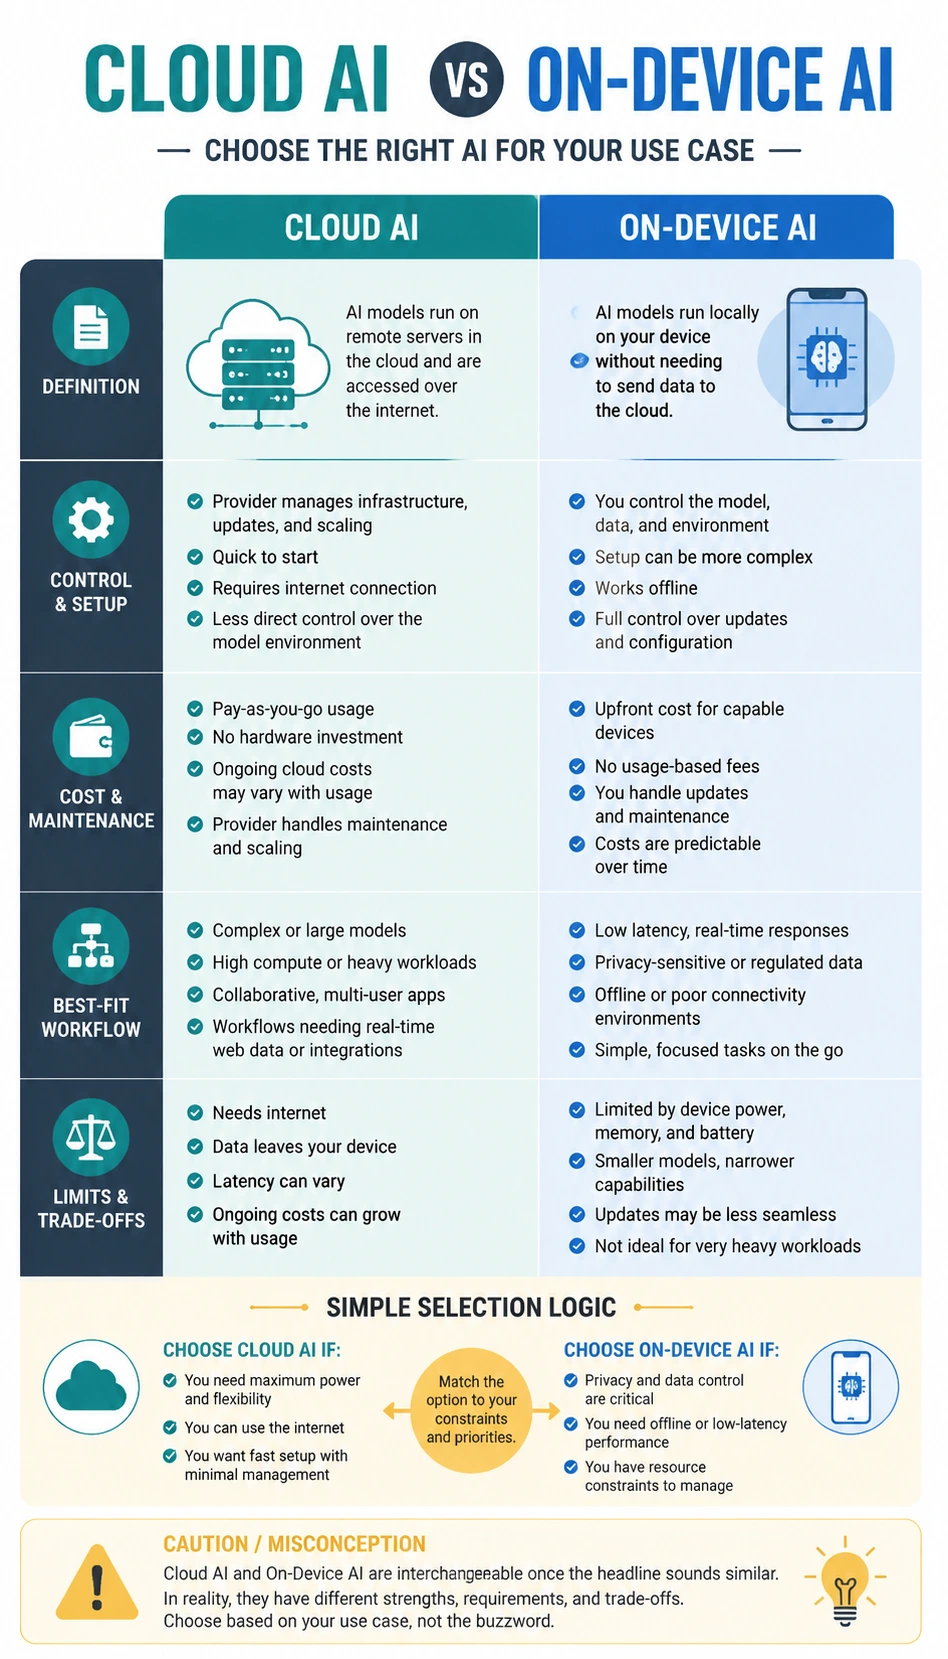
Cloud AI vs On-Device AI
A mobile-friendly cloud ai vs on-device ai comparison infographic template with clear trade-offs, use cases, and decision logic.
Open detail page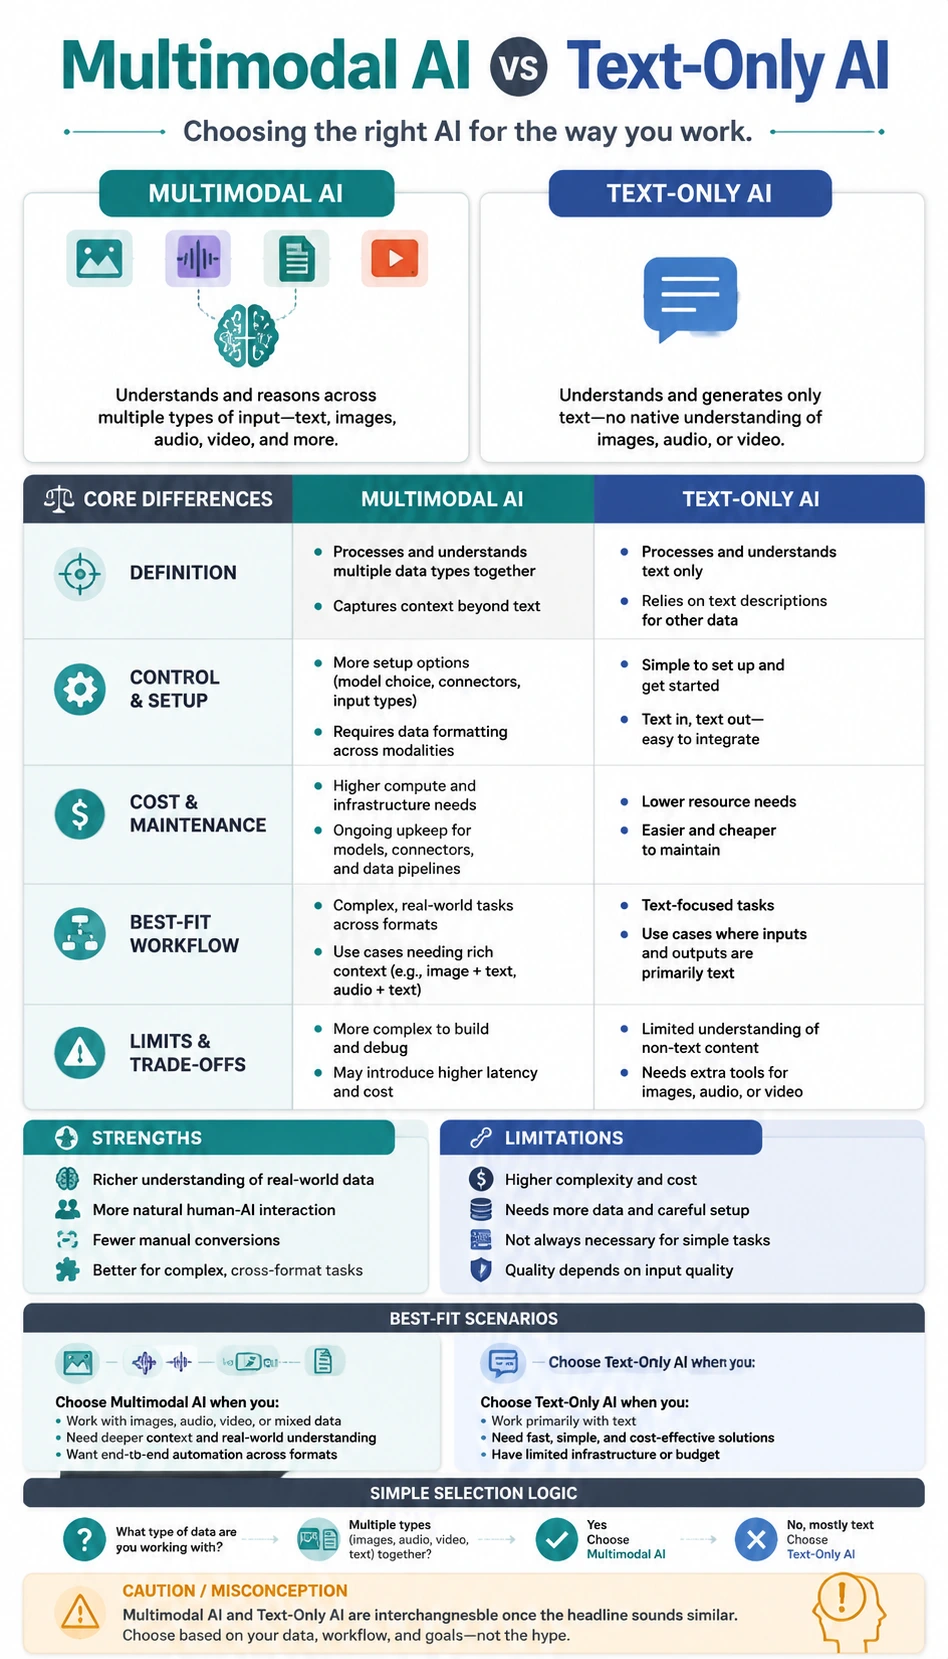
Multimodal AI vs Text-Only AI
A mobile-friendly multimodal ai vs text-only ai comparison infographic template with clear trade-offs, use cases, and decision logic.
Open detail page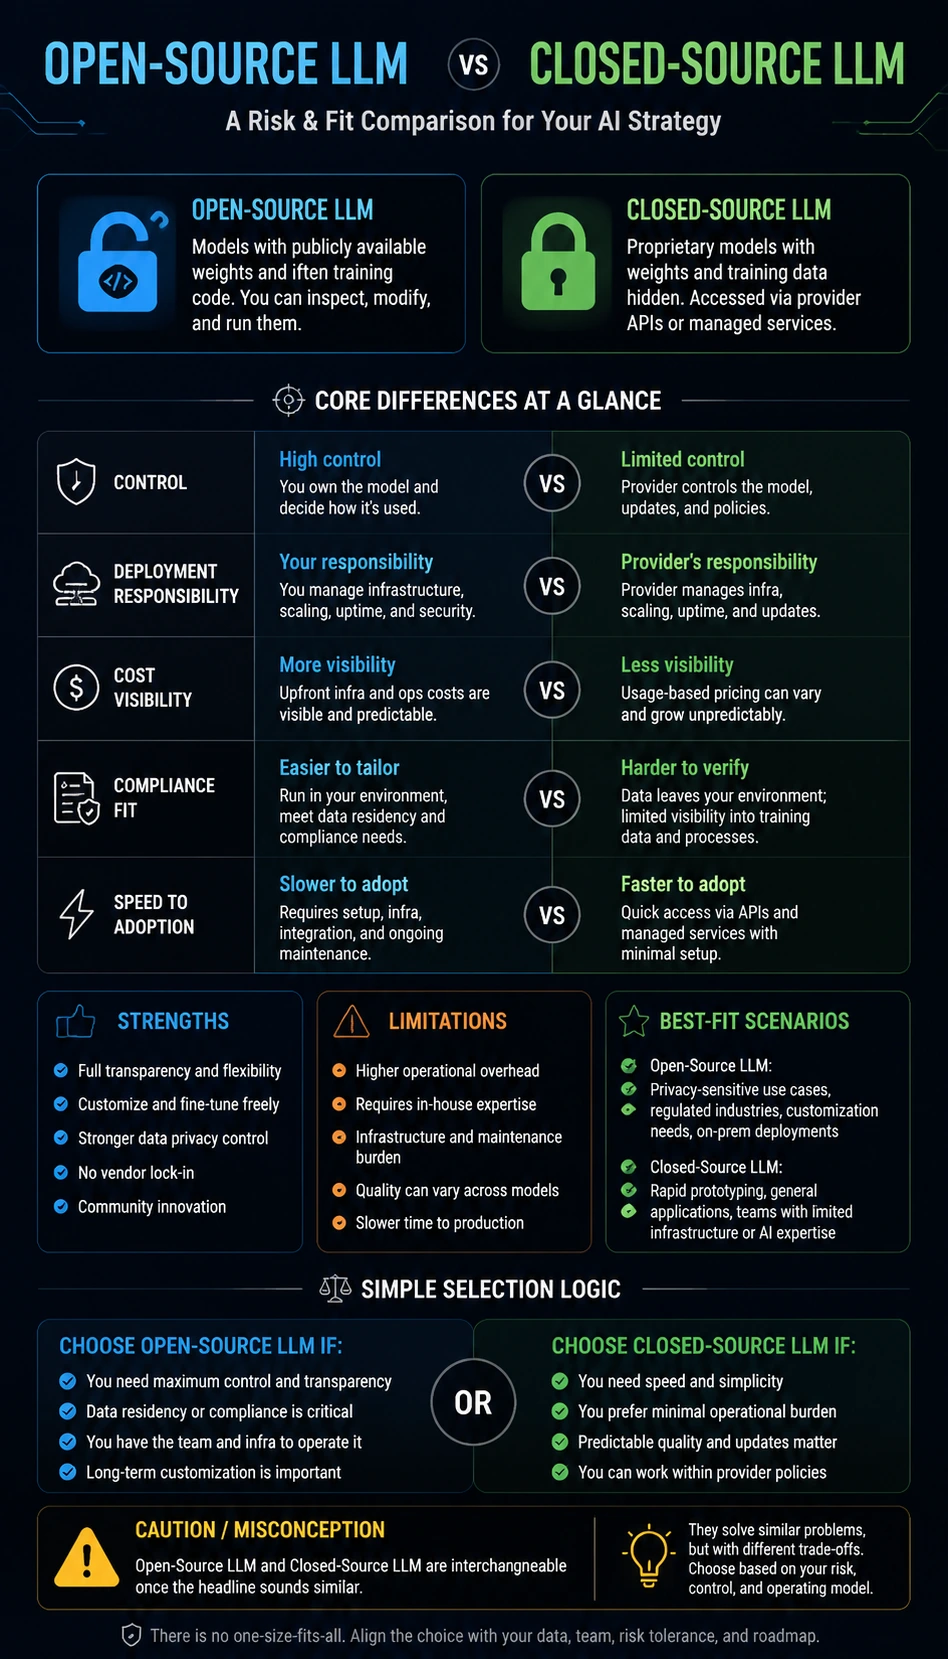
Open-Source LLM vs Closed-Source LLM
A mobile-friendly open-source llm vs closed-source llm comparison infographic template with clear trade-offs, use cases, and decision logic.
Open detail page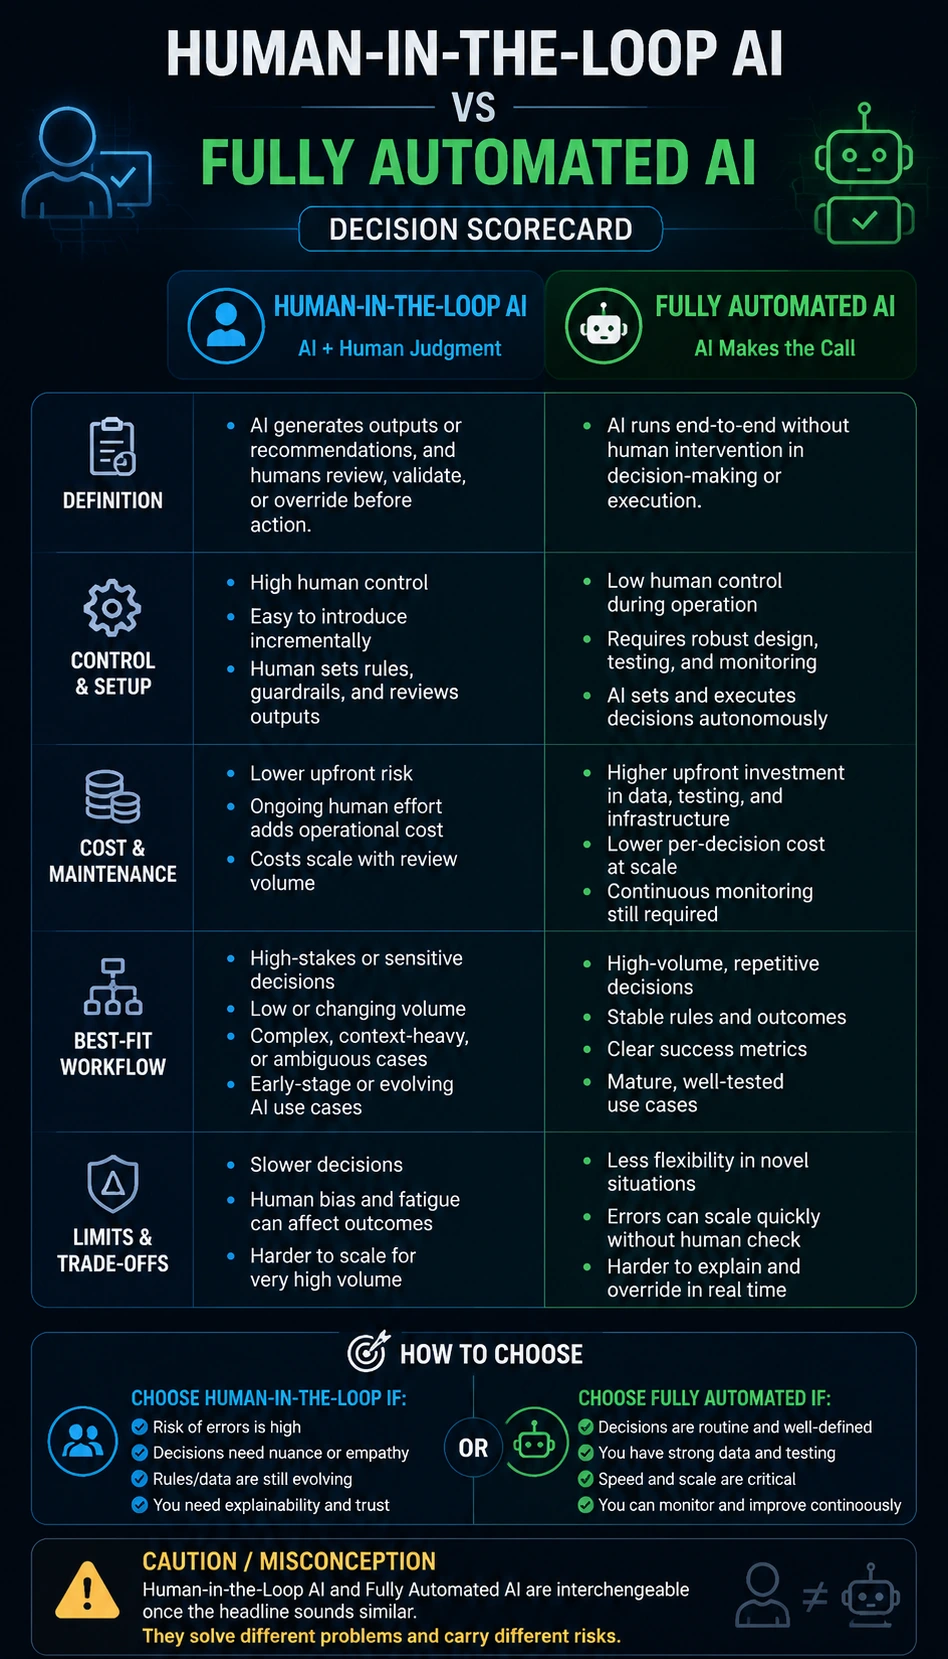
Human-in-the-Loop AI vs Fully Automated AI
A mobile-friendly human-in-the-loop ai vs fully automated ai comparison infographic template with clear trade-offs, use cases, and decision logic.
Open detail page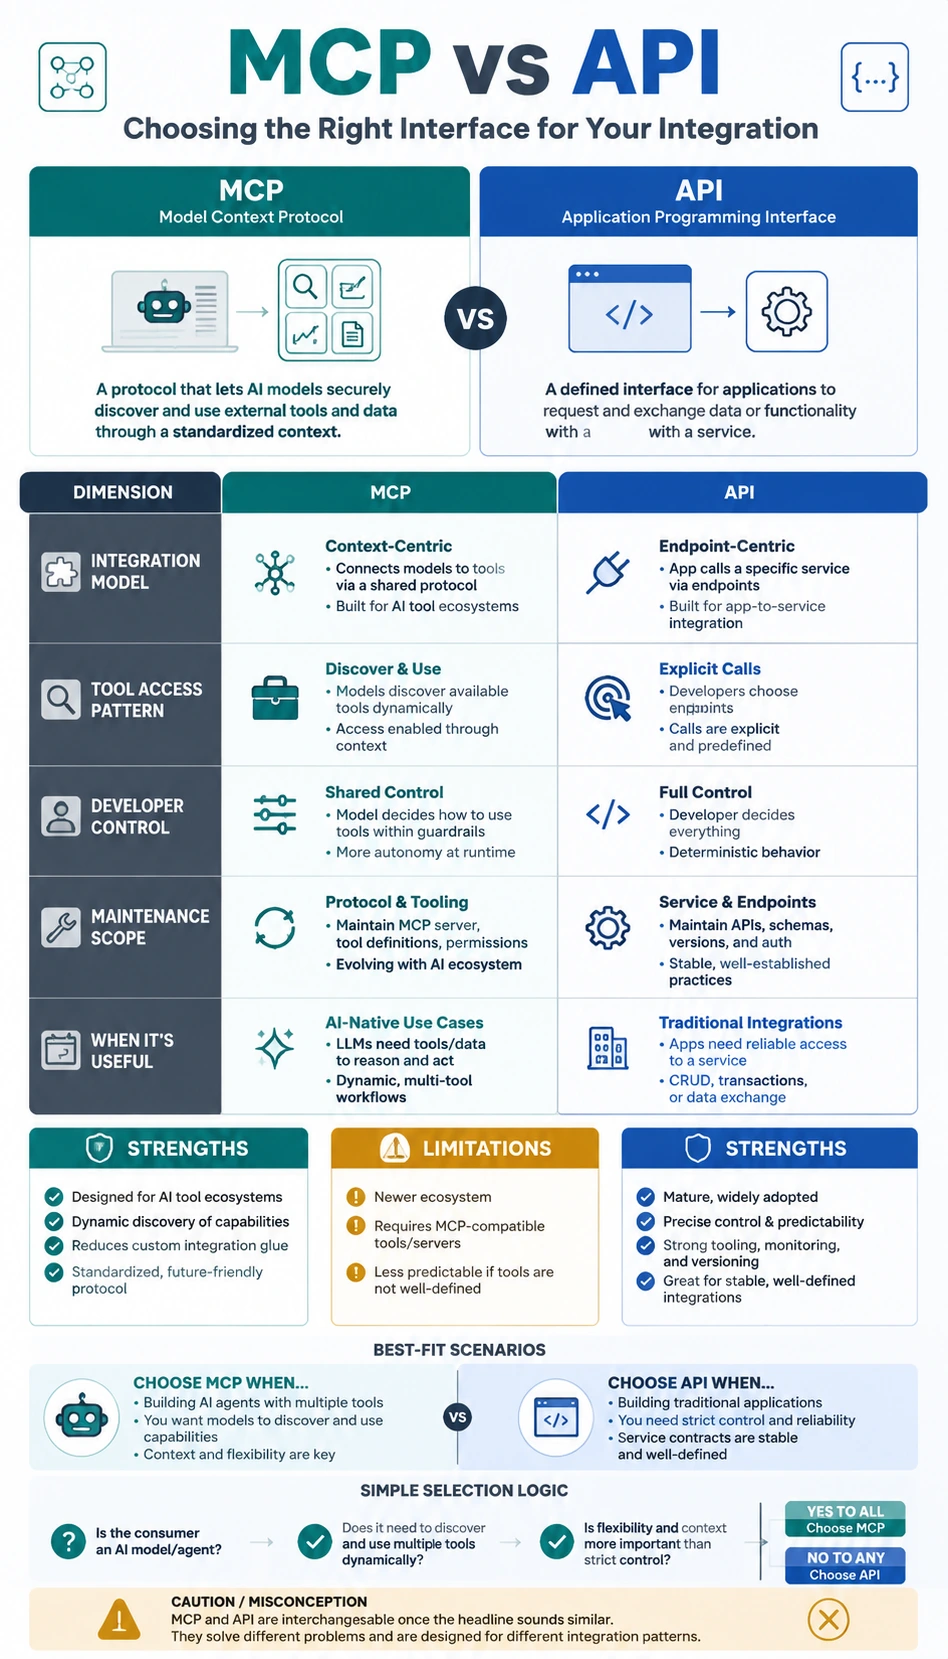
MCP vs API
A mobile-friendly mcp vs api comparison infographic template with clear trade-offs, use cases, and decision logic.
Open detail page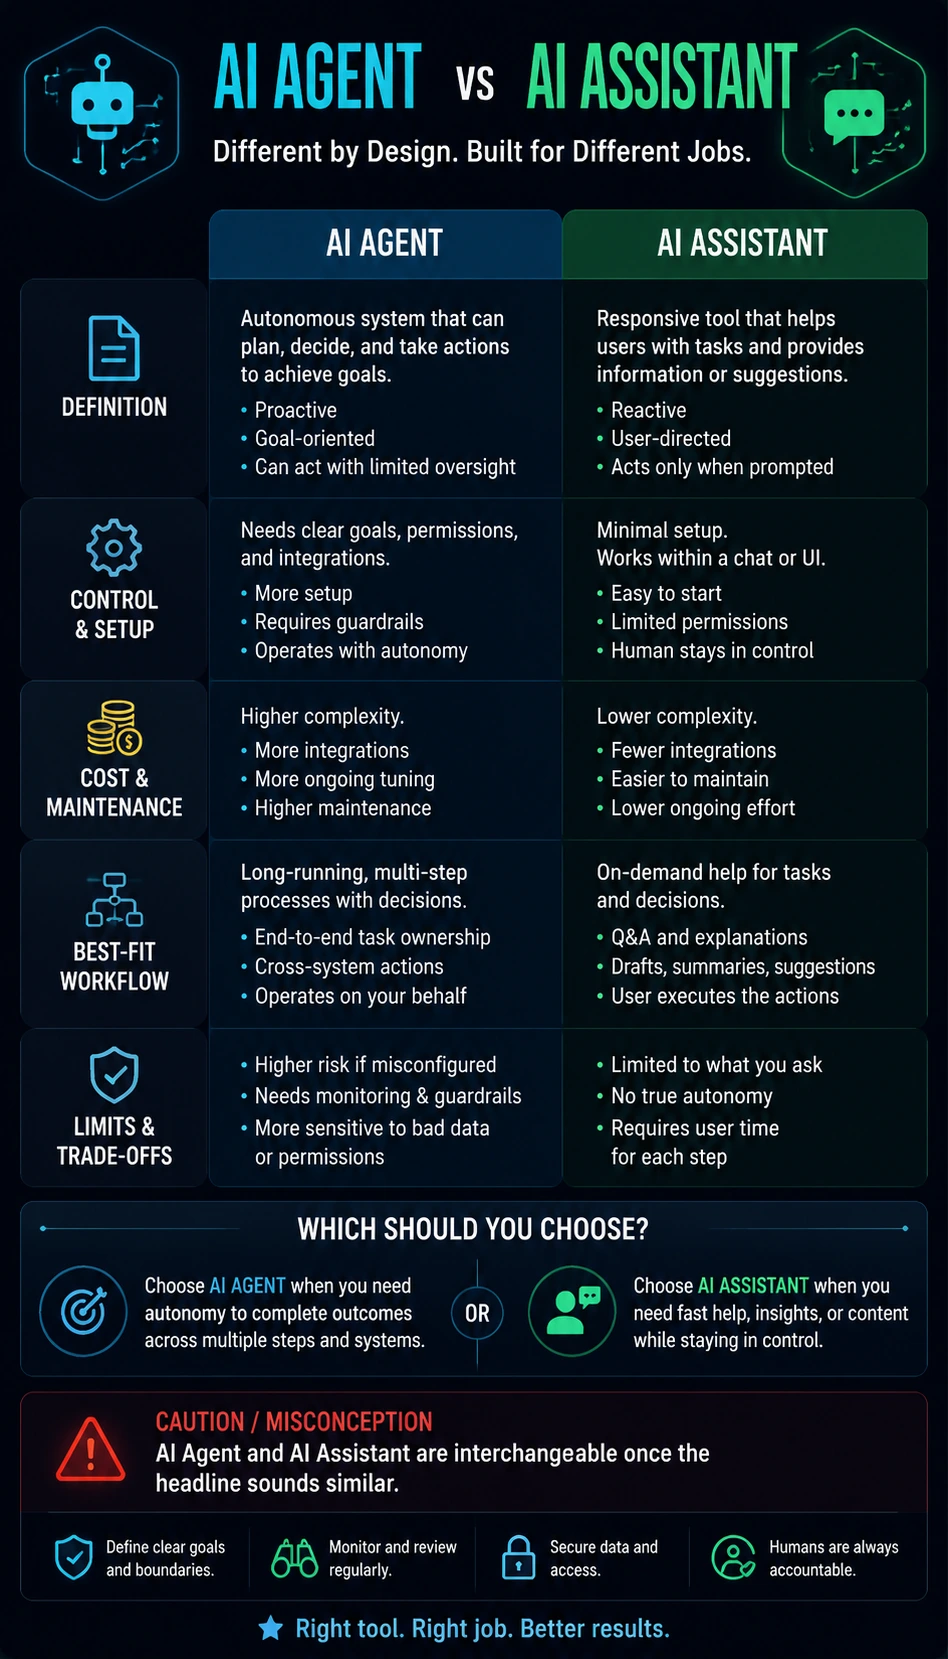
AI Agent vs AI Assistant
A mobile-friendly ai agent vs ai assistant comparison infographic template with clear trade-offs, use cases, and decision logic.
Open detail page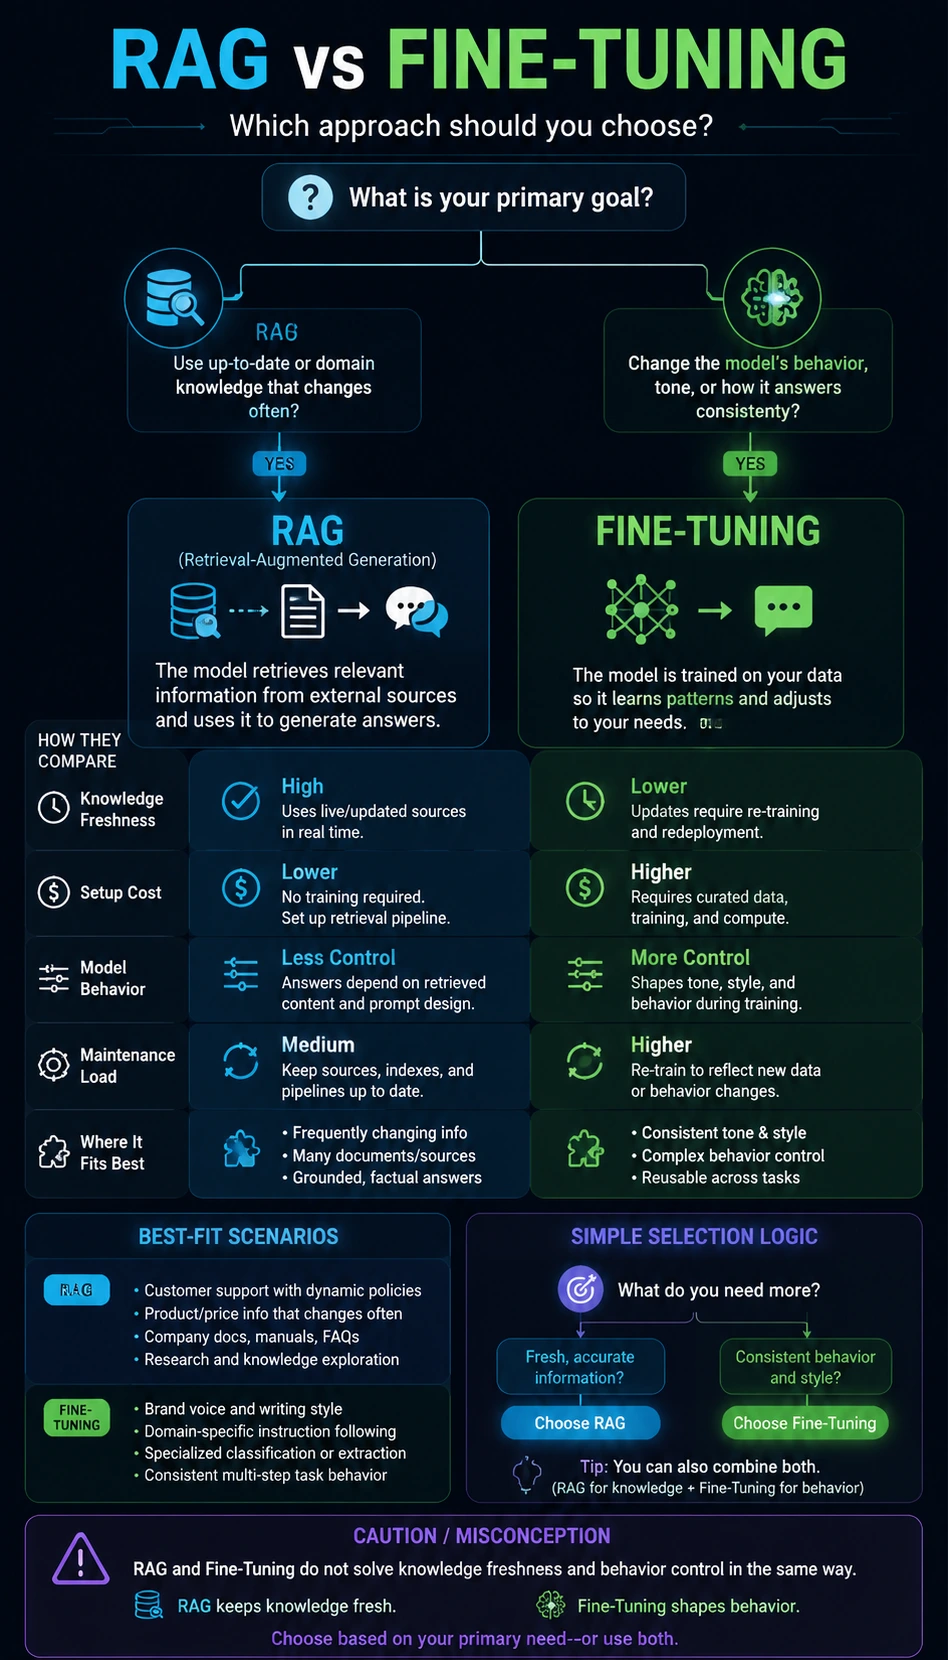
RAG vs Fine-Tuning
A mobile-friendly rag vs fine-tuning comparison infographic template with clear trade-offs, use cases, and decision logic.
Open detail page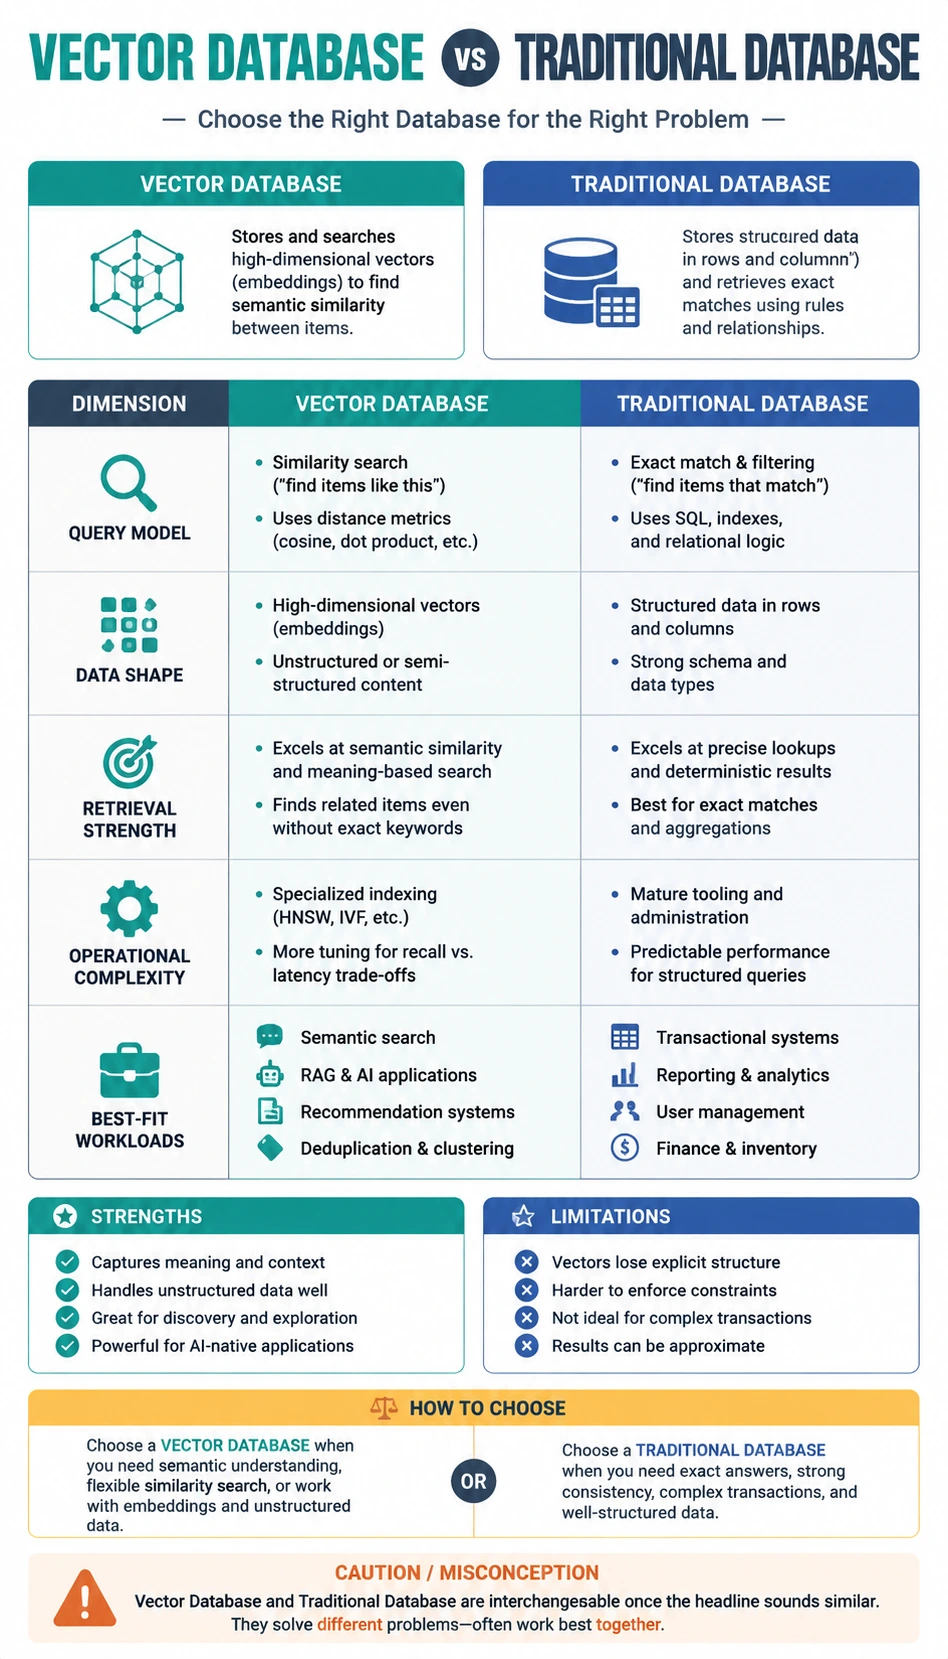
Vector Database vs Traditional Database
A mobile-friendly vector database vs traditional database comparison infographic template with clear trade-offs, use cases, and decision logic.
Open detail page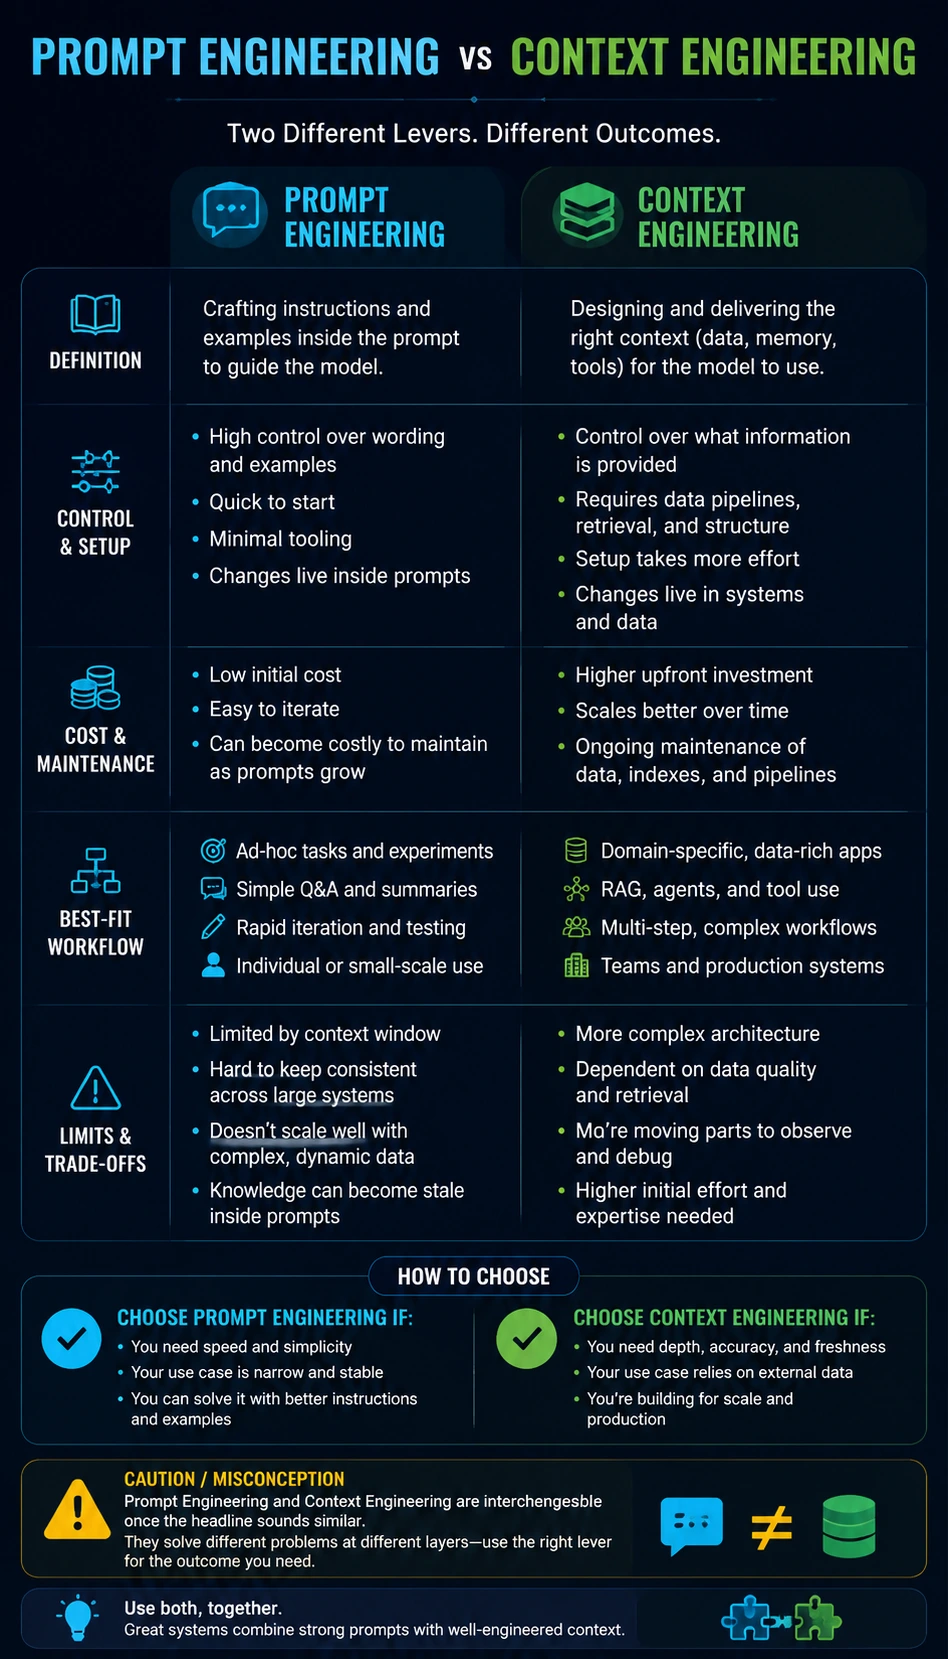
Prompt Engineering vs Context Engineering
A mobile-friendly prompt engineering vs context engineering comparison infographic template with clear trade-offs, use cases, and decision logic.
Open detail pageWhy this category works for search and discovery
These public example pages are built to do more than show an image. Each linked detail page adds a unique title, descriptive copy, image alt text, knowledge points, a create-similar action, and internal links back into the KnowLens example library. That gives both users and search engines a clearer understanding of what each visual covers.