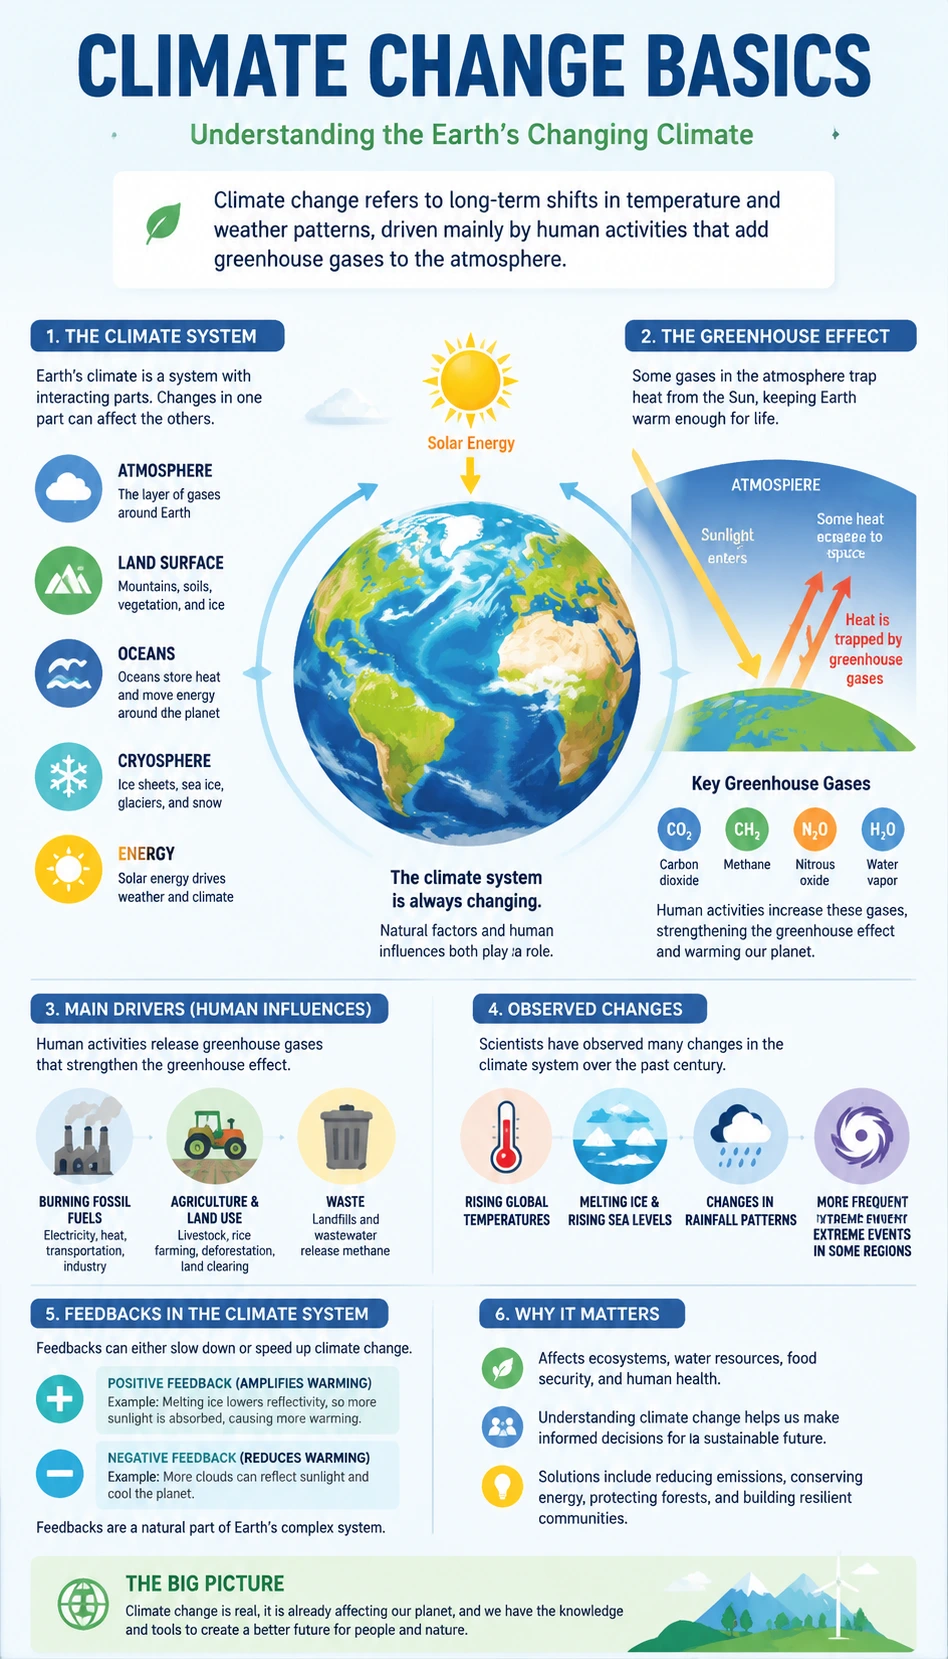
About this earth science infographic
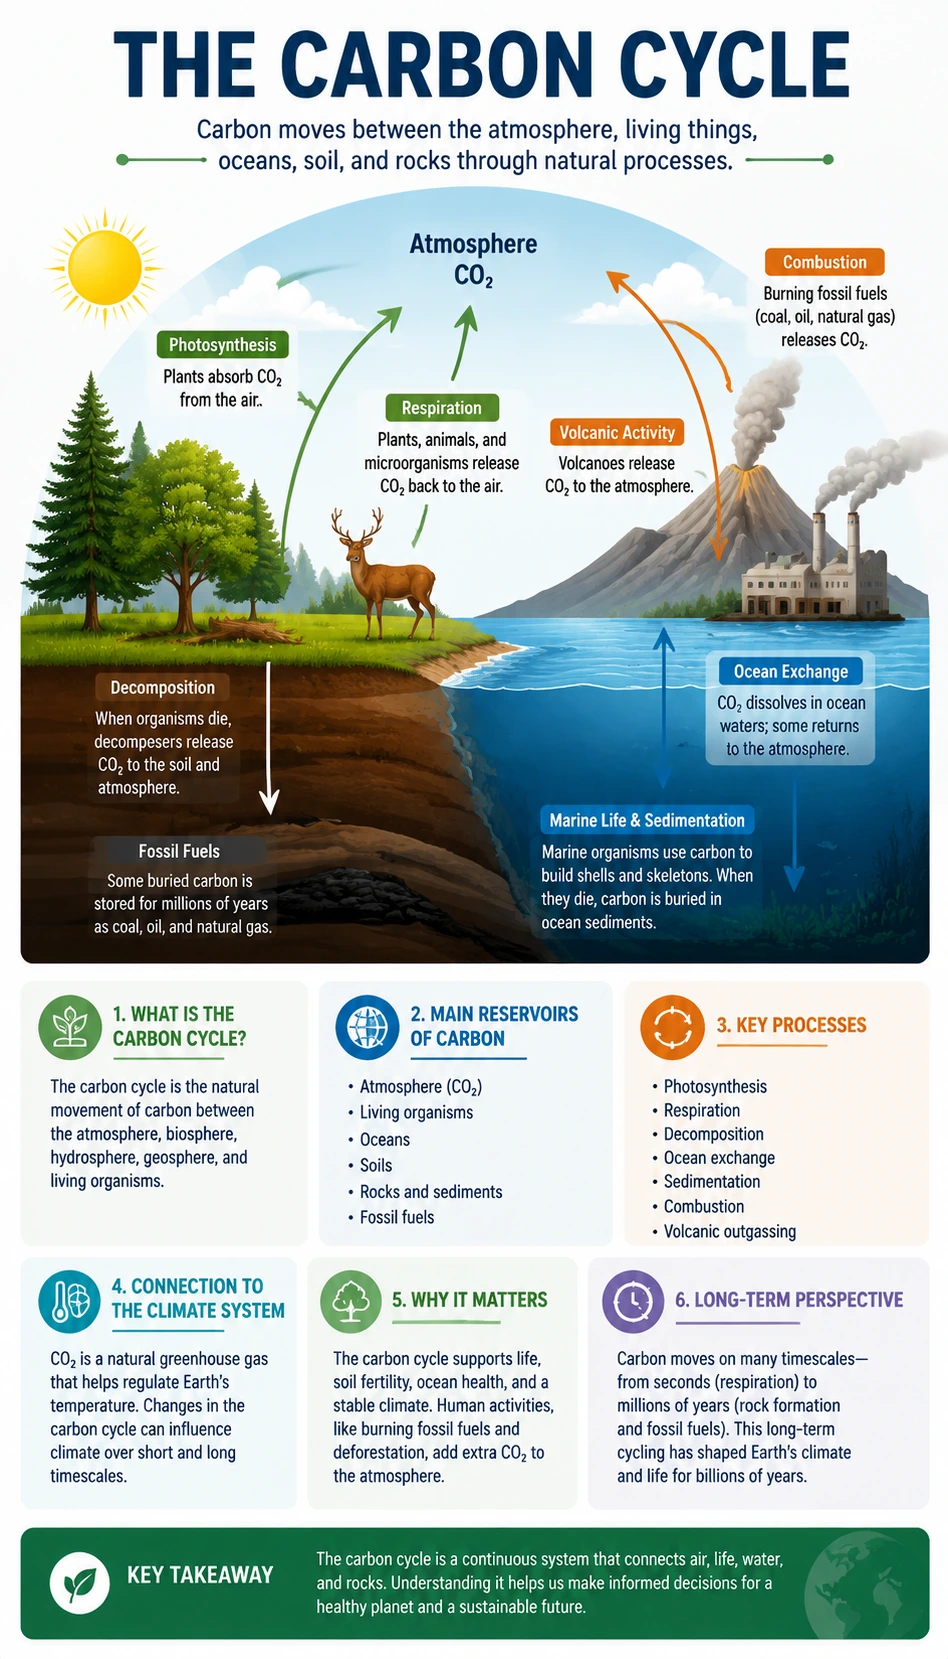
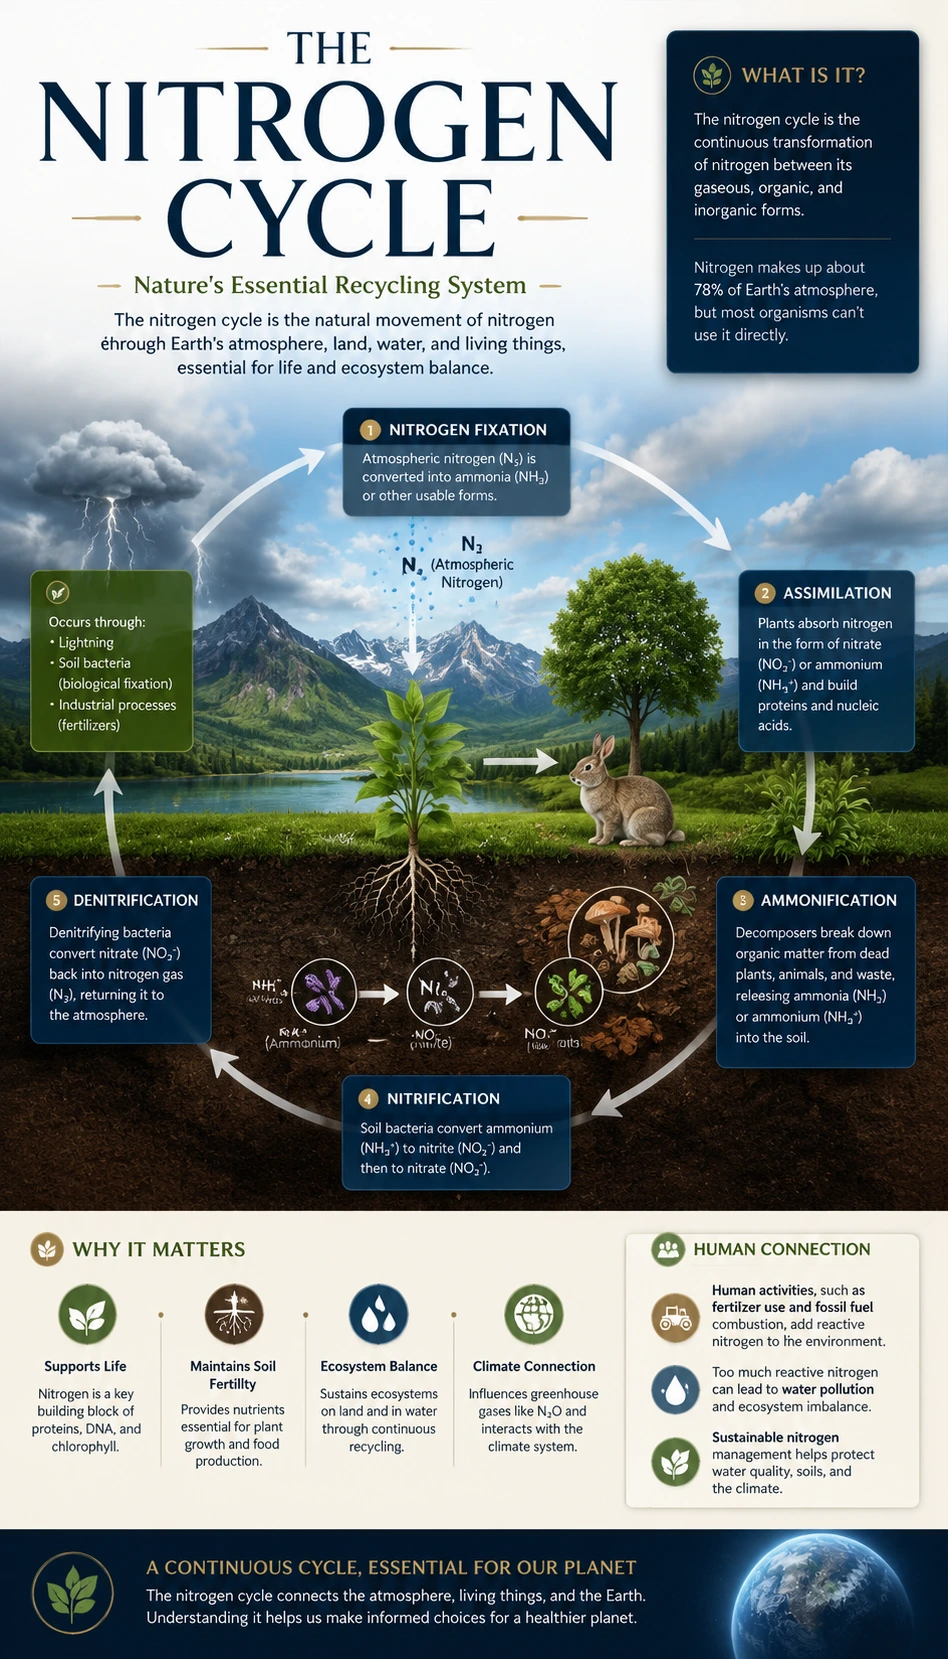
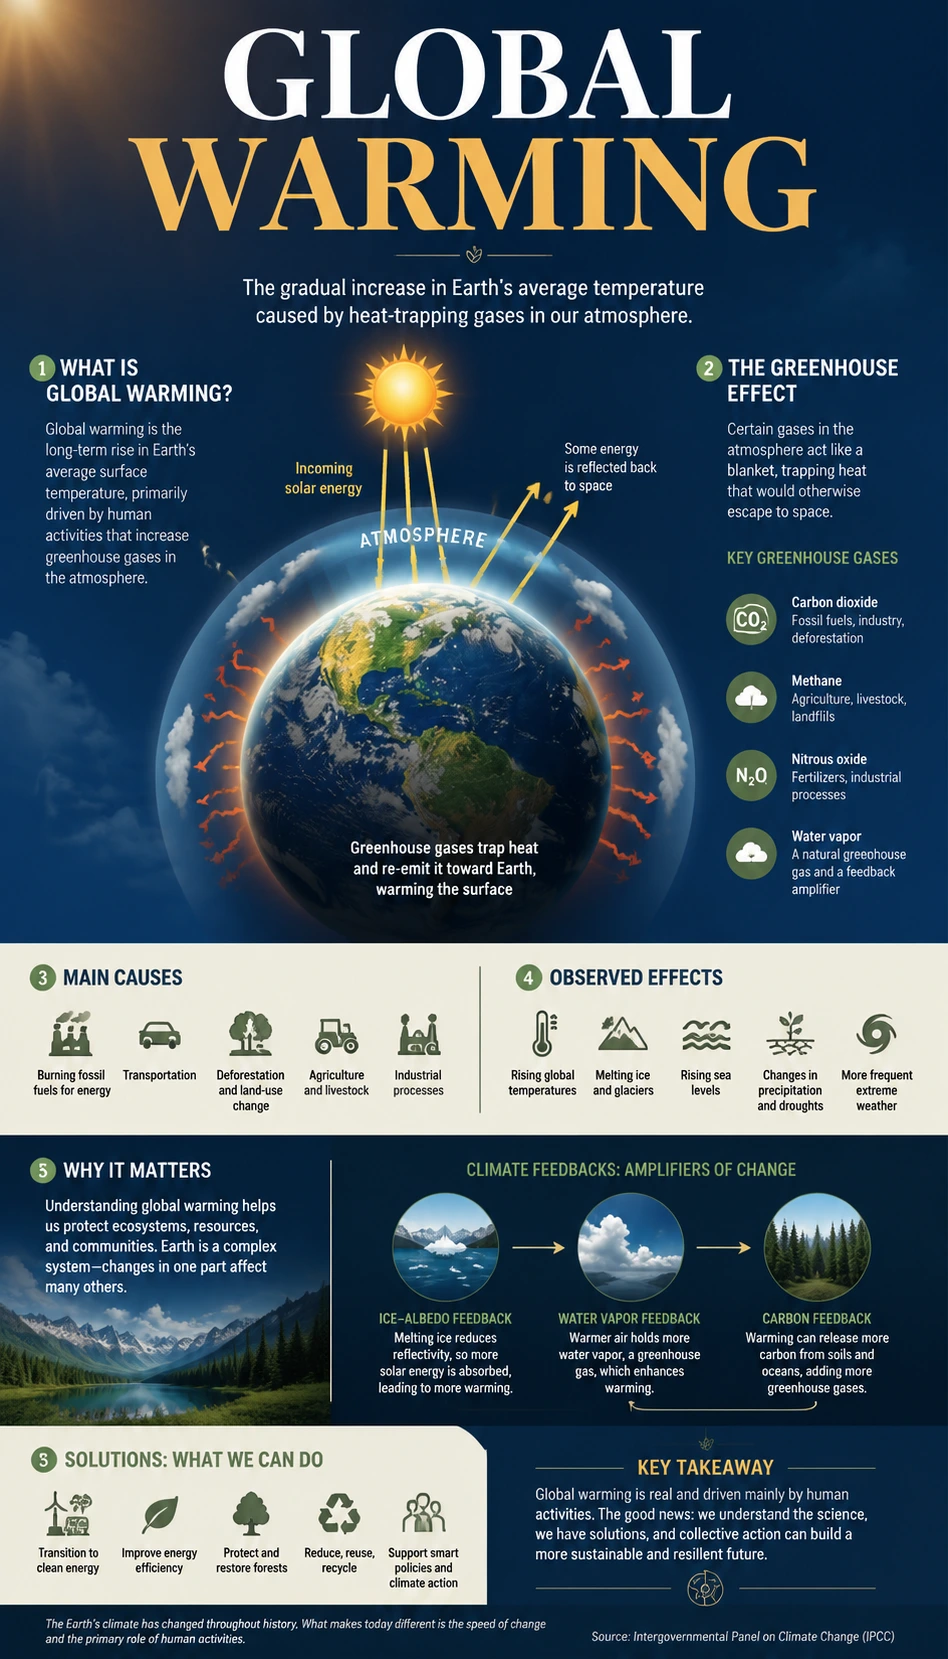
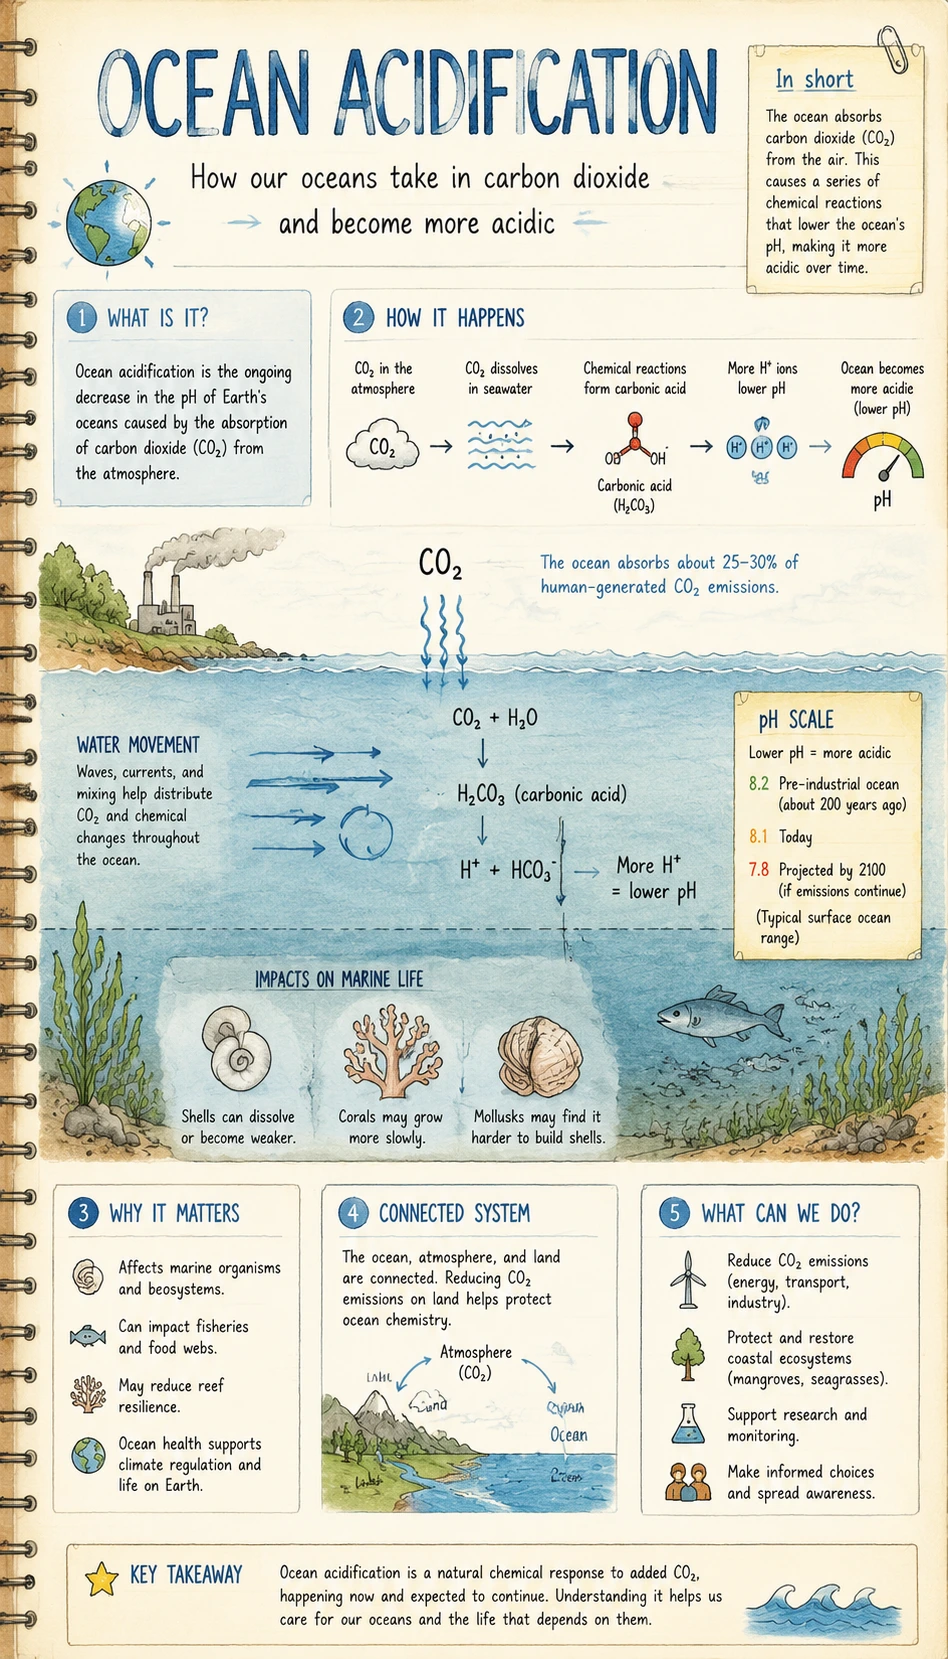
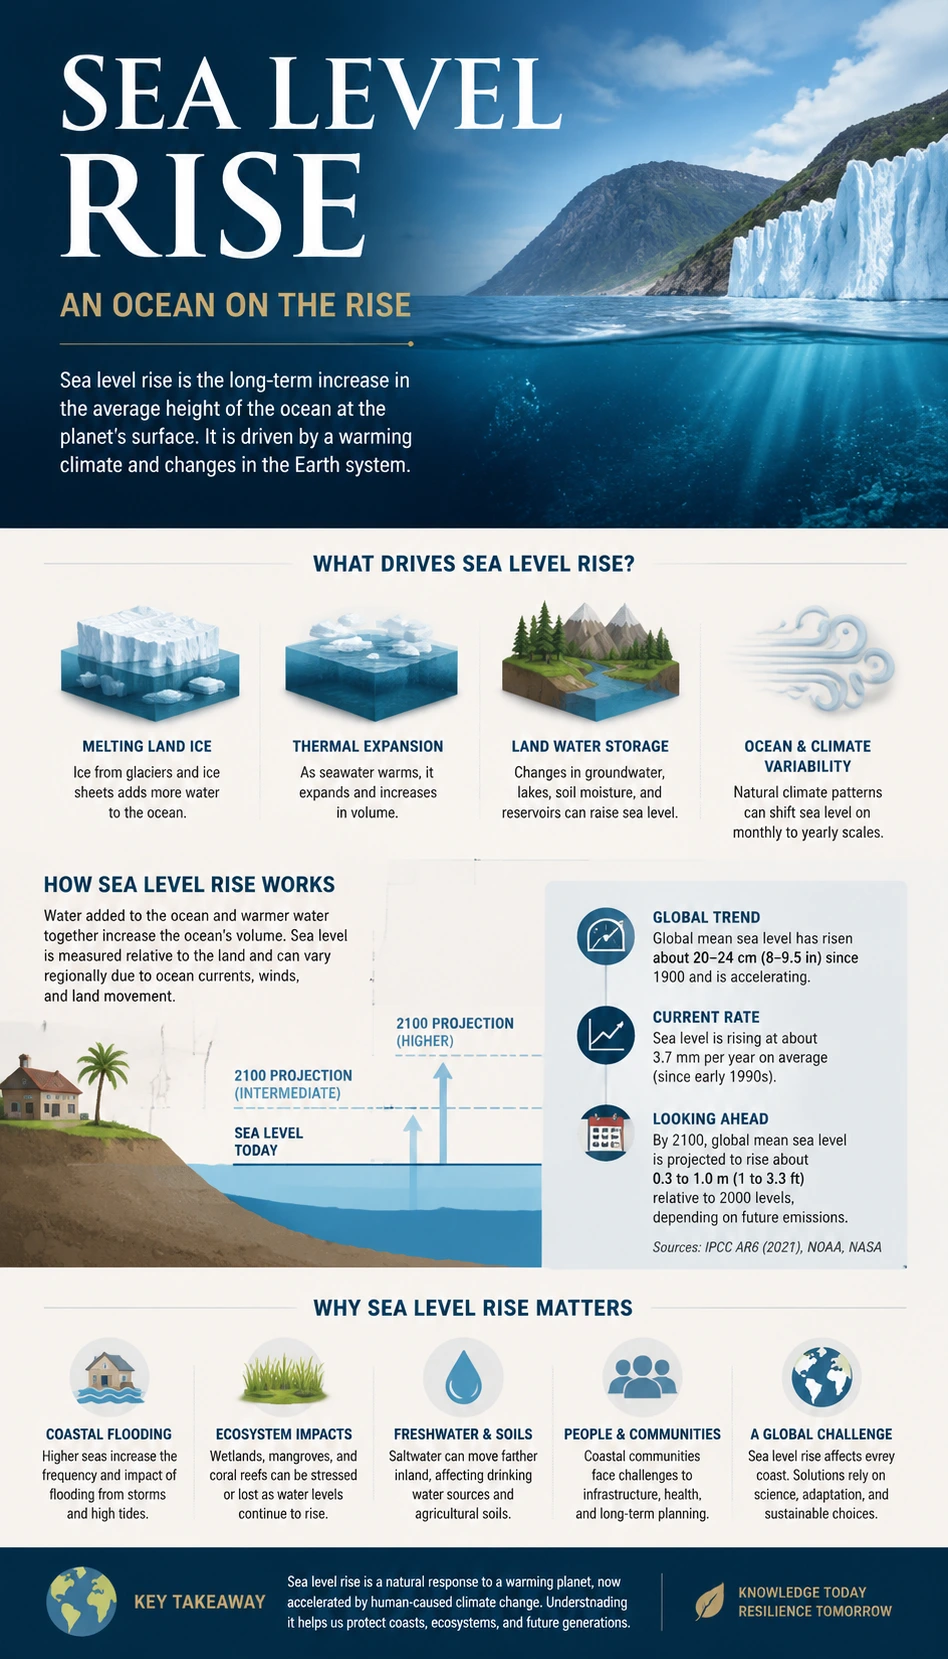
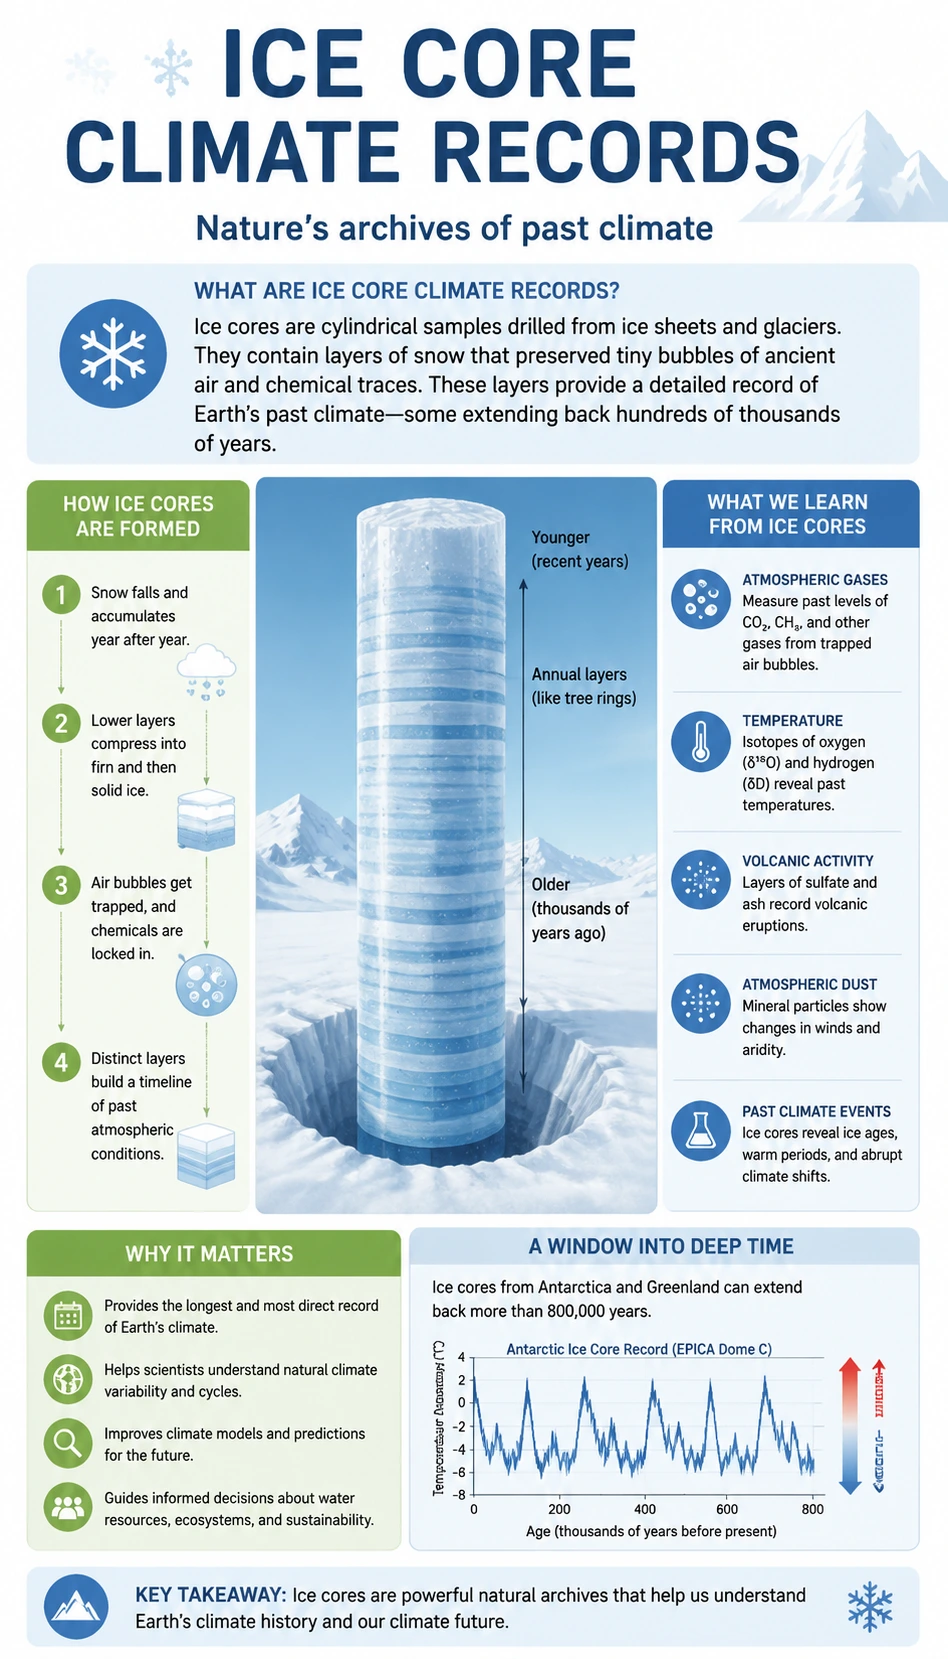
This climate change basics infographic template explains the earth science concept in a clear visual format for students, teachers, science creators, and education teams. It organizes key structures, processes, relationships, labels, and learning takeaways into concise English sections for easy visual understanding.