REPORT INSIGHT LIBRARY
Financial Report Infographic Examples
Financial report infographic examples help compress earnings metrics, market context, key drivers, and summary takeaways into a cleaner structure. These pages focus on business readability and mobile-friendly report visuals.
Open investor-facing visuals for earnings, market drivers, and financial insight summaries.
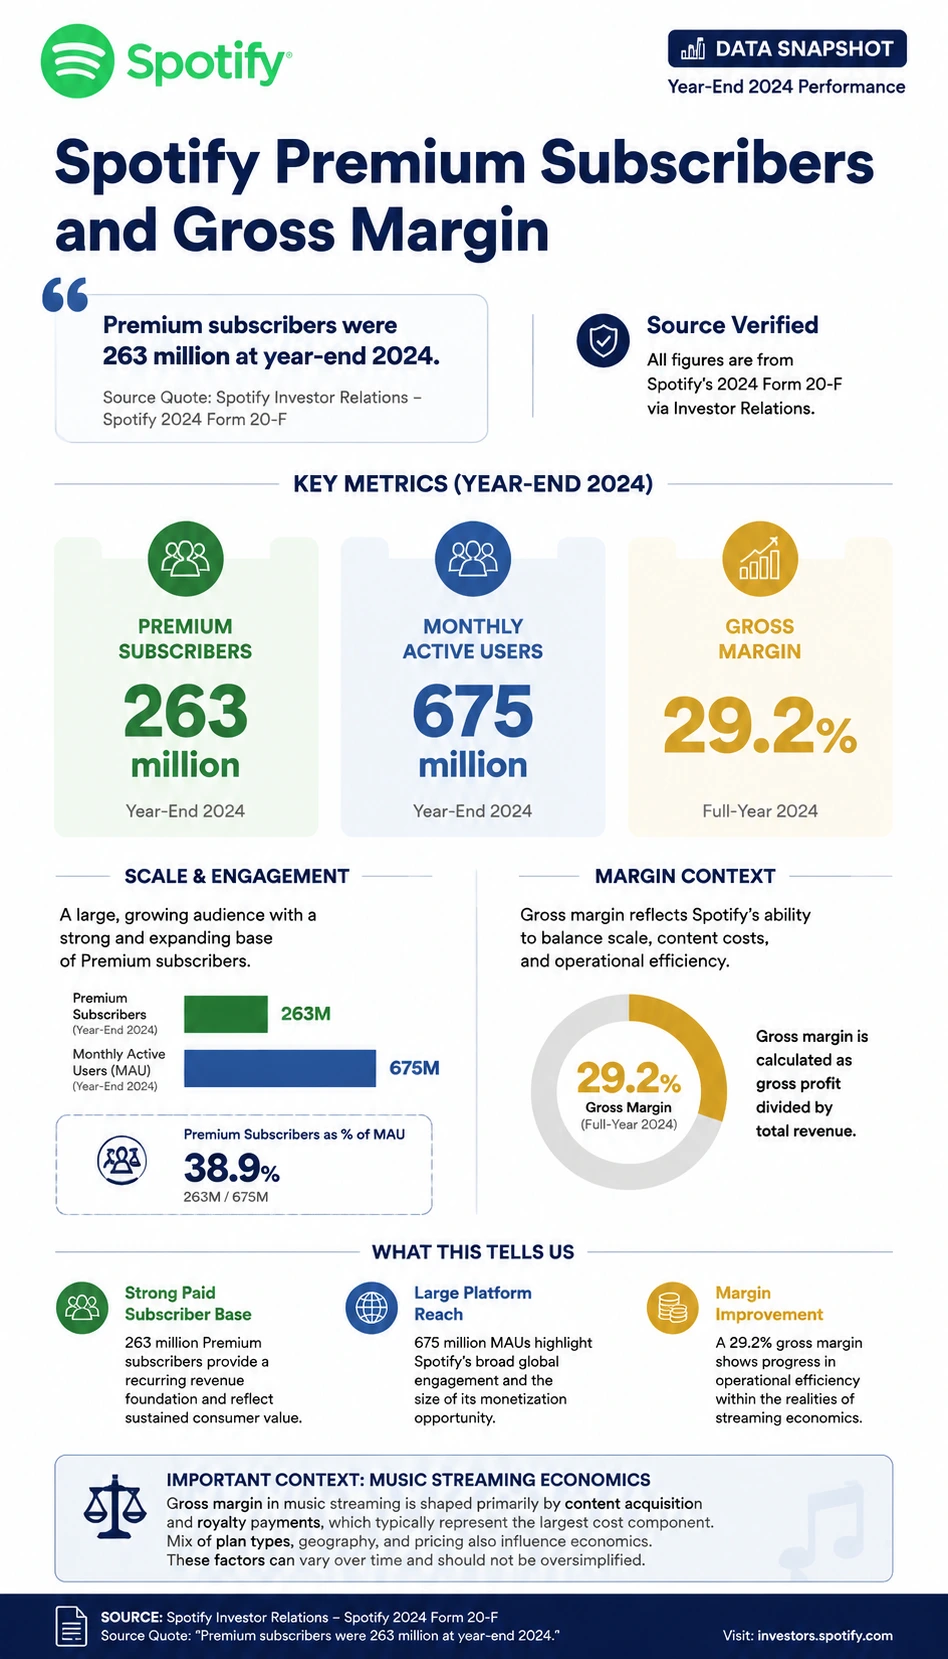
Spotify Premium Subscribers and Gross Margin
A source-backed spotify premium subscribers and gross margin infographic template for earnings and market report learning.
Open detail page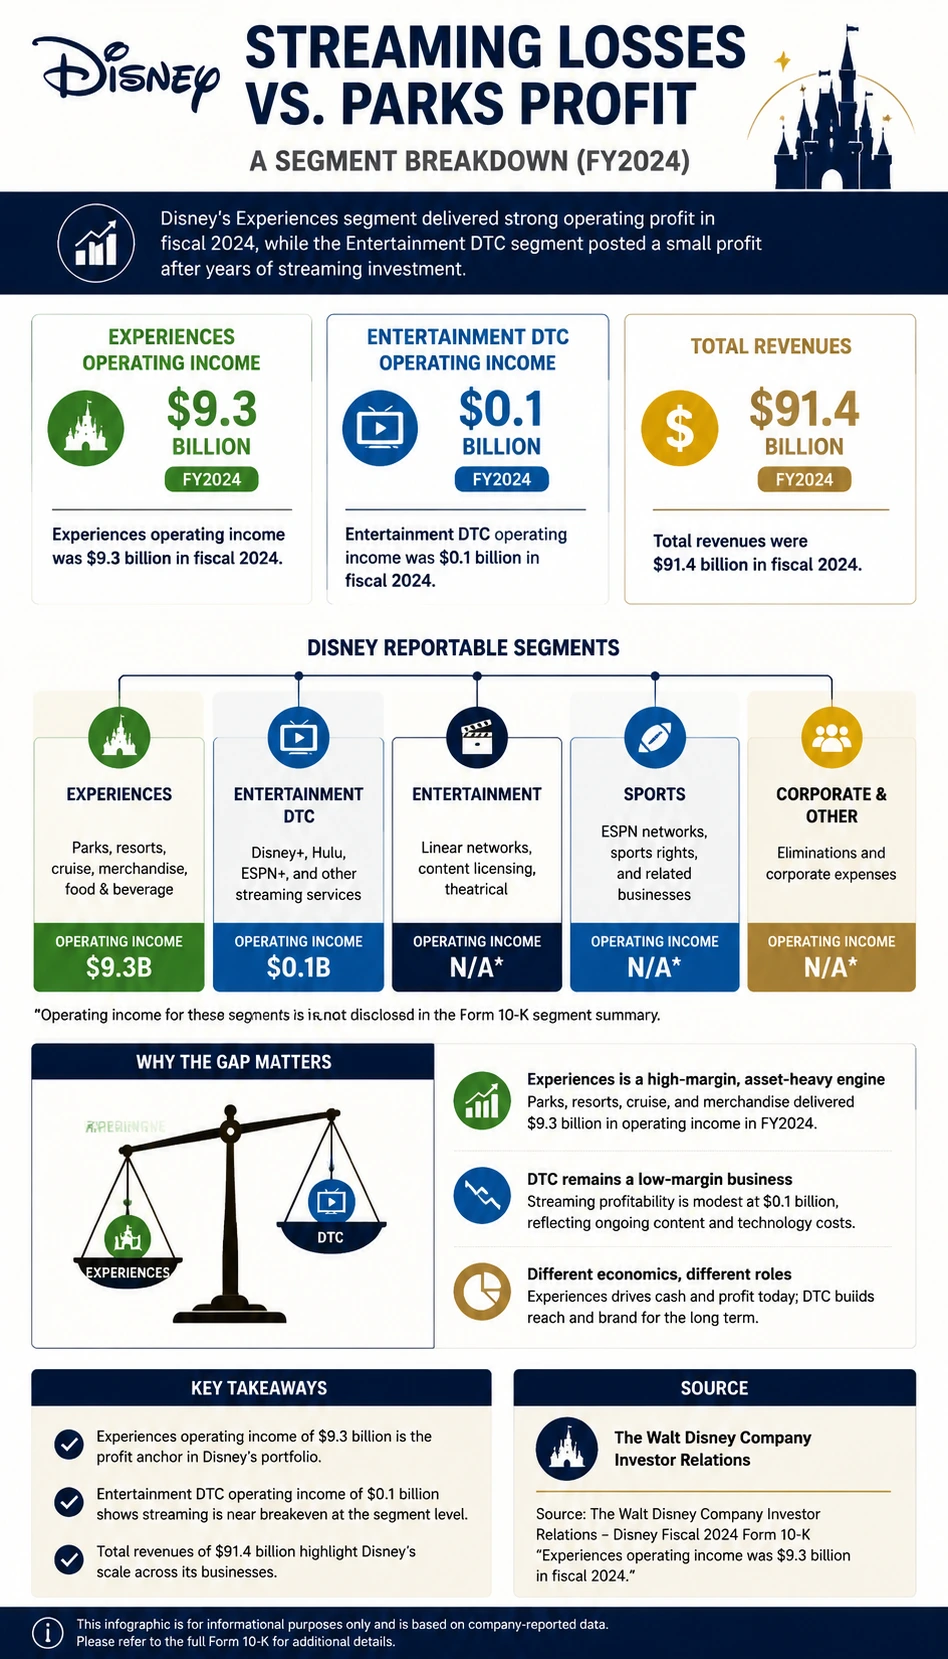
Disney Streaming Losses vs Parks Profit
A source-backed disney streaming losses vs parks profit infographic template for earnings and market report learning.
Open detail page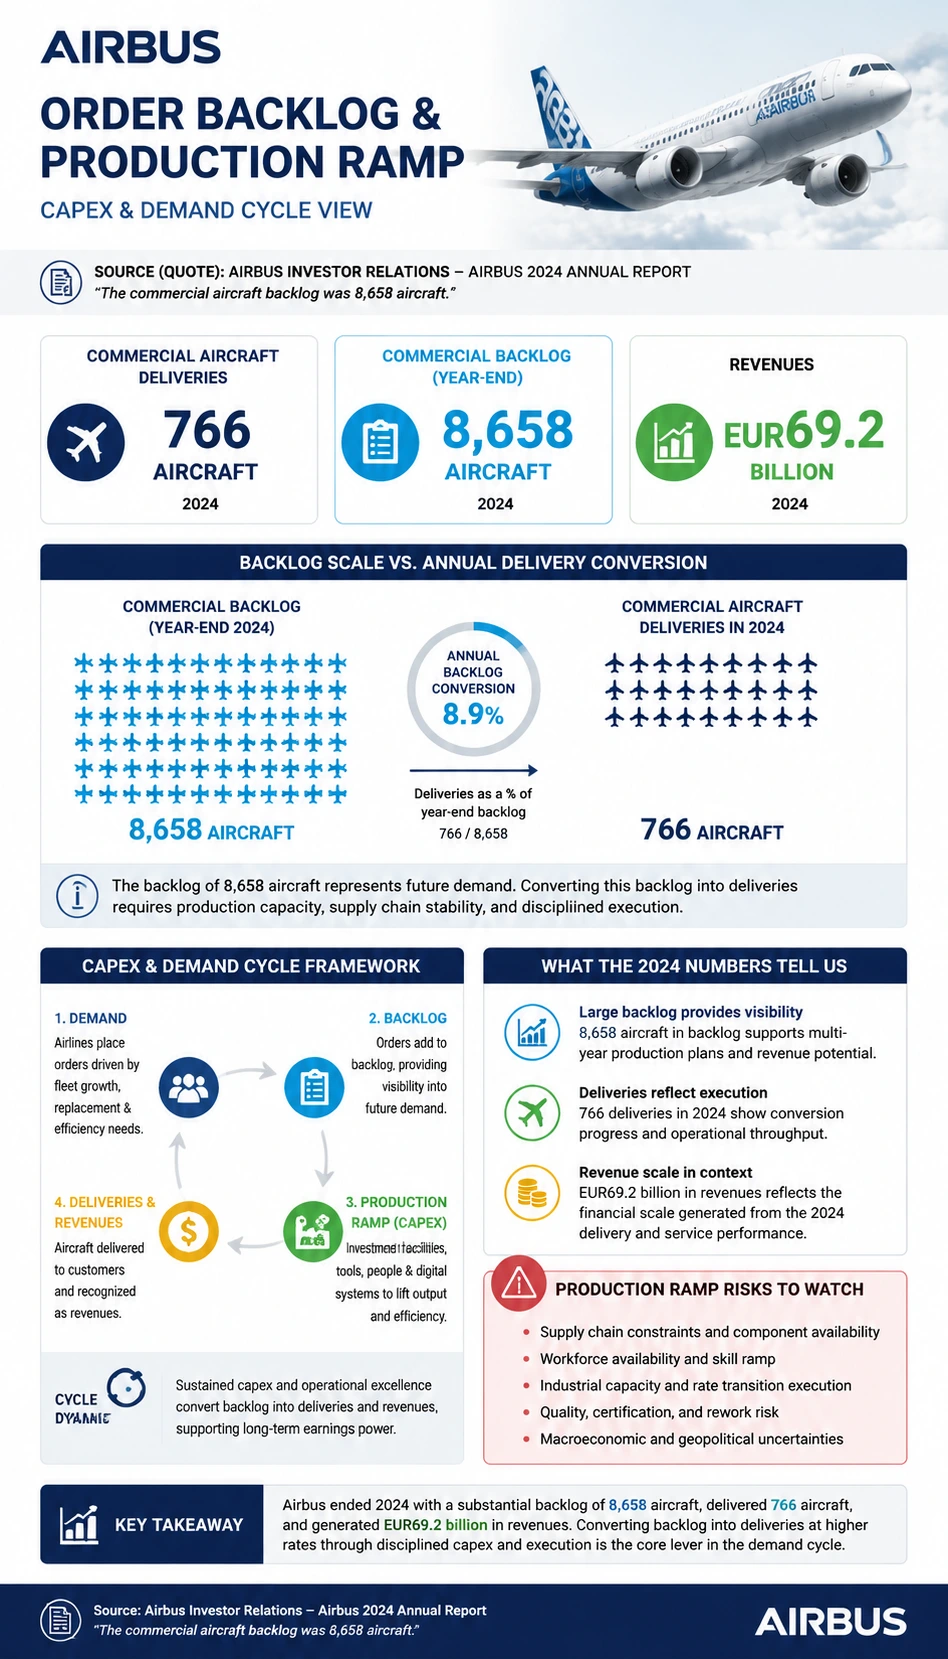
Airbus Order Backlog and Production Ramp
A source-backed airbus order backlog and production ramp infographic template for earnings and market report learning.
Open detail page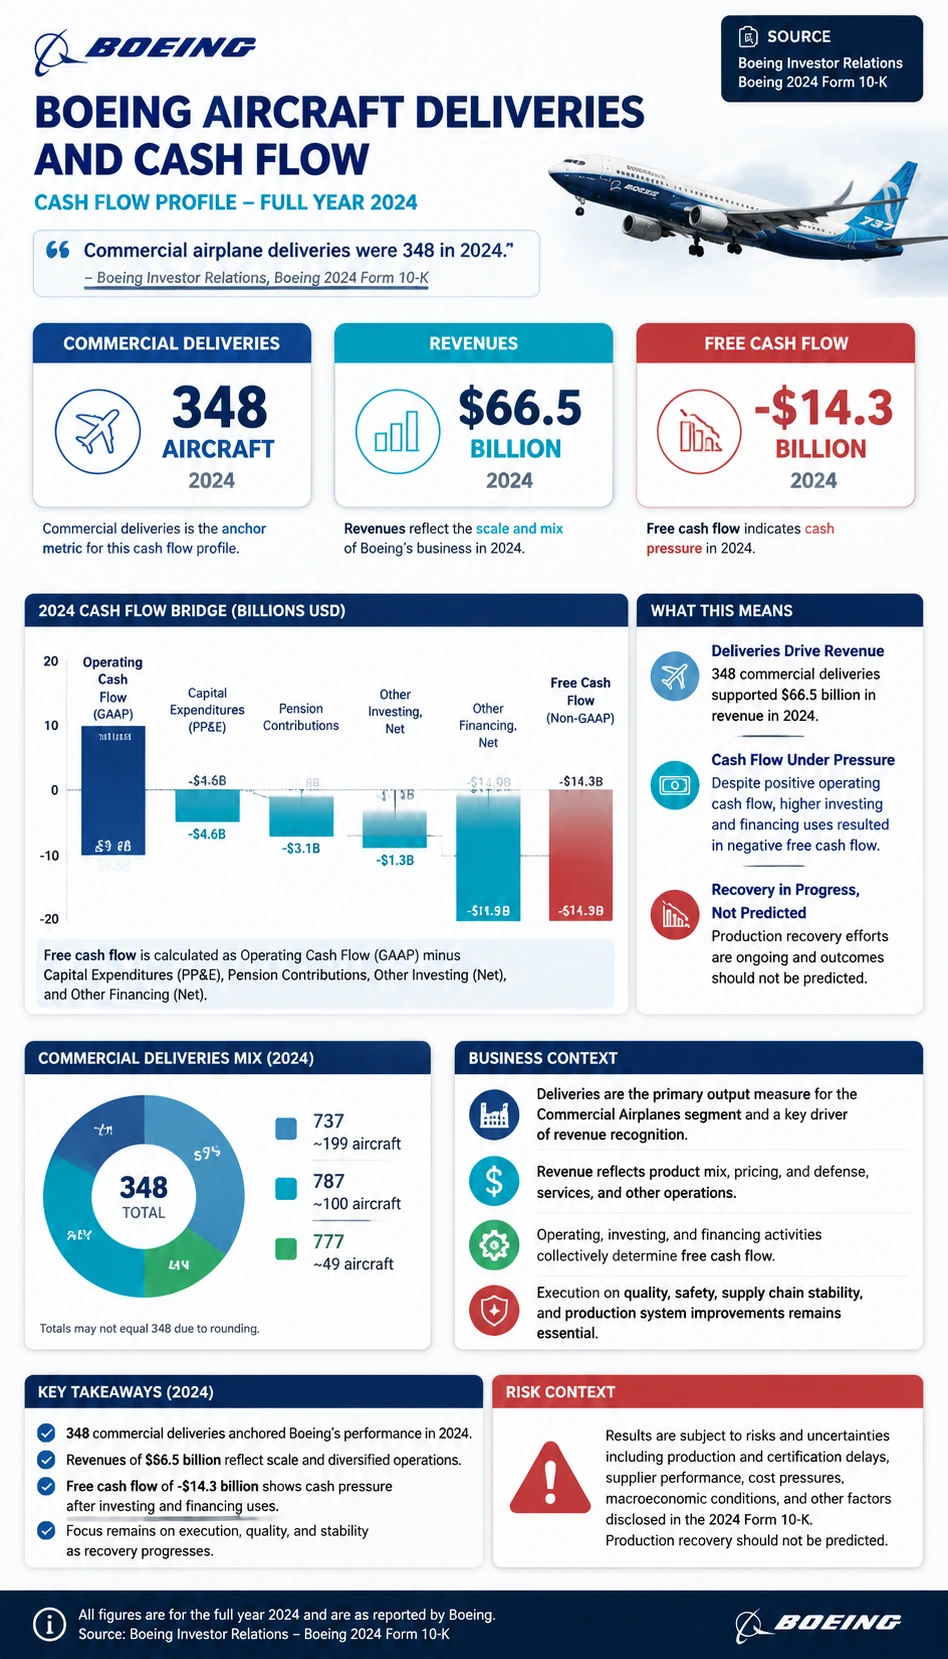
Boeing Aircraft Deliveries and Cash Flow
A source-backed boeing aircraft deliveries and cash flow infographic template for earnings and market report learning.
Open detail page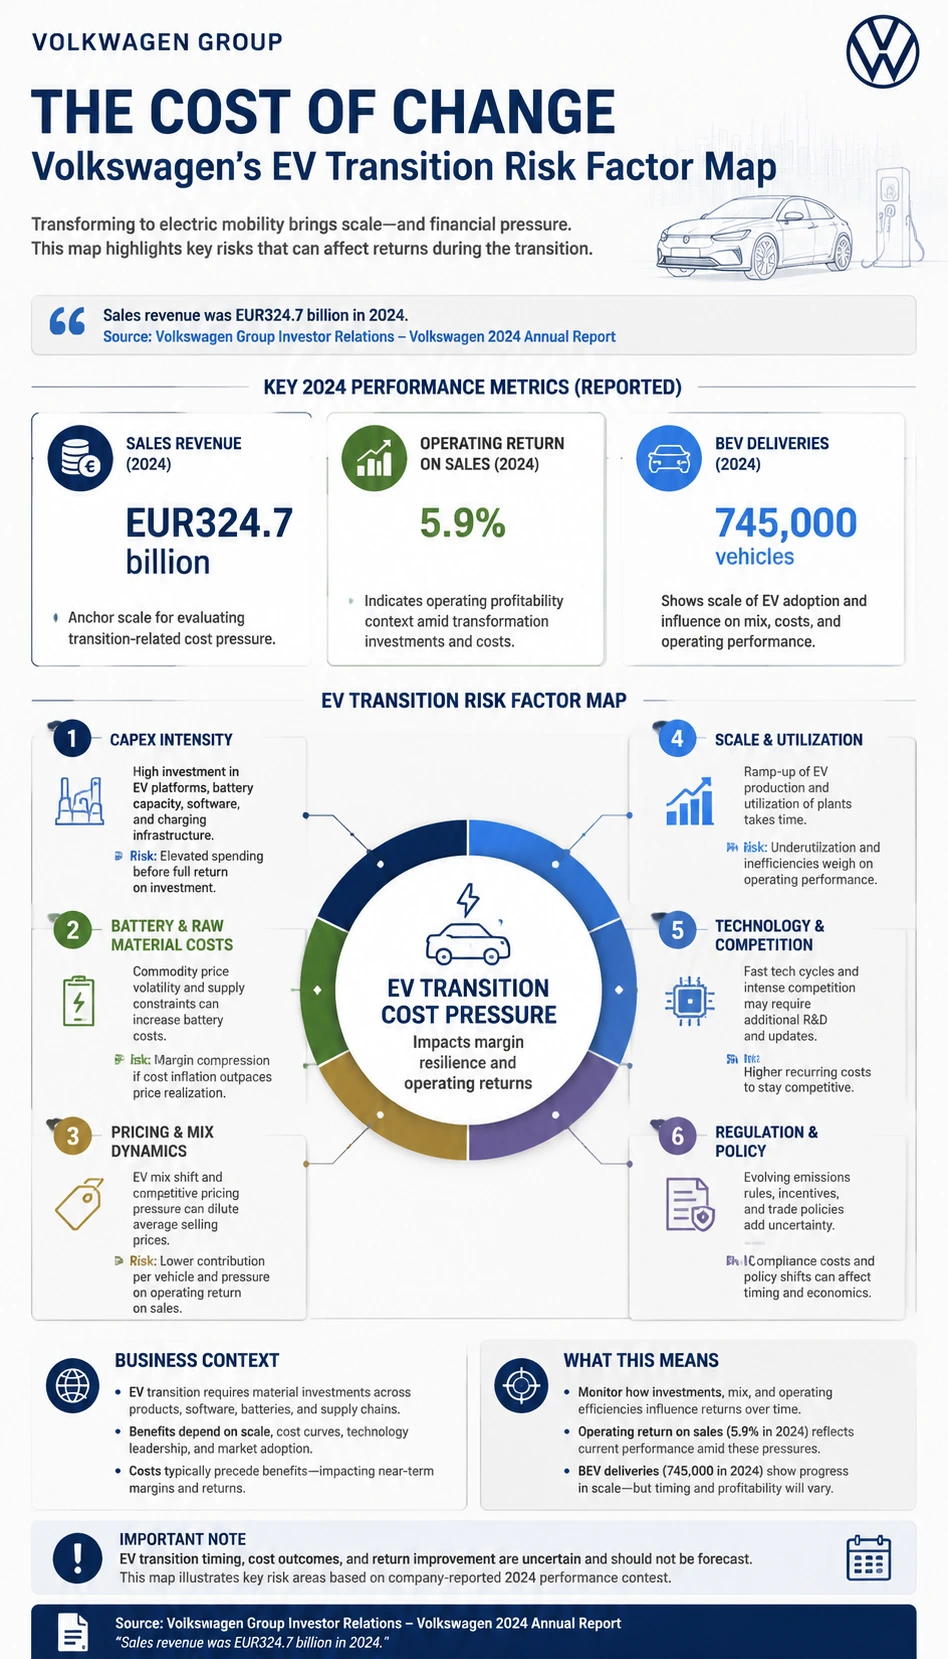
Volkswagen EV Transition Cost
A source-backed volkswagen ev transition cost infographic template for earnings and market report learning.
Open detail page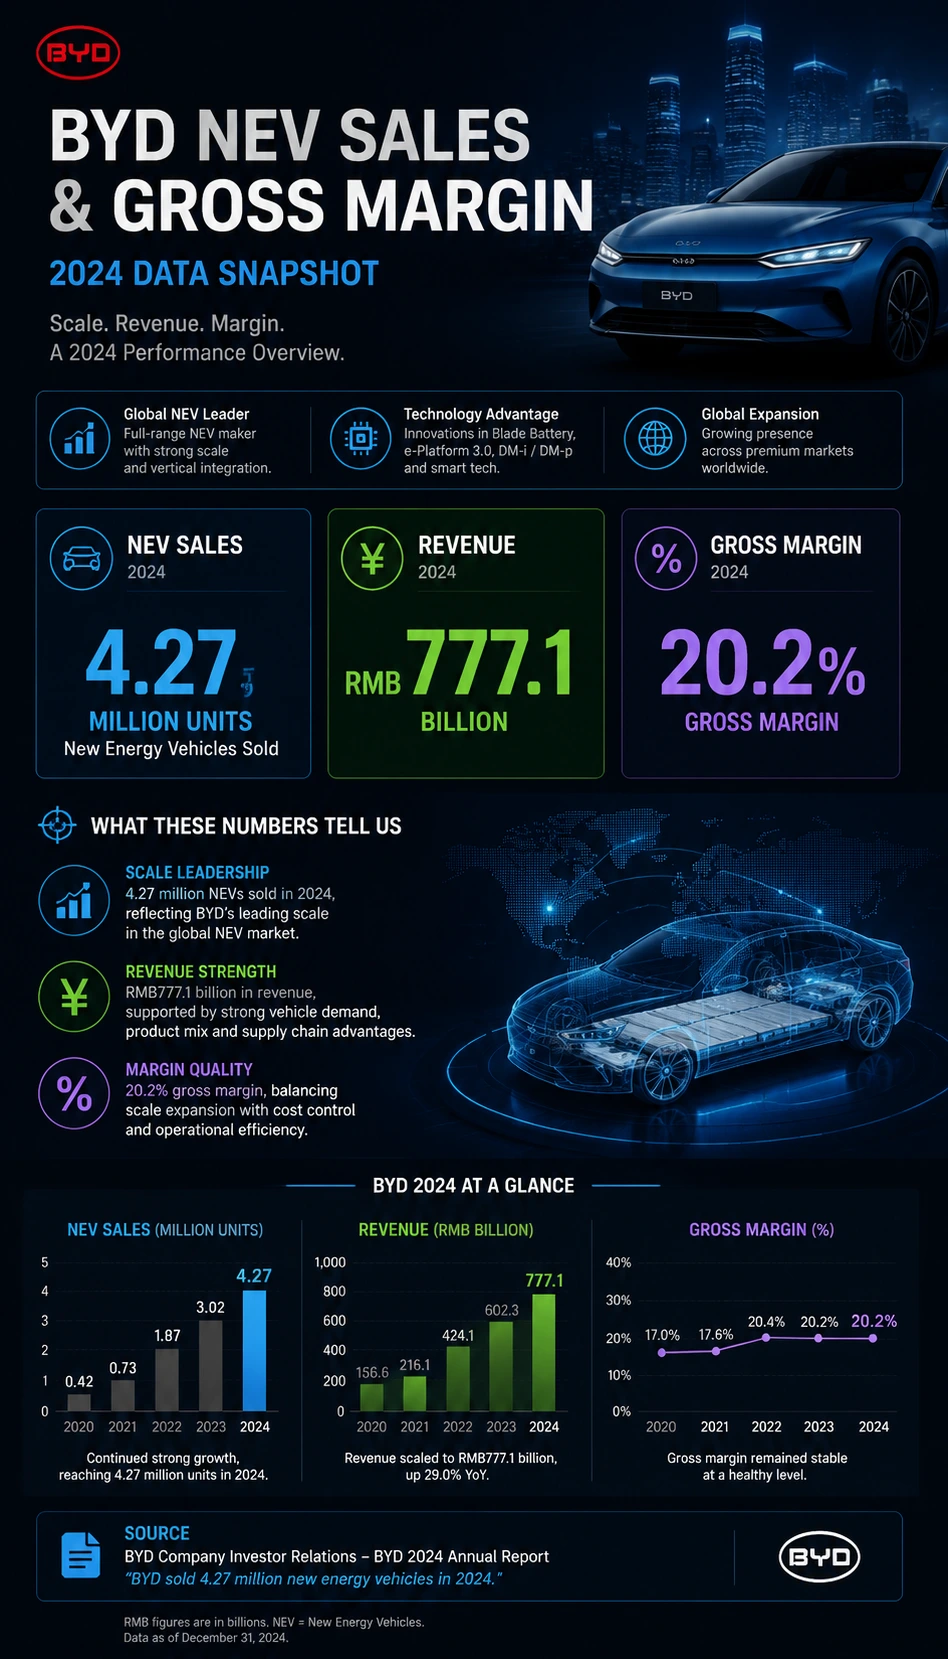
BYD NEV Sales and Gross Margin
A source-backed byd nev sales and gross margin infographic template for earnings and market report learning.
Open detail page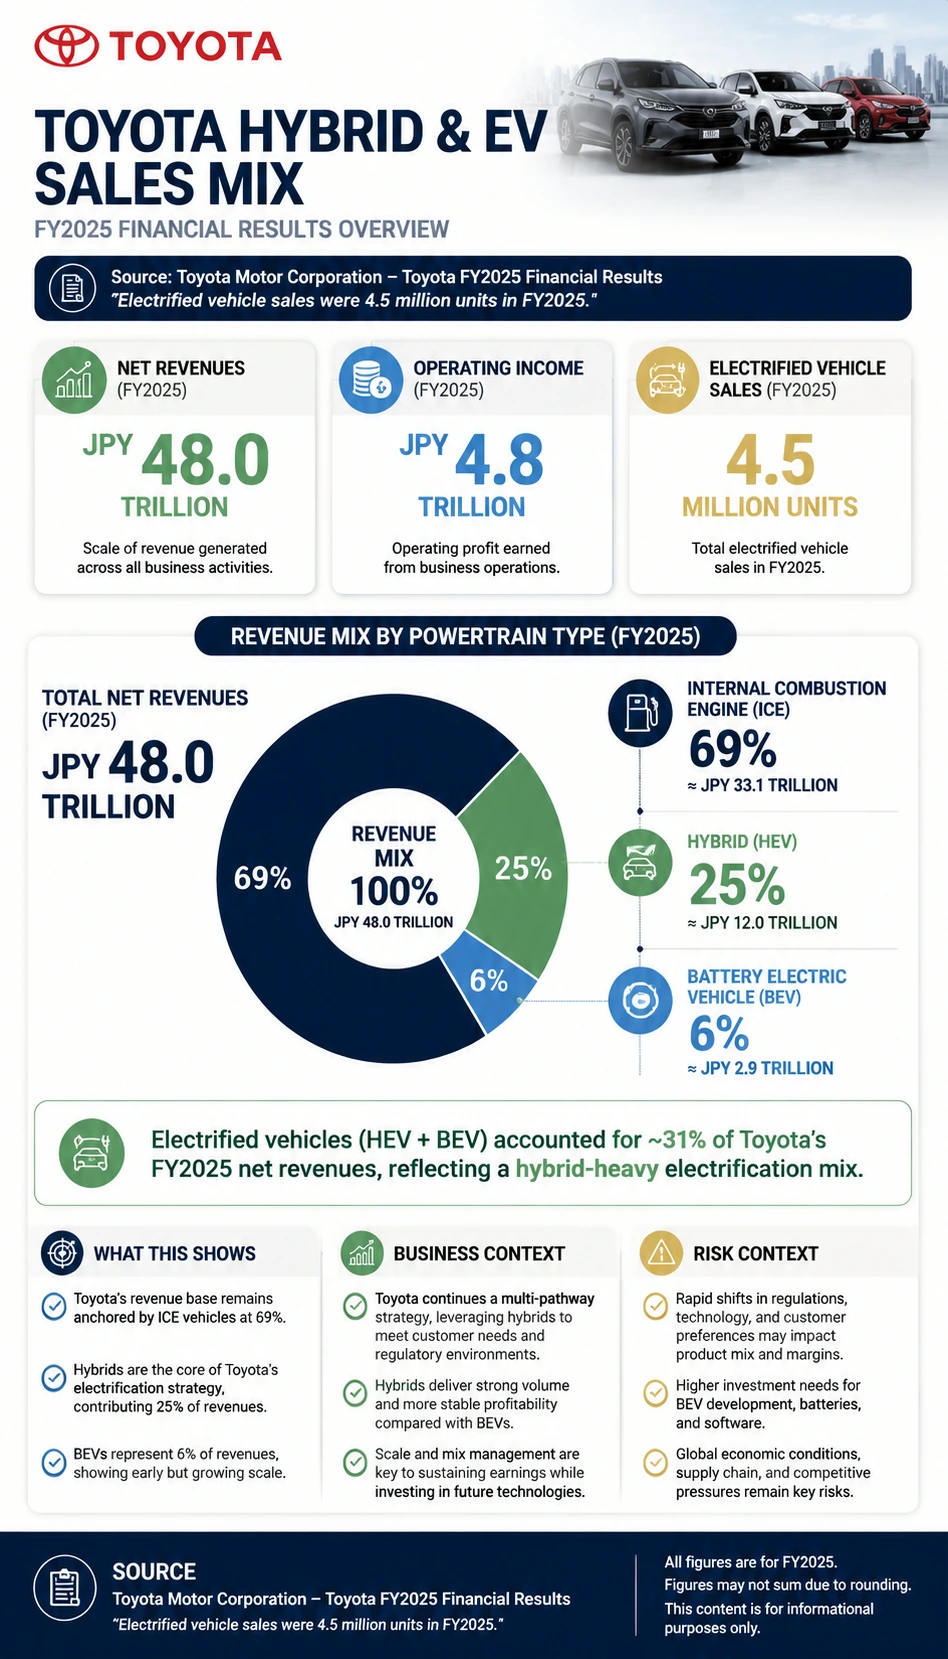
Toyota Hybrid and EV Sales Mix
A source-backed toyota hybrid and ev sales mix infographic template for earnings and market report learning.
Open detail page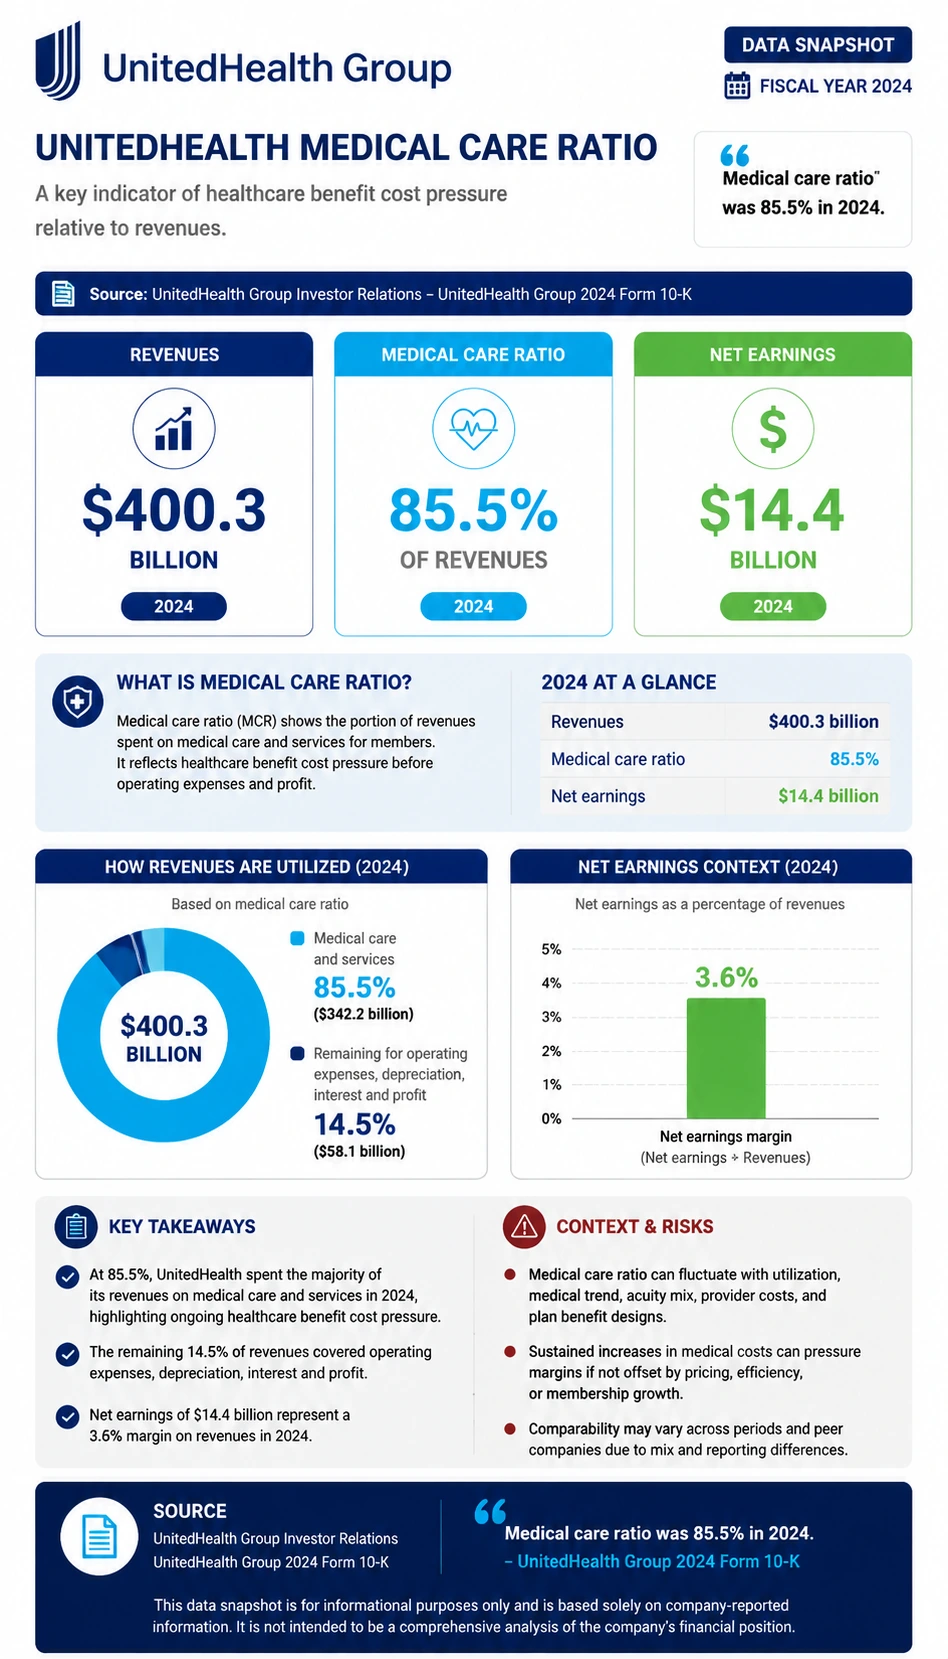
UnitedHealth Medical Care Ratio
A source-backed unitedhealth medical care ratio infographic template for earnings and market report learning.
Open detail page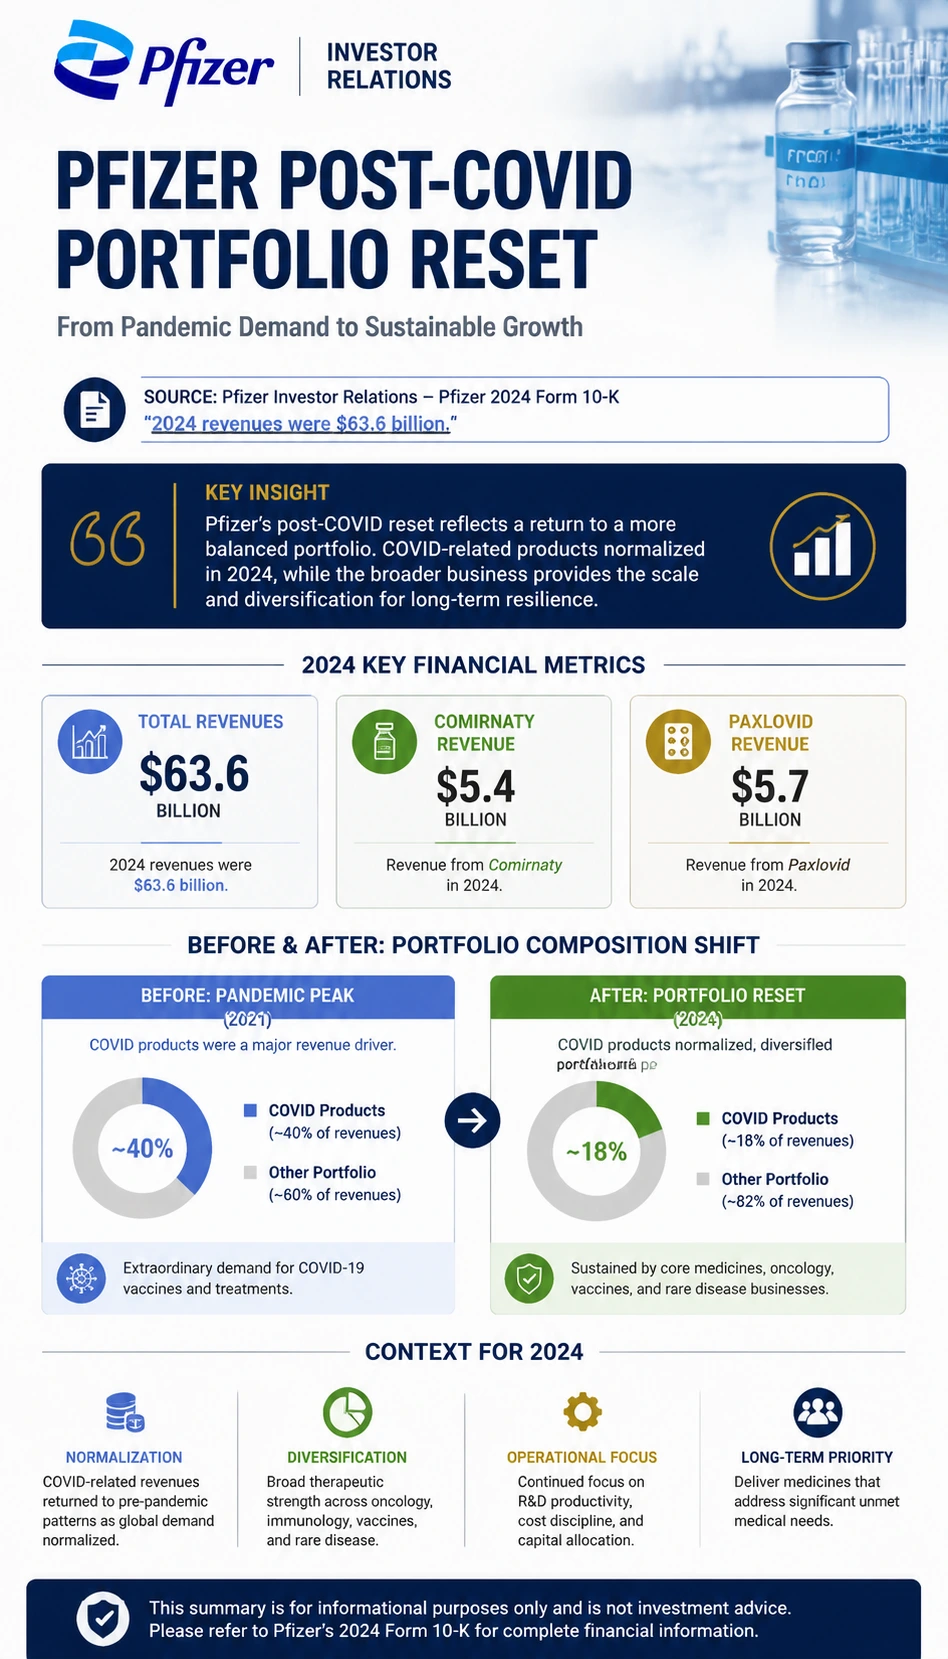
Pfizer Post-COVID Portfolio Reset
A source-backed pfizer post-covid portfolio reset infographic template for earnings and market report learning.
Open detail page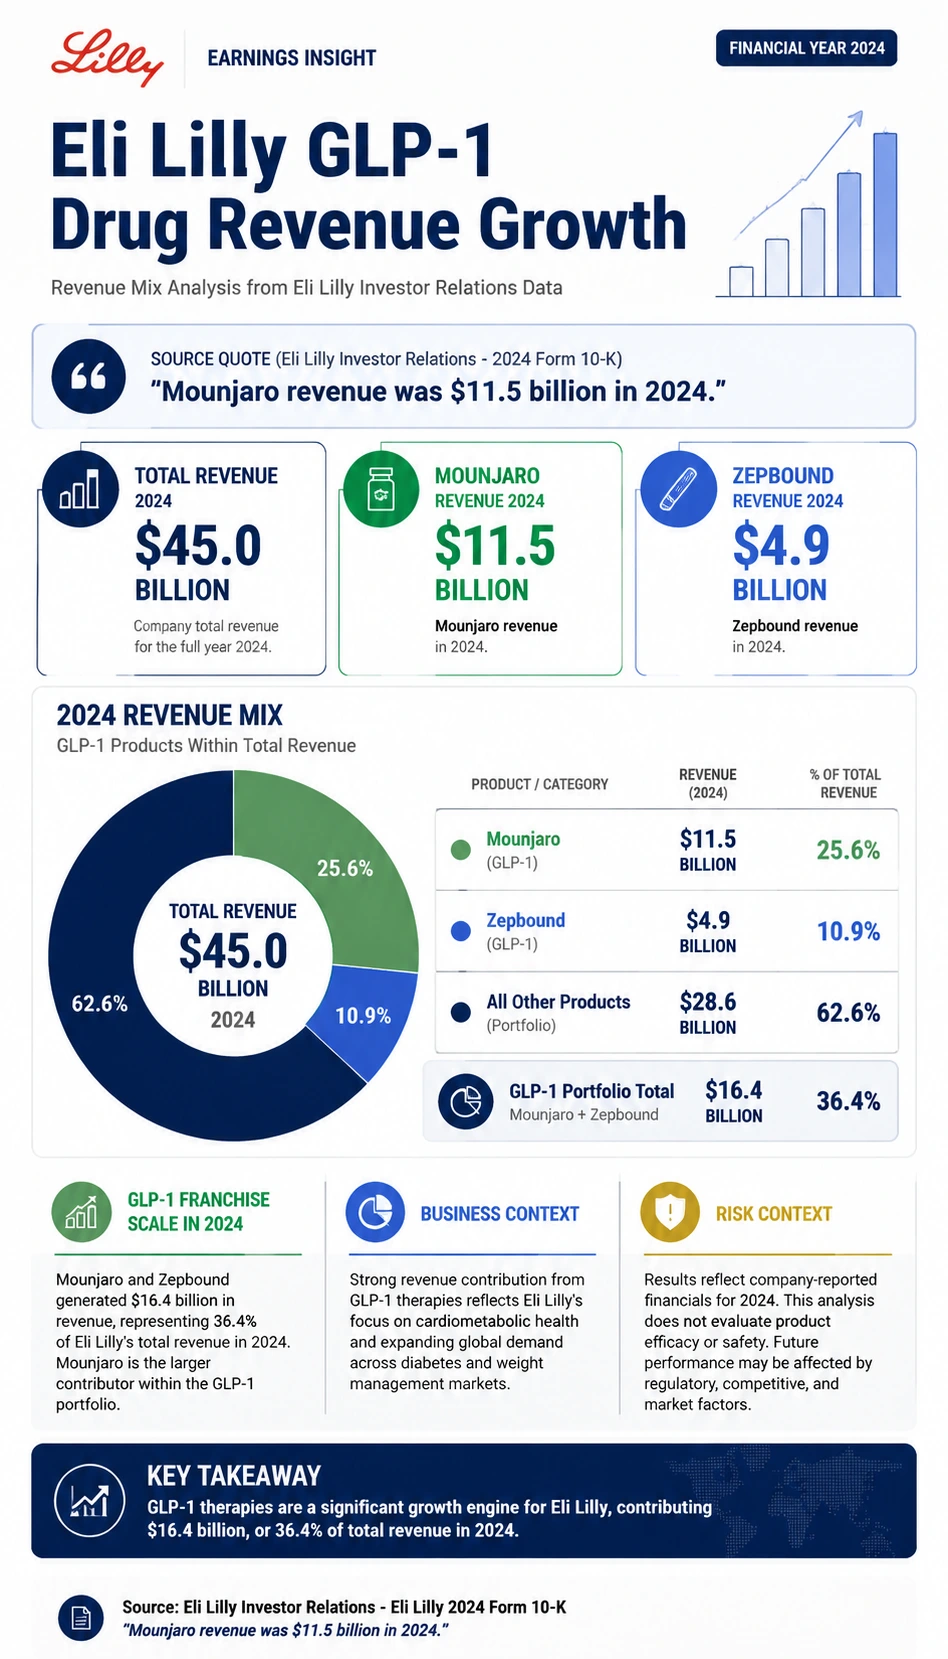
Eli Lilly GLP-1 Drug Revenue Growth
A source-backed eli lilly glp-1 drug revenue growth infographic template for earnings and market report learning.
Open detail page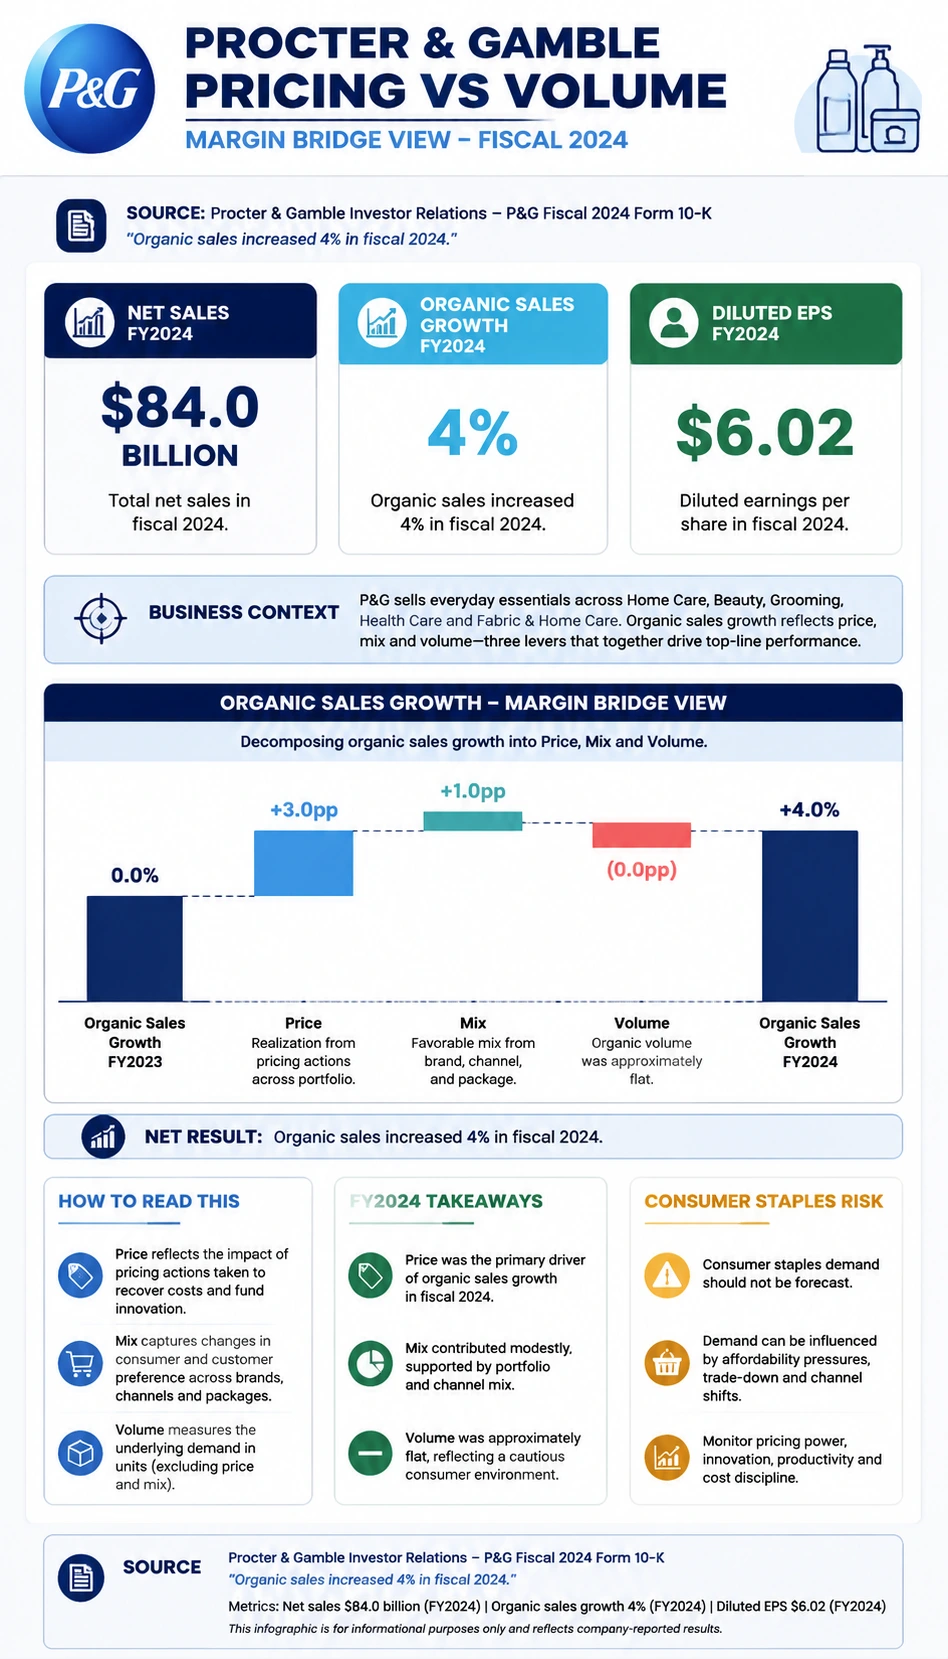
Procter and Gamble Pricing vs Volume
A source-backed procter and gamble pricing vs volume infographic template for earnings and market report learning.
Open detail page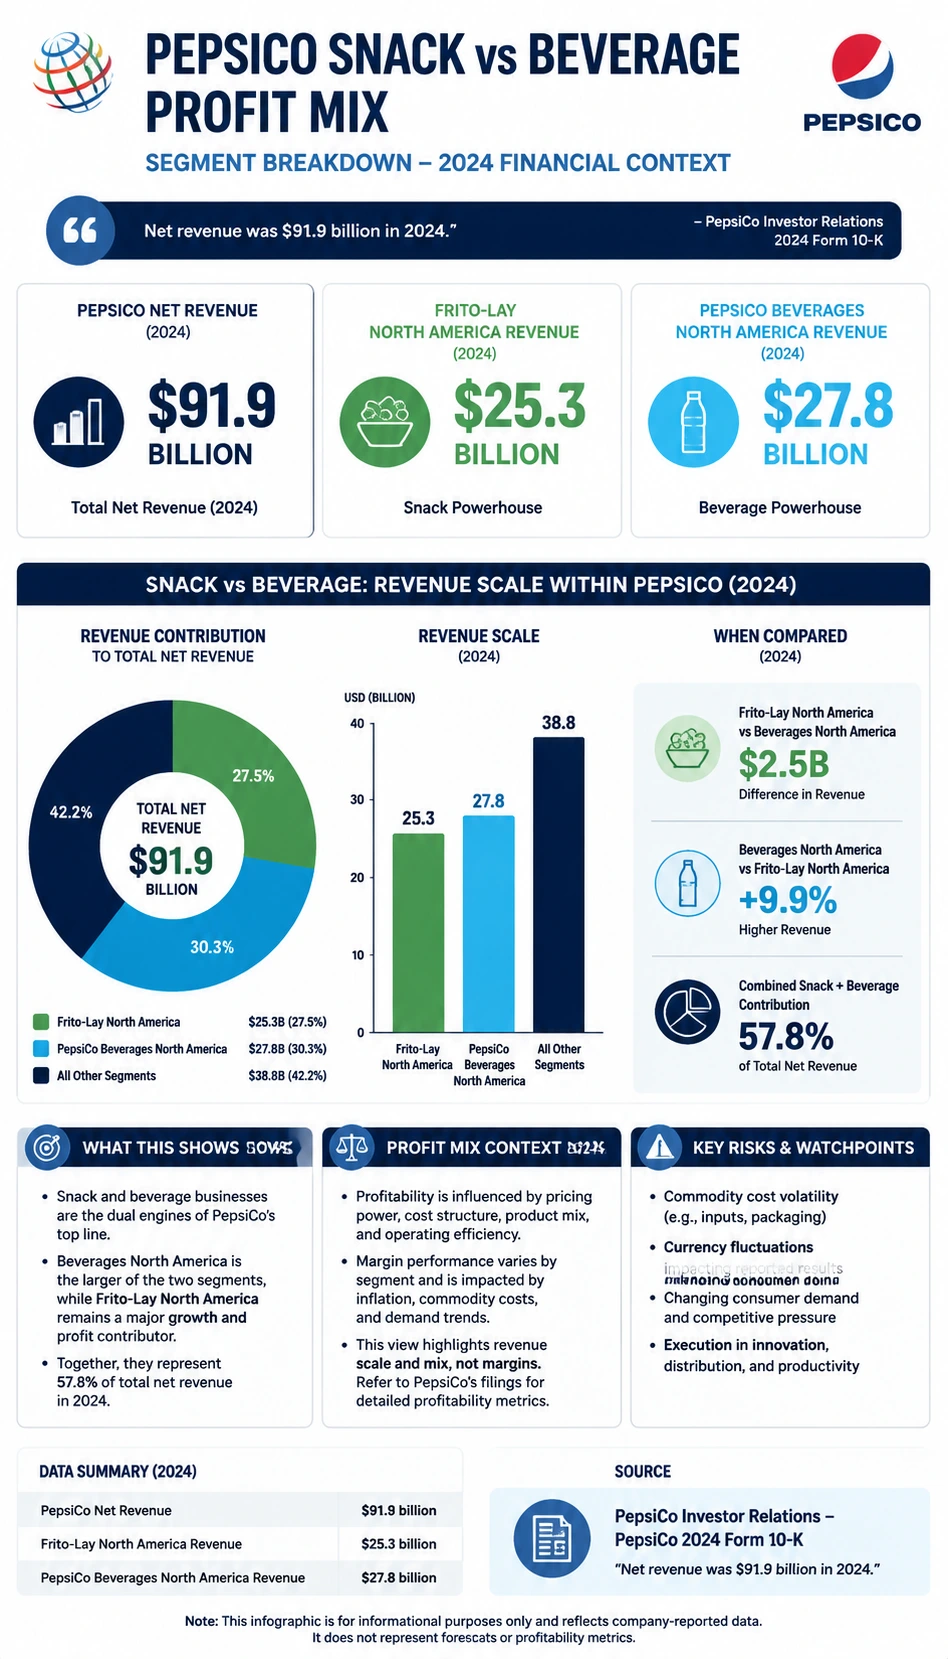
PepsiCo Snack vs Beverage Profit Mix
A source-backed pepsico snack vs beverage profit mix infographic template for earnings and market report learning.
Open detail page
Coca-Cola Organic Revenue Growth
A source-backed coca-cola organic revenue growth infographic template for earnings and market report learning.
Open detail page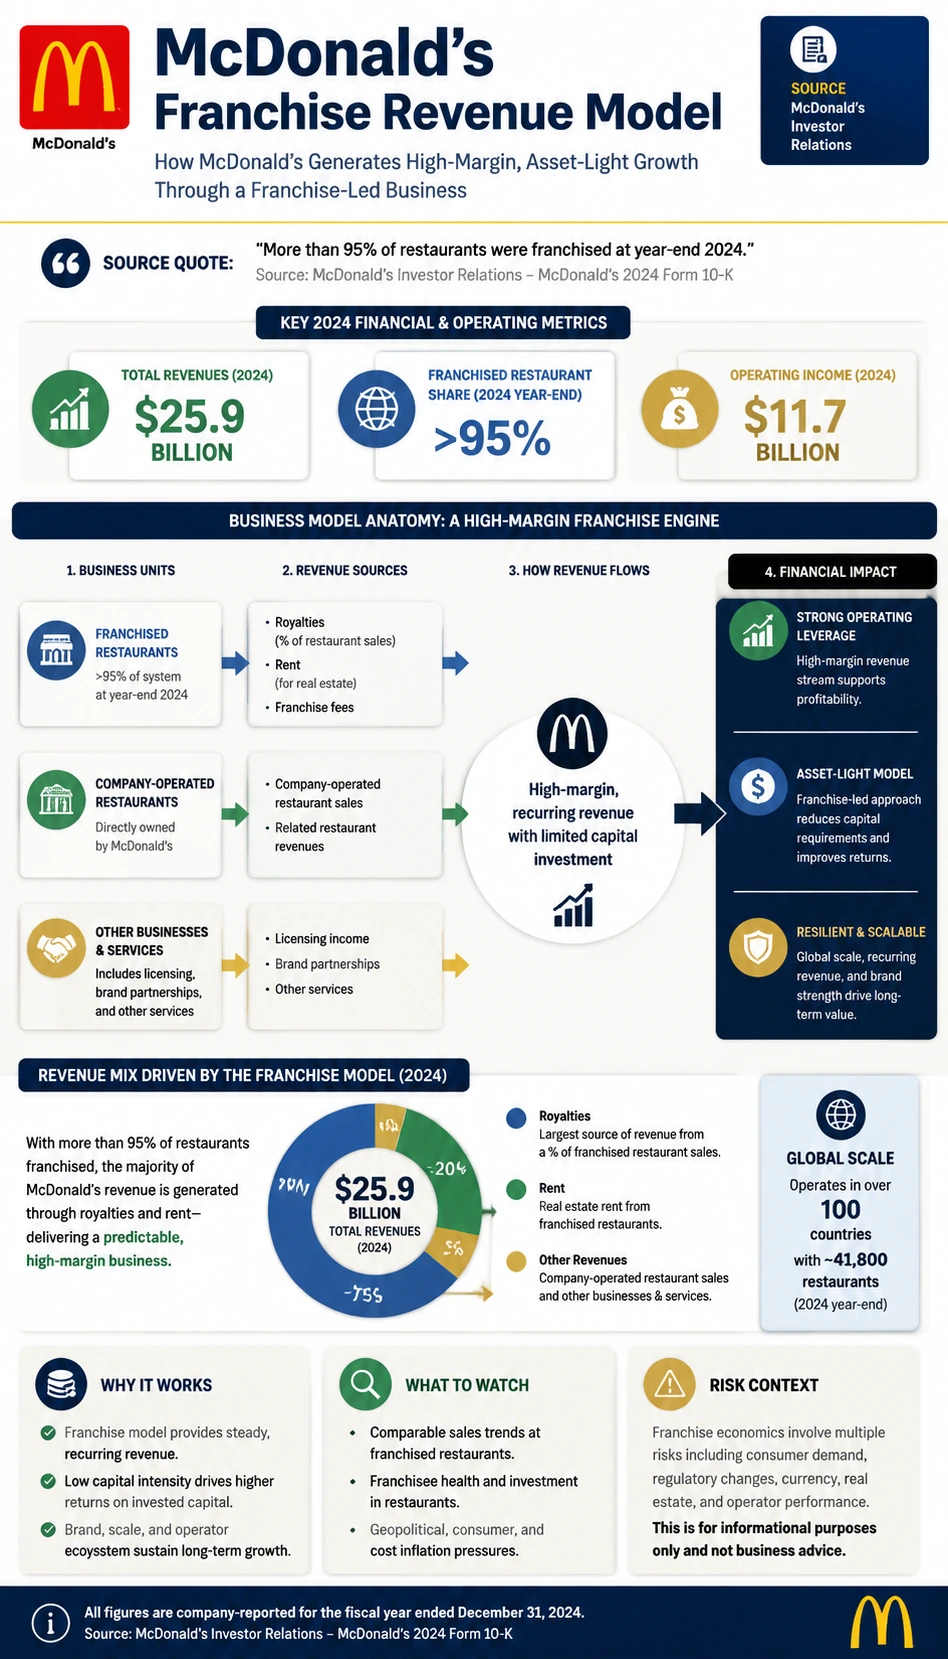
McDonald’s Franchise Revenue Model
A source-backed mcdonald’s franchise revenue model infographic template for earnings and market report learning.
Open detail page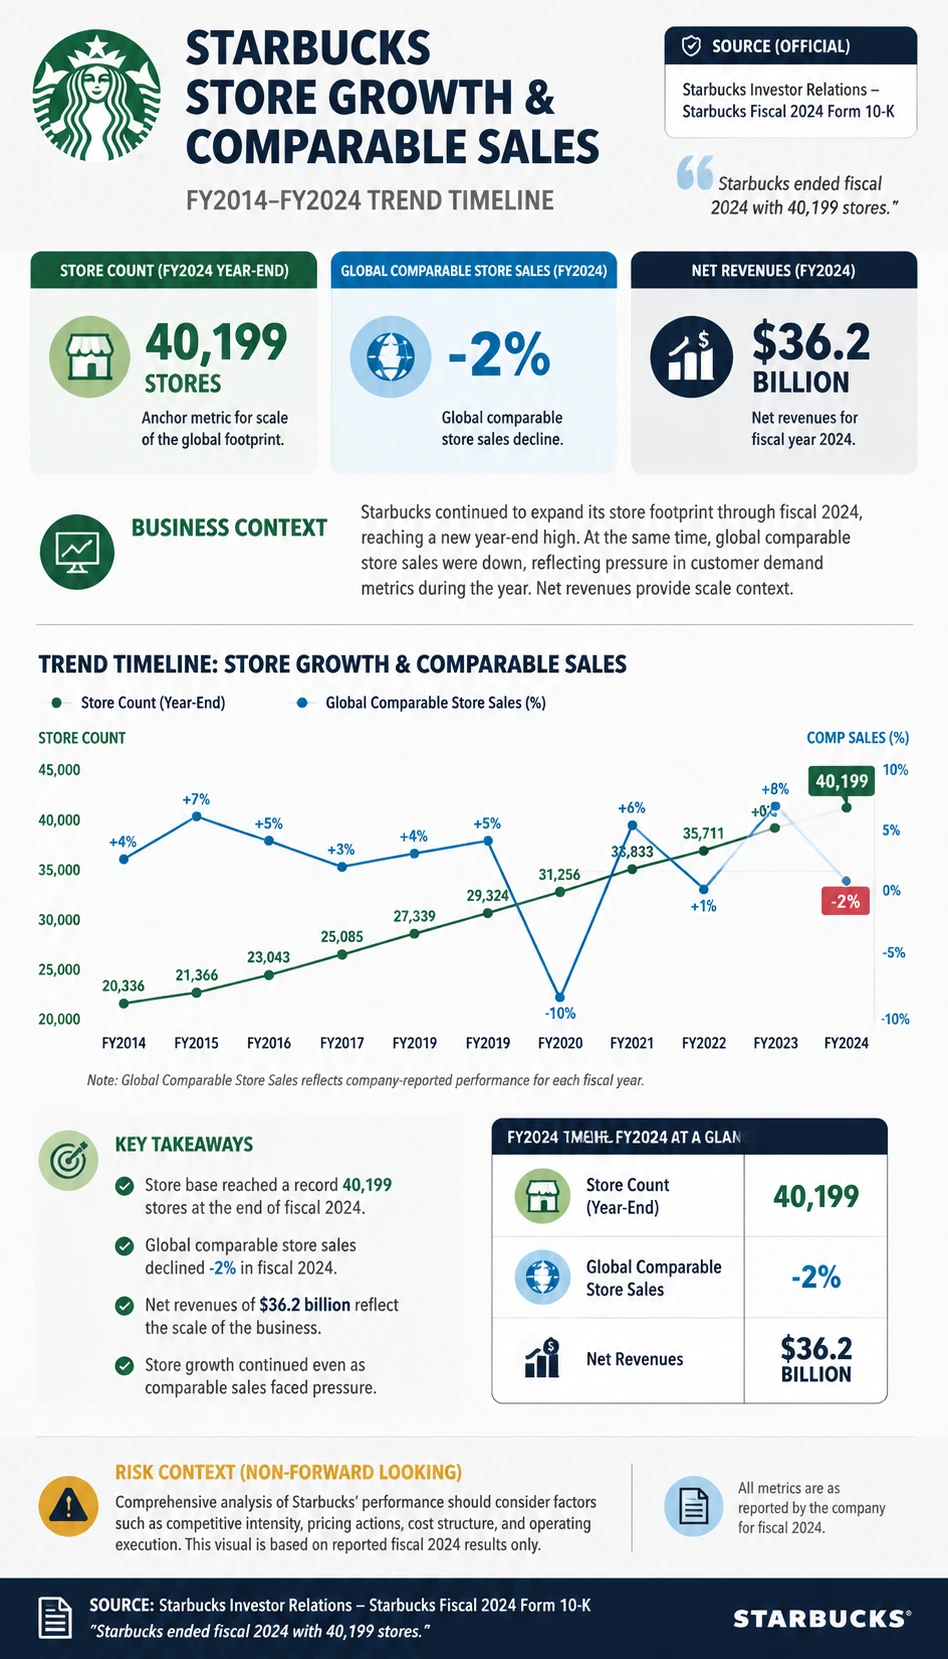
Starbucks Store Growth and Comparable Sales
A source-backed starbucks store growth and comparable sales infographic template for earnings and market report learning.
Open detail page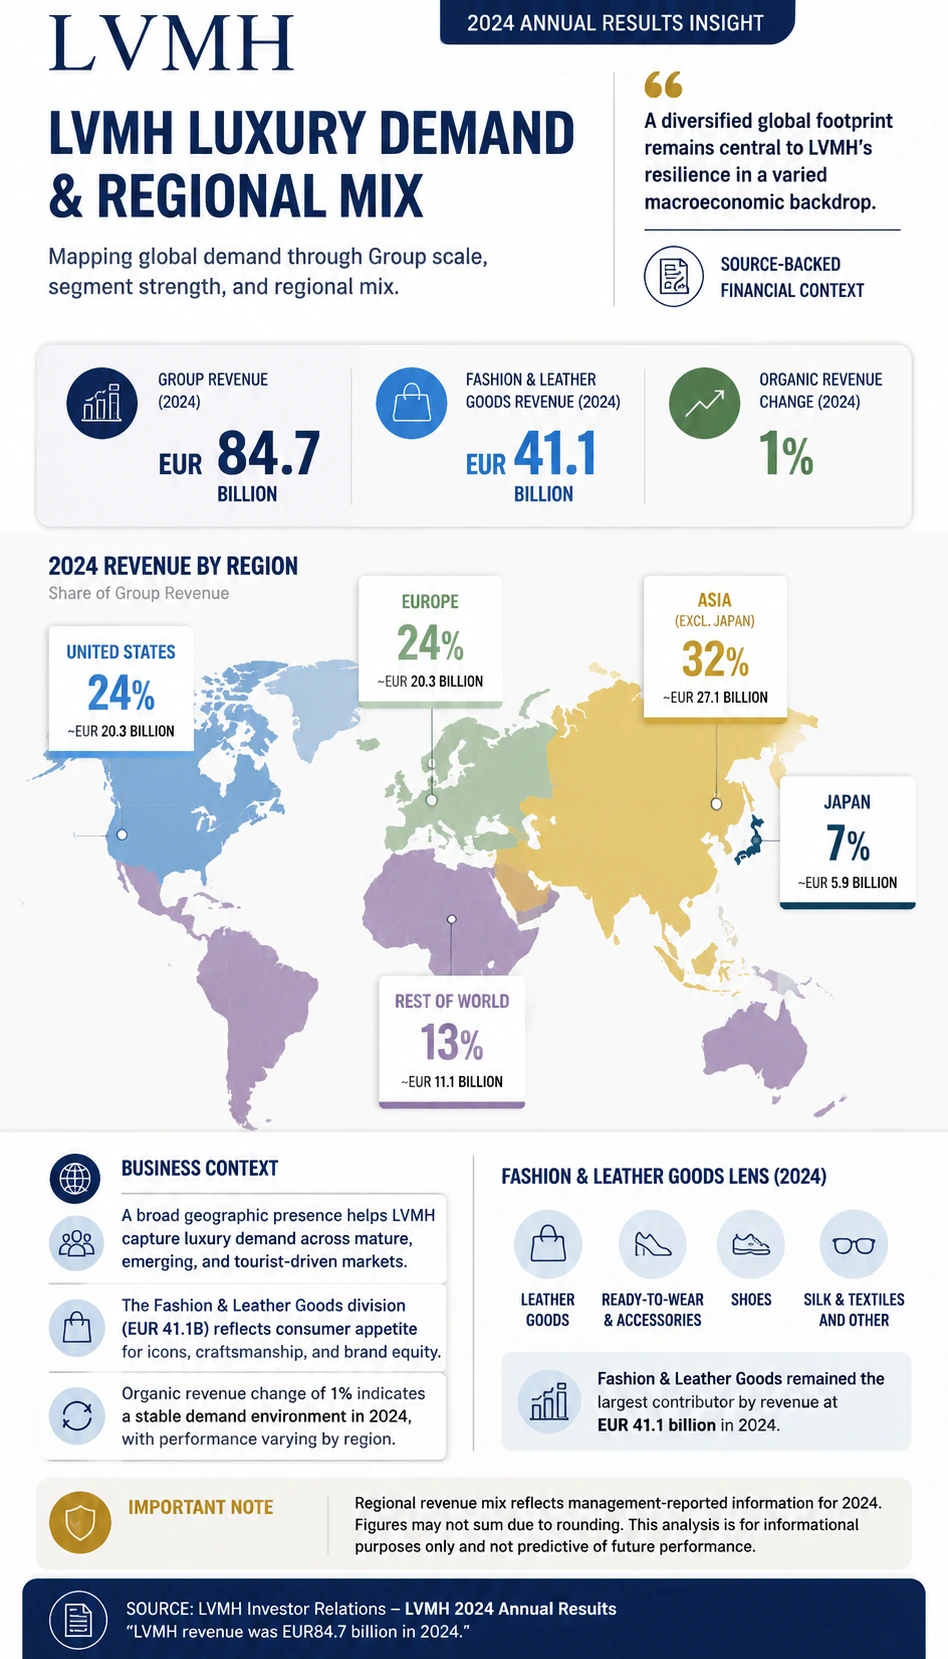
LVMH Luxury Demand and Regional Mix
A source-backed lvmh luxury demand and regional mix infographic template for earnings and market report learning.
Open detail page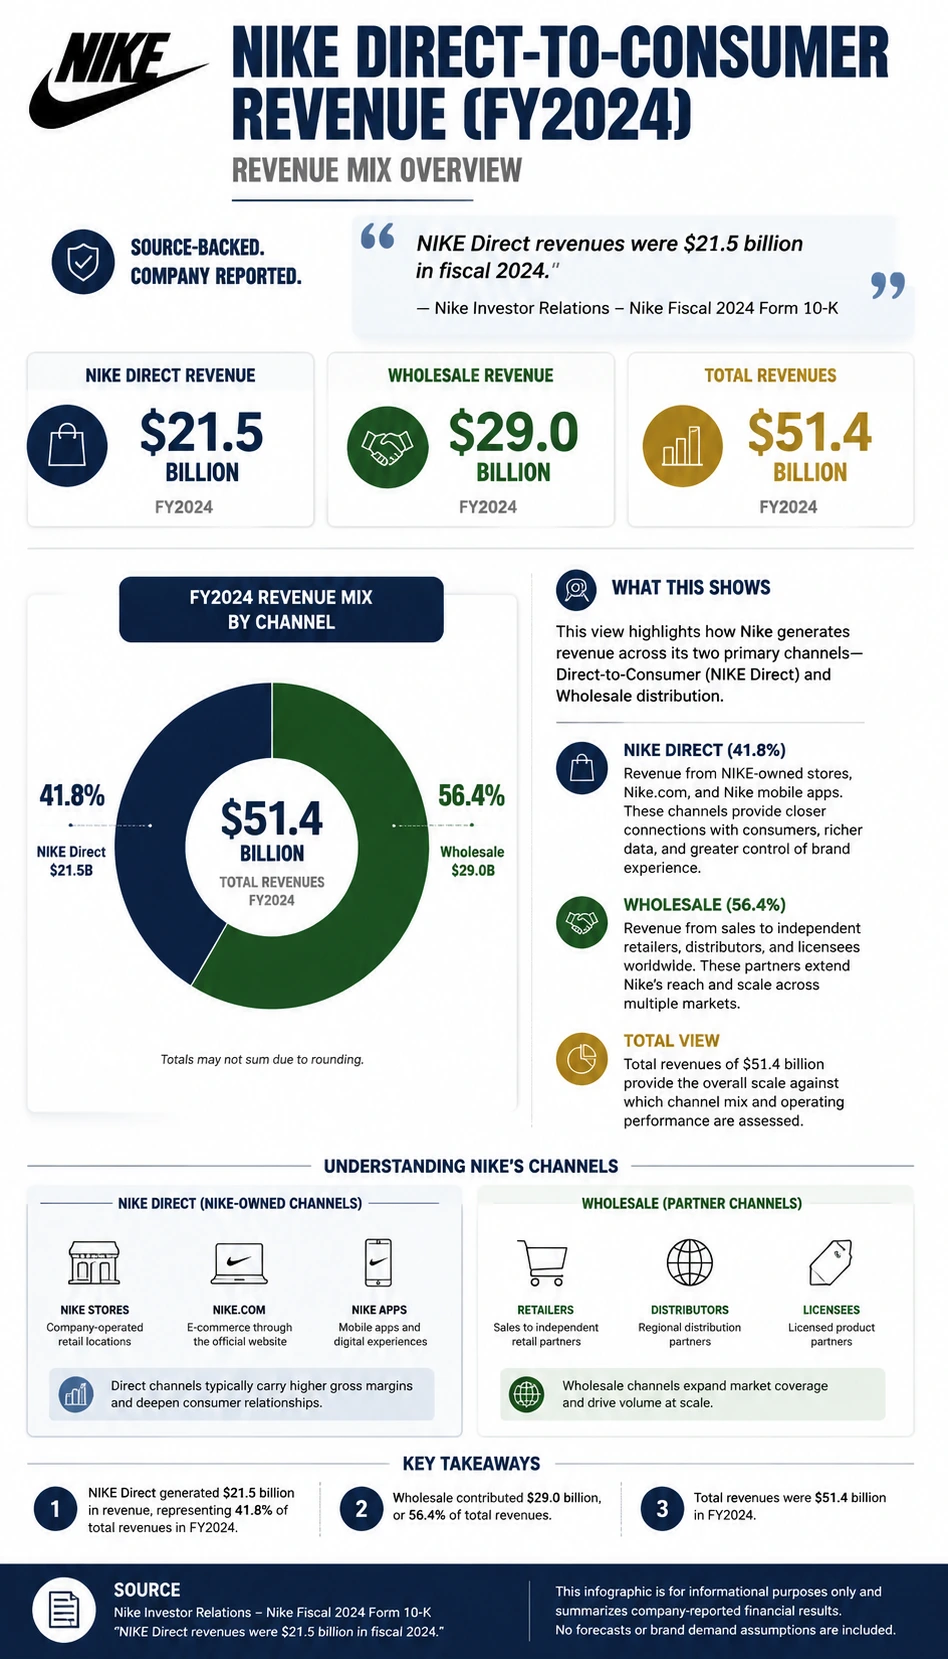
Nike Direct-to-Consumer Revenue
A source-backed nike direct-to-consumer revenue infographic template for earnings and market report learning.
Open detail page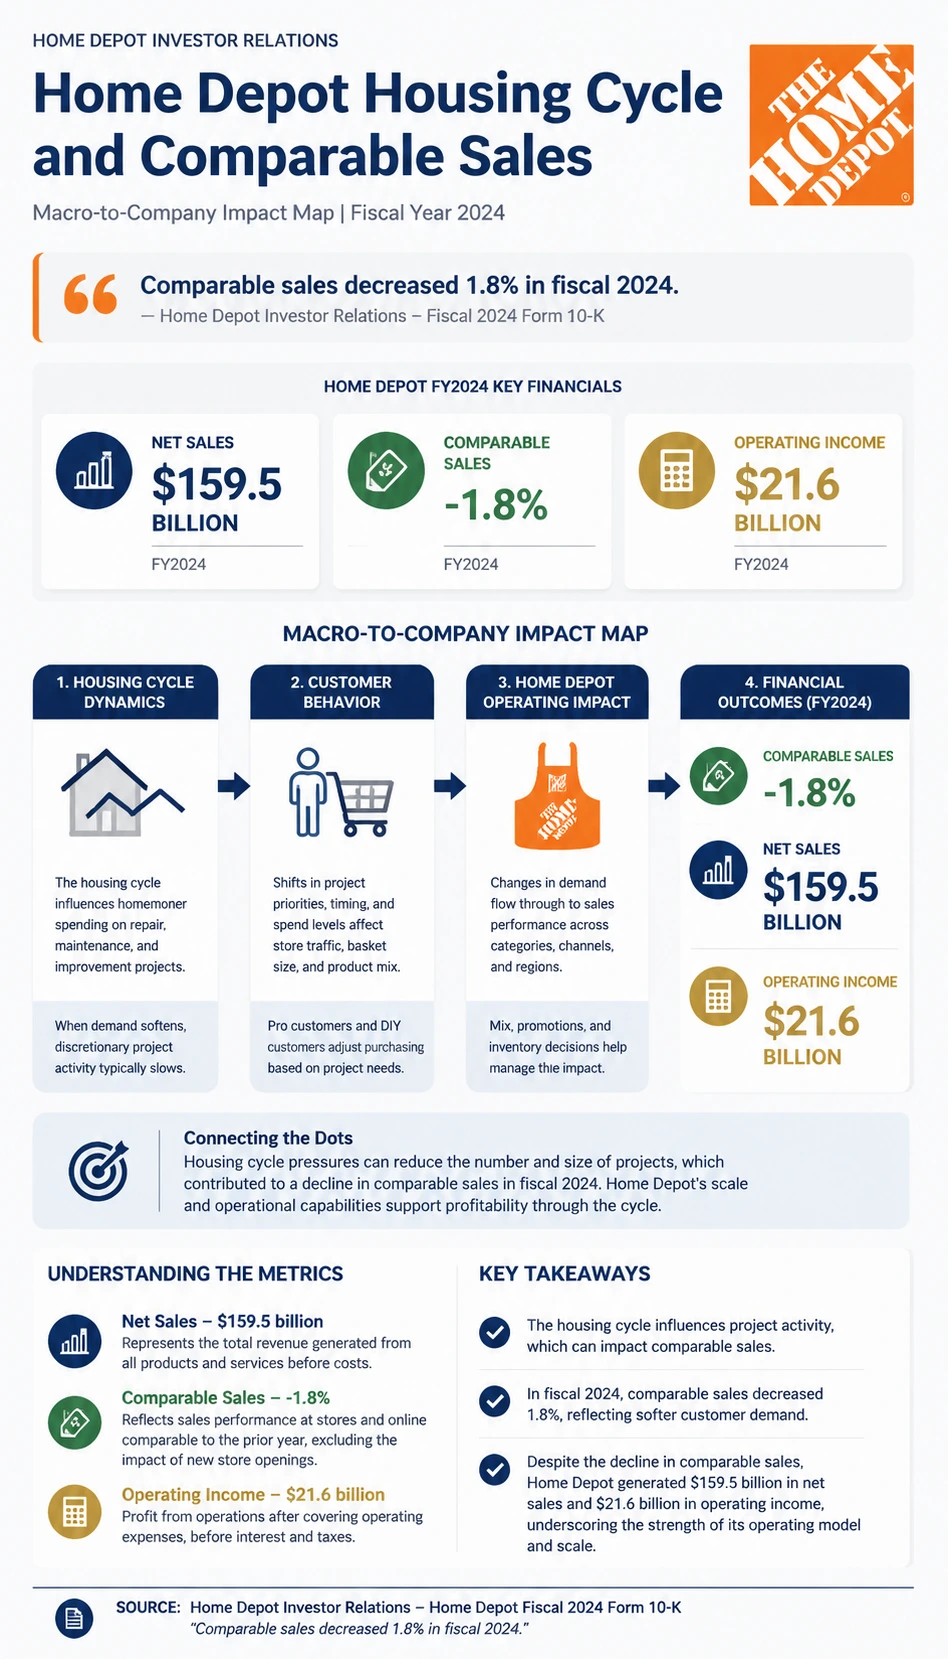
Home Depot Housing Cycle and Comparable Sales
A source-backed home depot housing cycle and comparable sales infographic template for earnings and market report learning.
Open detail page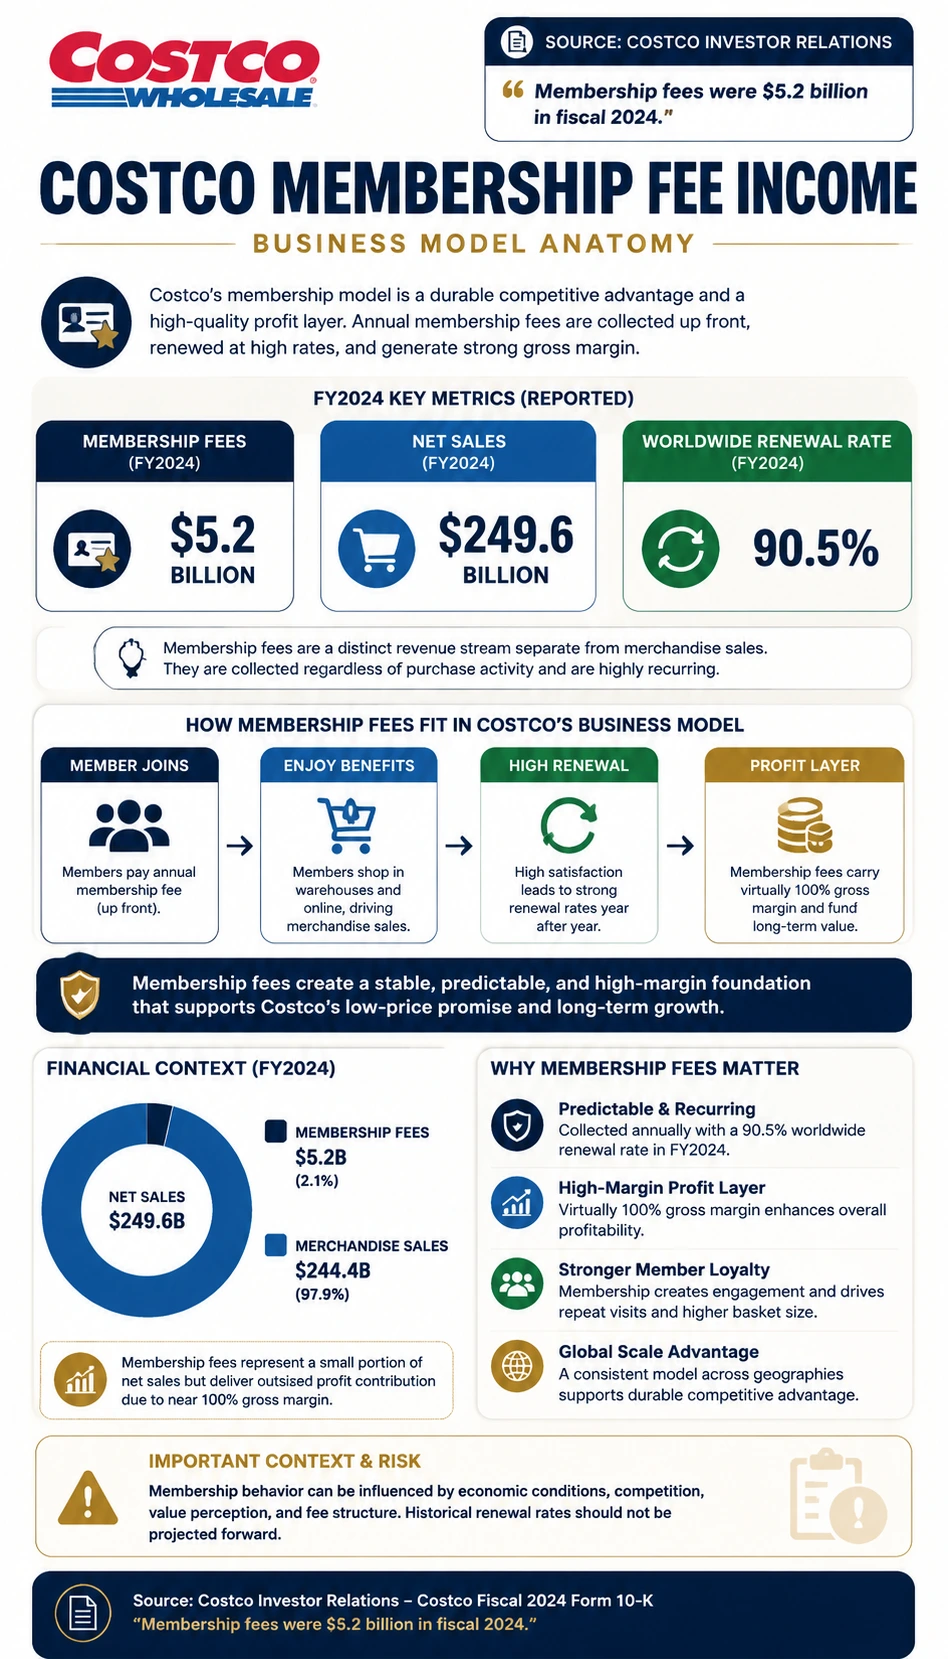
Costco Membership Fee Income
A source-backed costco membership fee income infographic template for earnings and market report learning.
Open detail page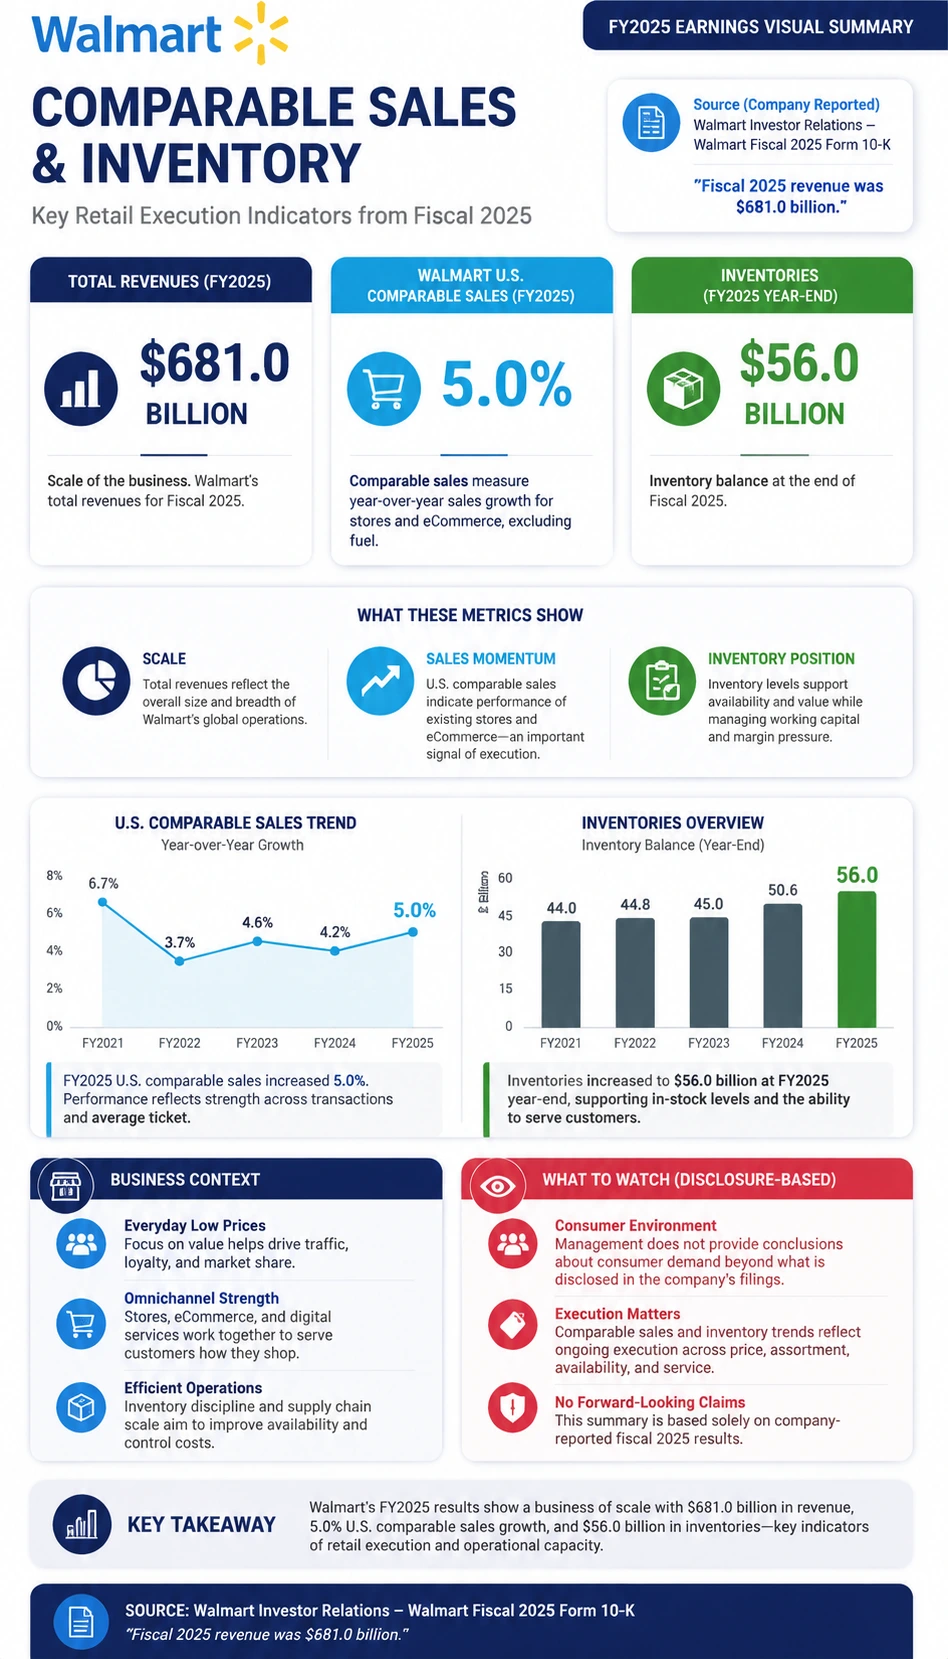
Walmart Comparable Sales and Inventory
A source-backed walmart comparable sales and inventory infographic template for earnings and market report learning.
Open detail page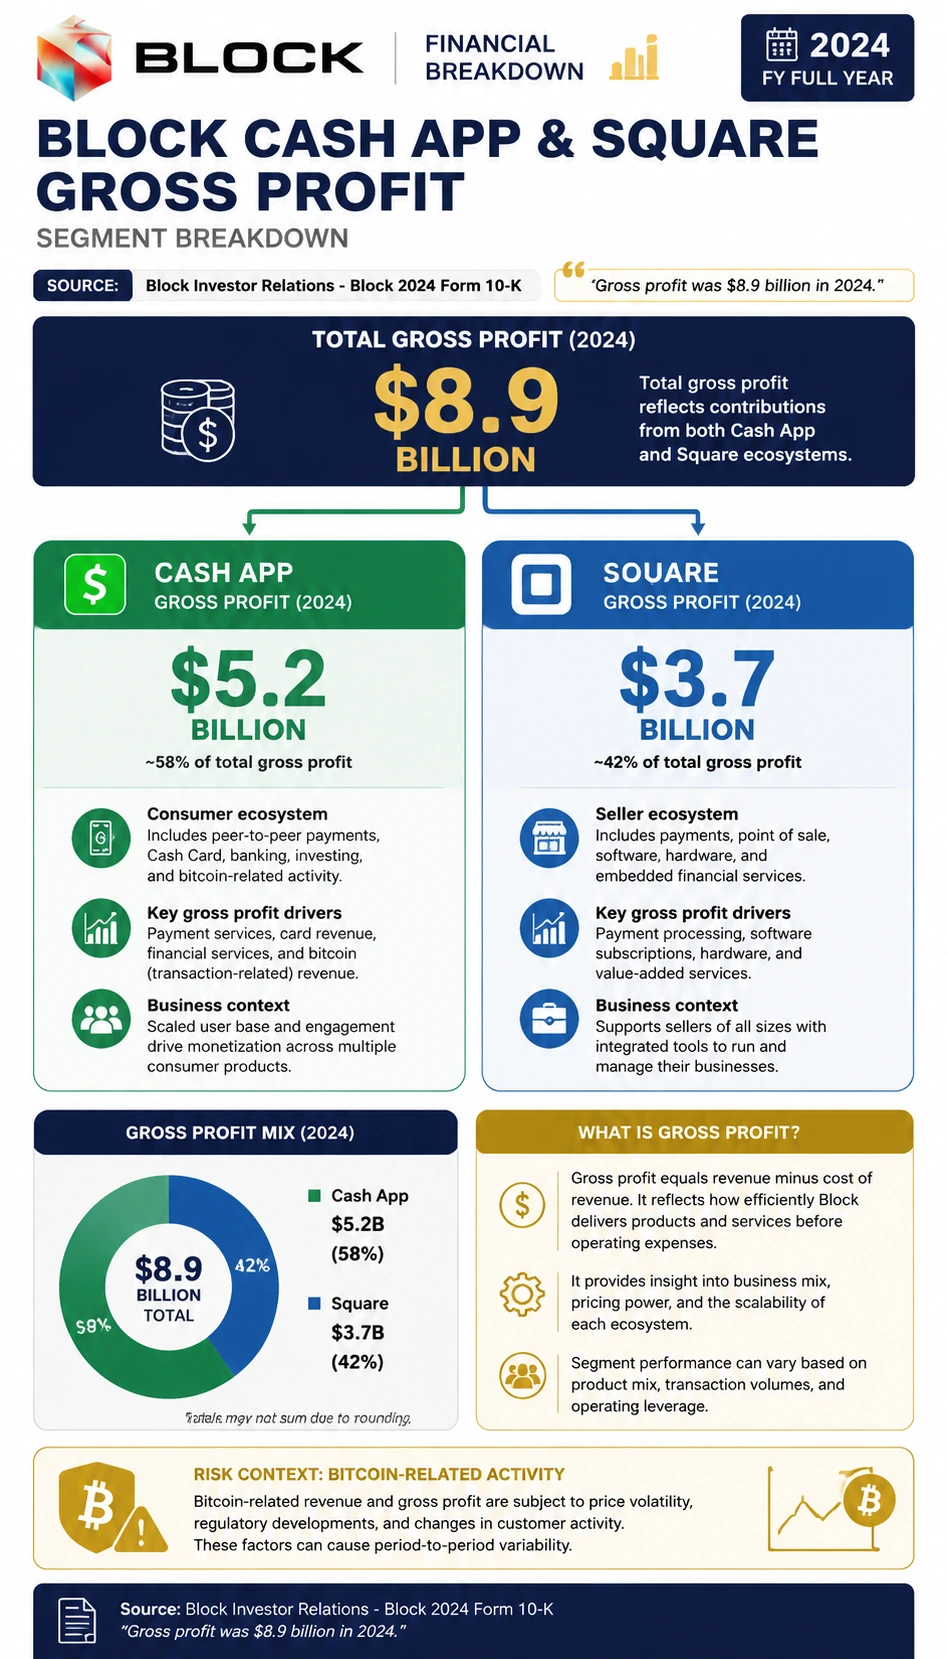
Block Cash App and Square Gross Profit
A source-backed block cash app and square gross profit infographic template for earnings and market report learning.
Open detail page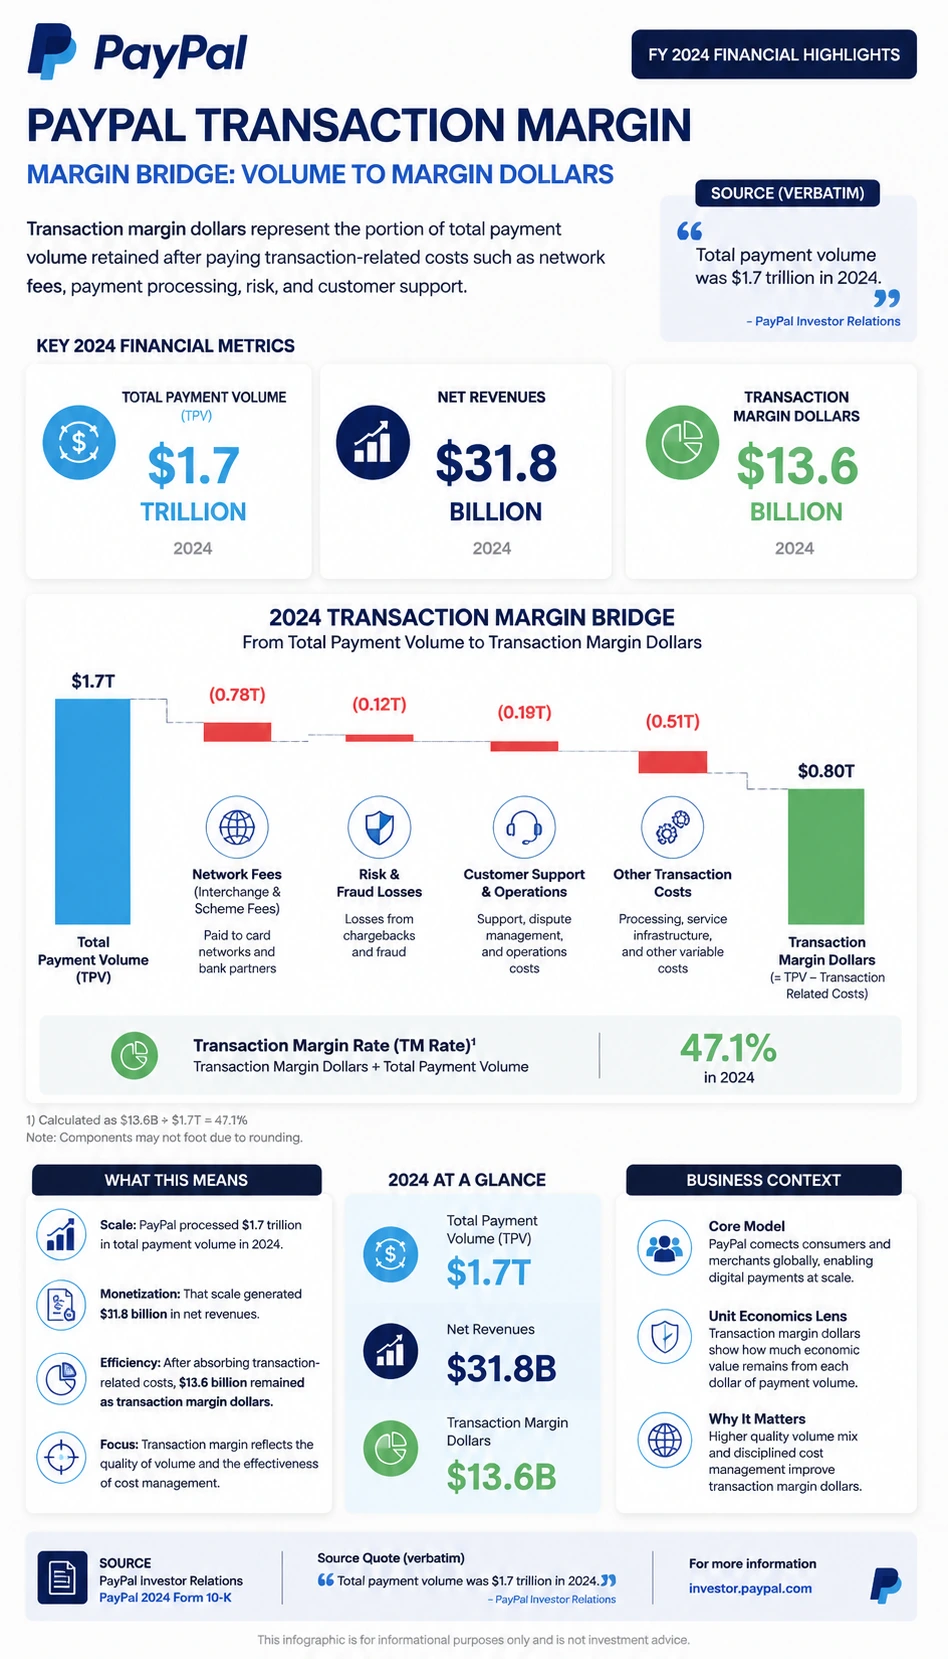
PayPal Transaction Margin
A source-backed paypal transaction margin infographic template for earnings and market report learning.
Open detail page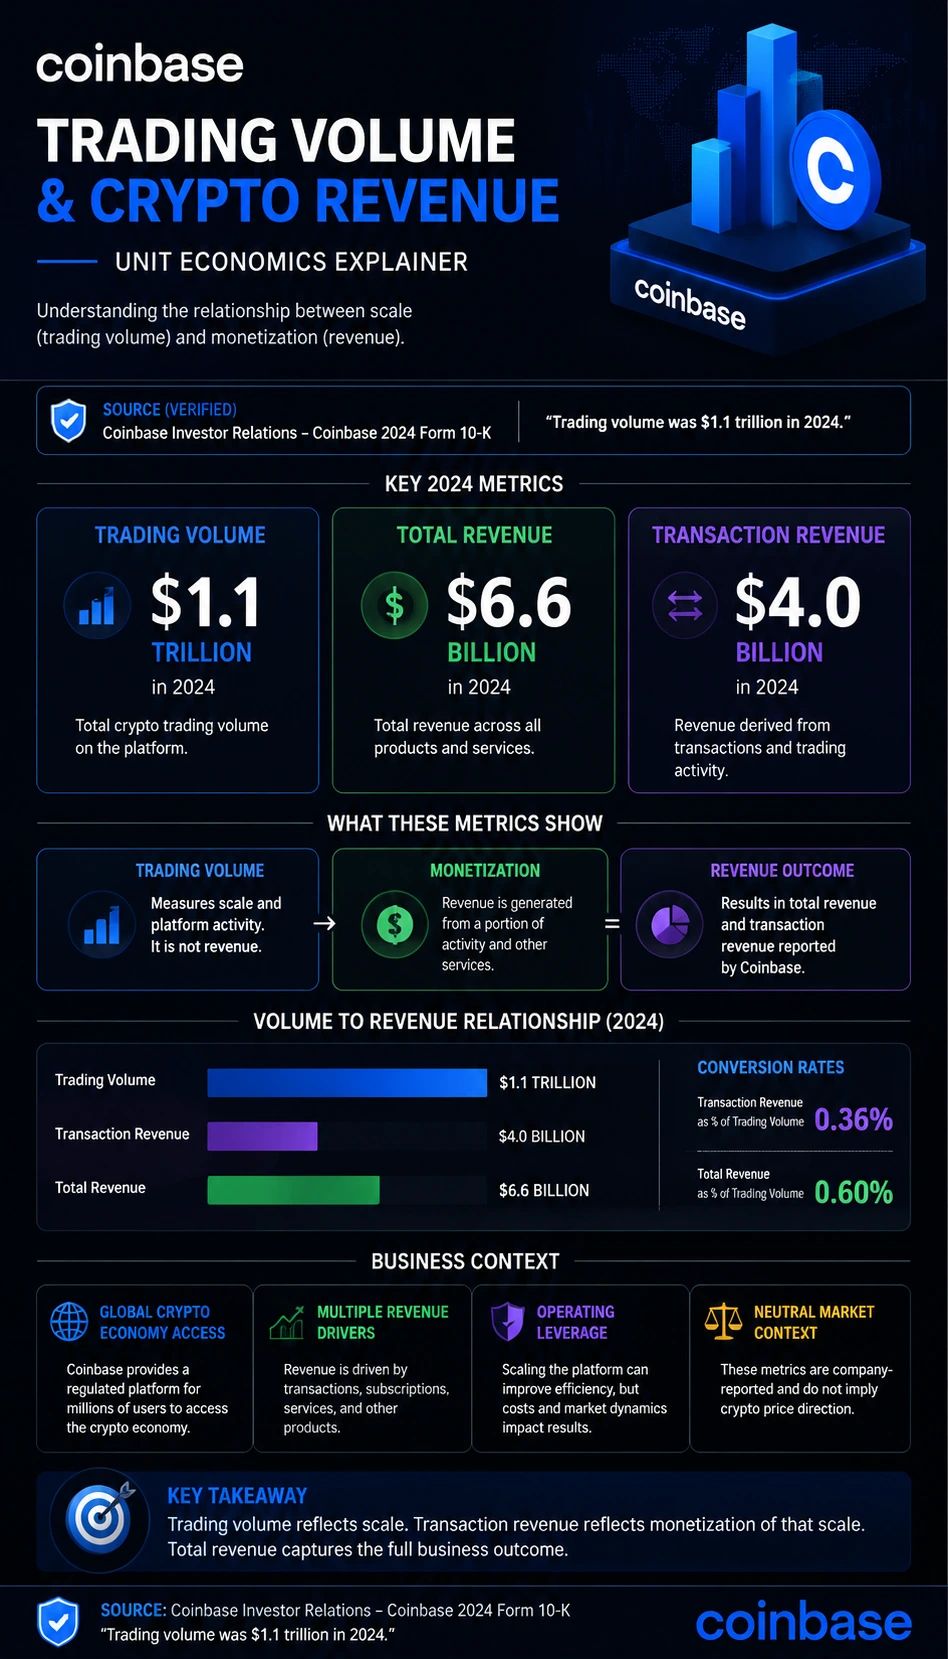
Coinbase Trading Volume and Crypto Revenue
A source-backed coinbase trading volume and crypto revenue infographic template for earnings and market report learning.
Open detail page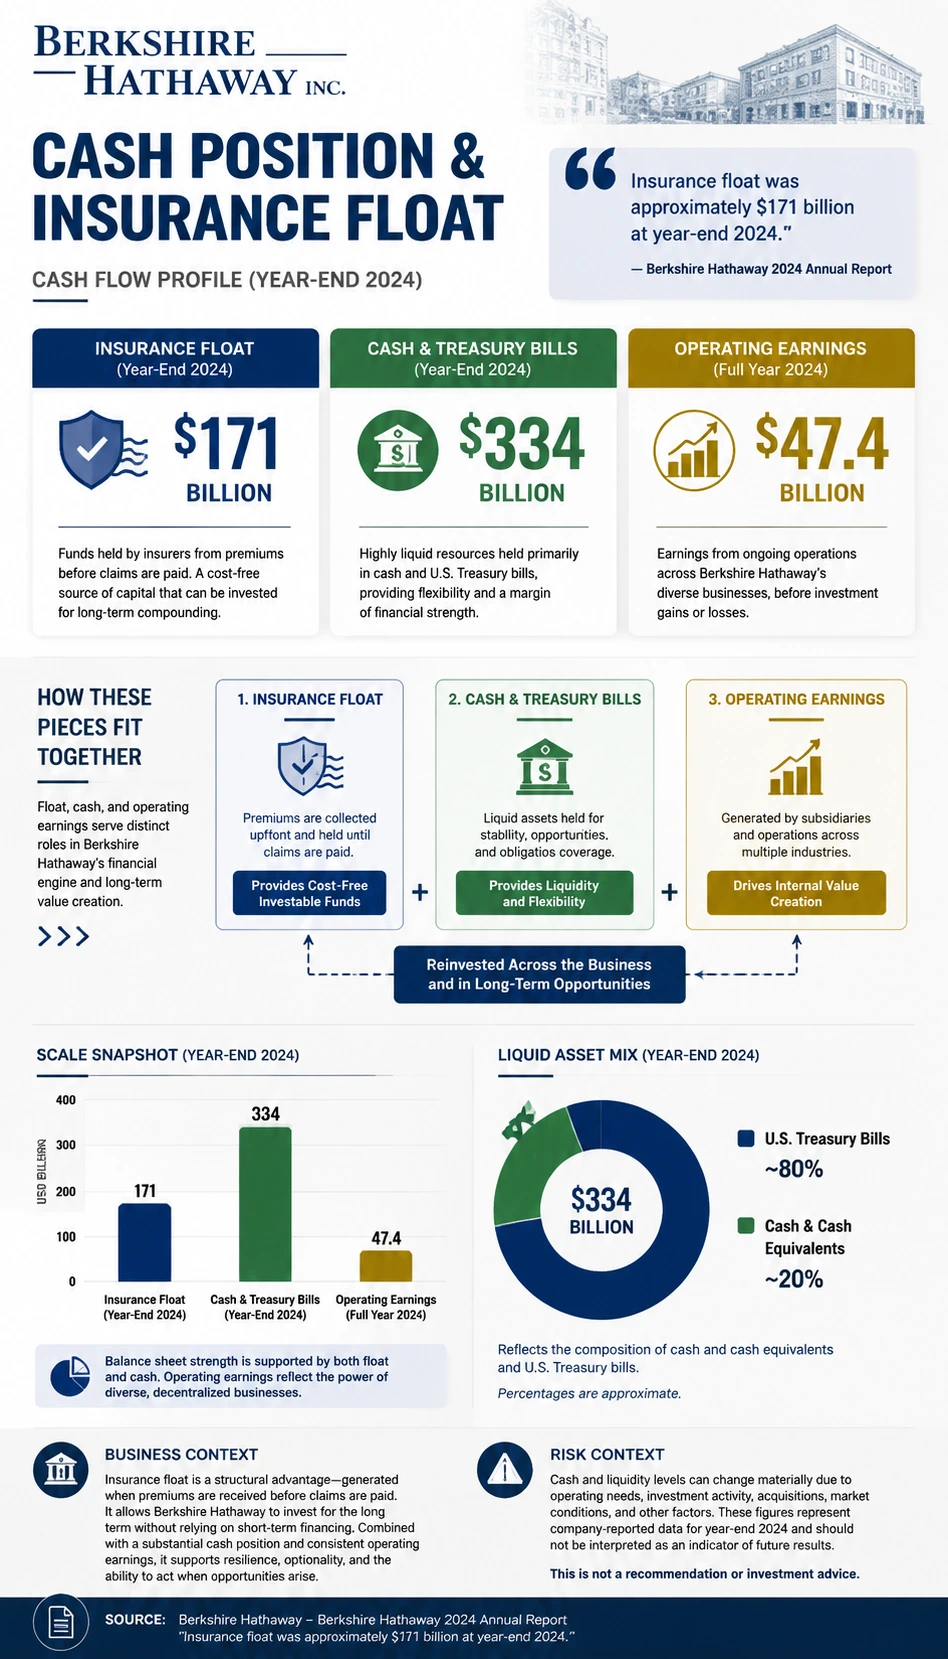
Berkshire Hathaway Cash Position and Insurance Float
A source-backed berkshire hathaway cash position and insurance float infographic template for earnings and market report learning.
Open detail page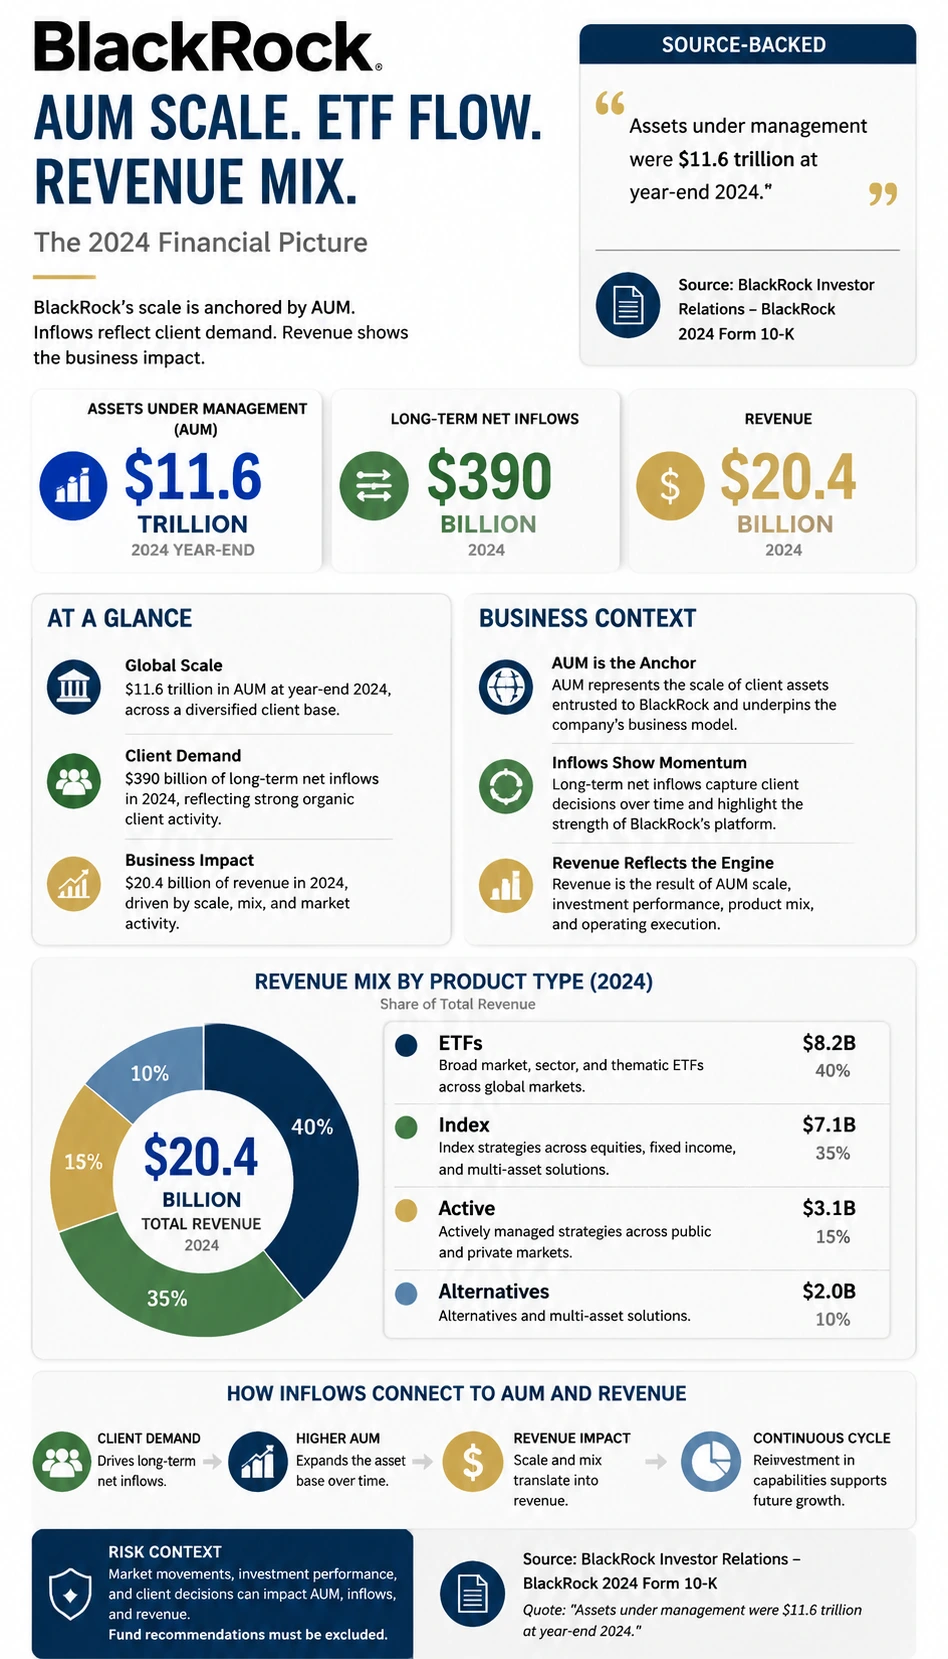
BlackRock AUM and ETF Flow
A source-backed blackrock aum and etf flow infographic template for earnings and market report learning.
Open detail page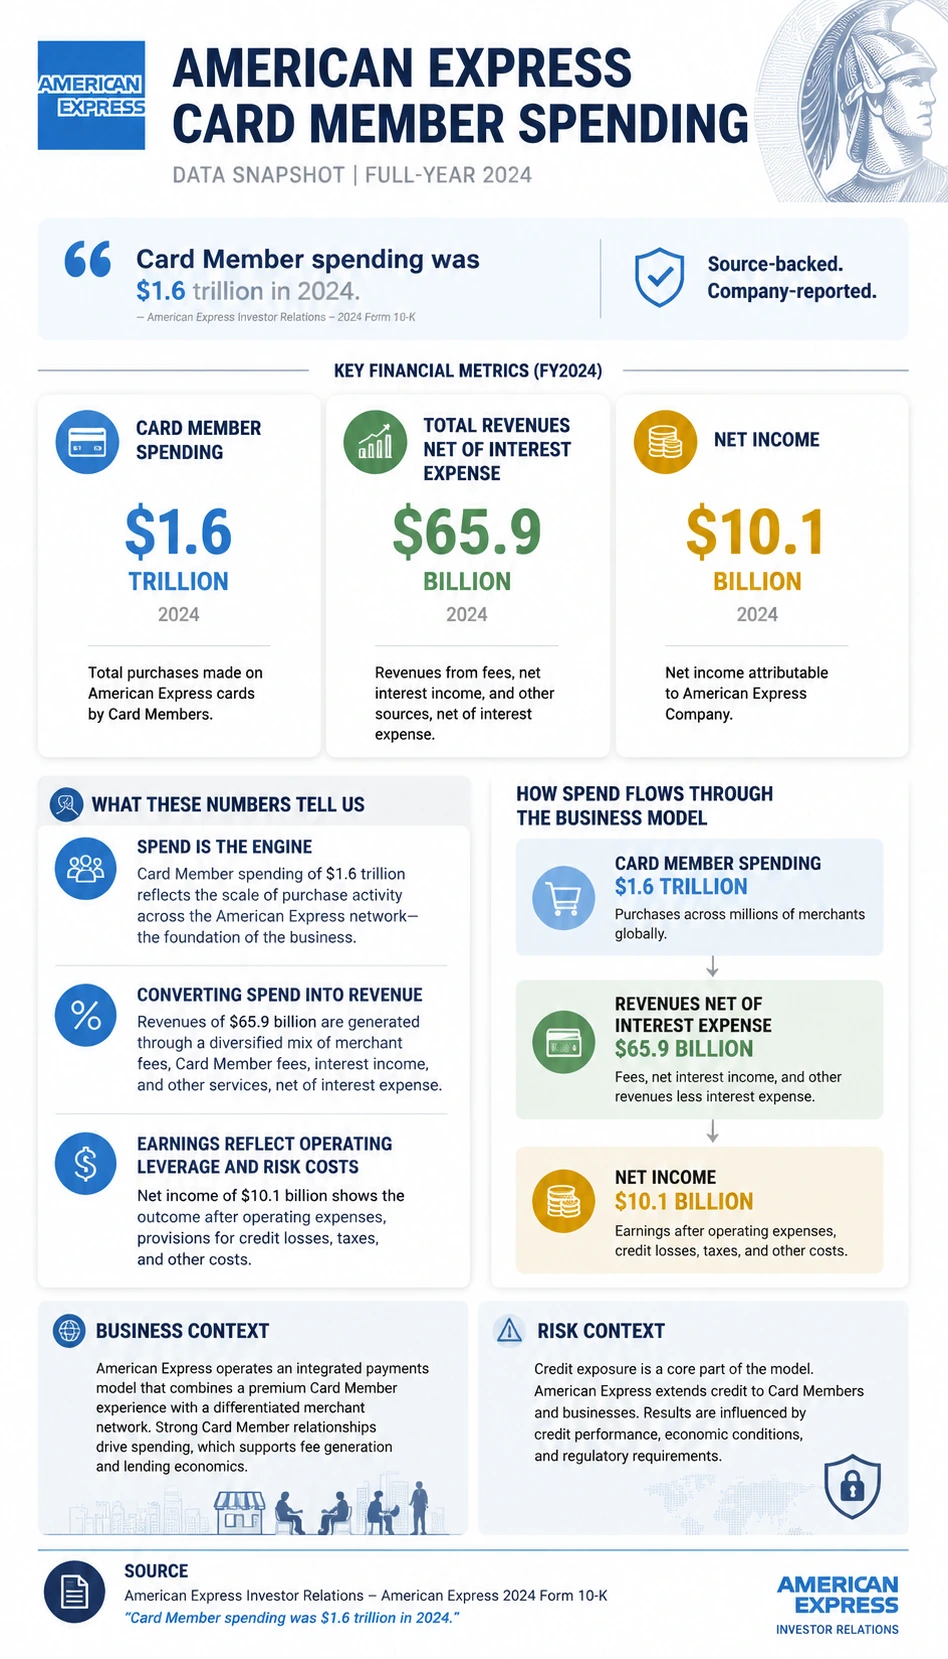
American Express Card Member Spending
A source-backed american express card member spending infographic template for earnings and market report learning.
Open detail page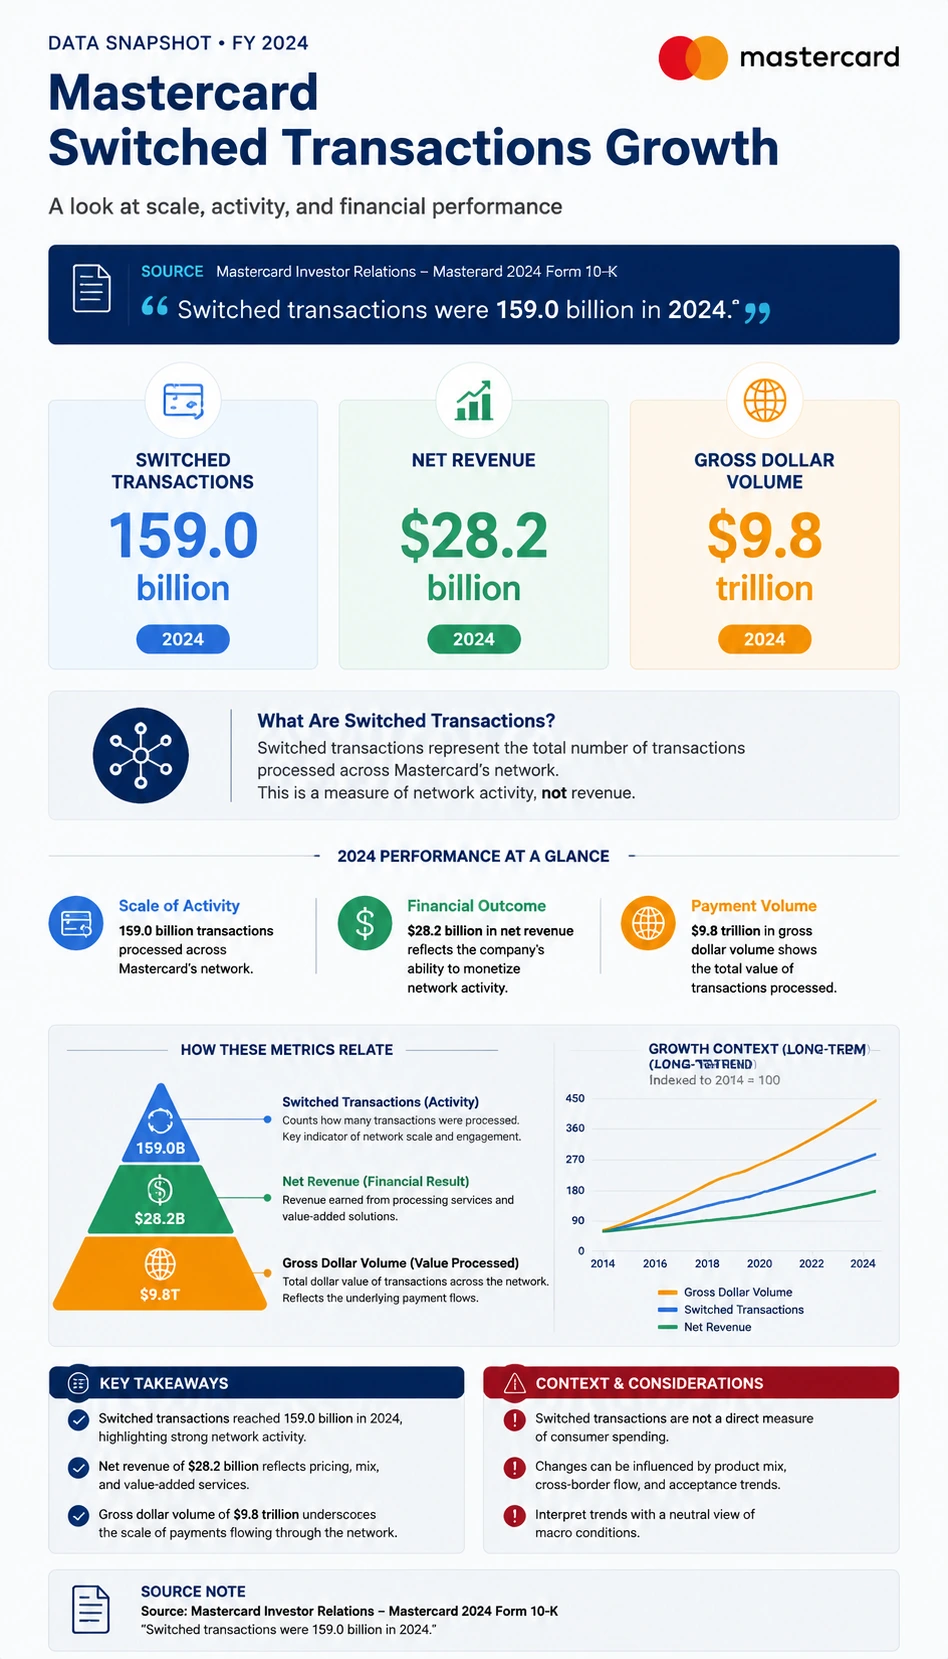
Mastercard Switched Transactions Growth
A source-backed mastercard switched transactions growth infographic template for earnings and market report learning.
Open detail page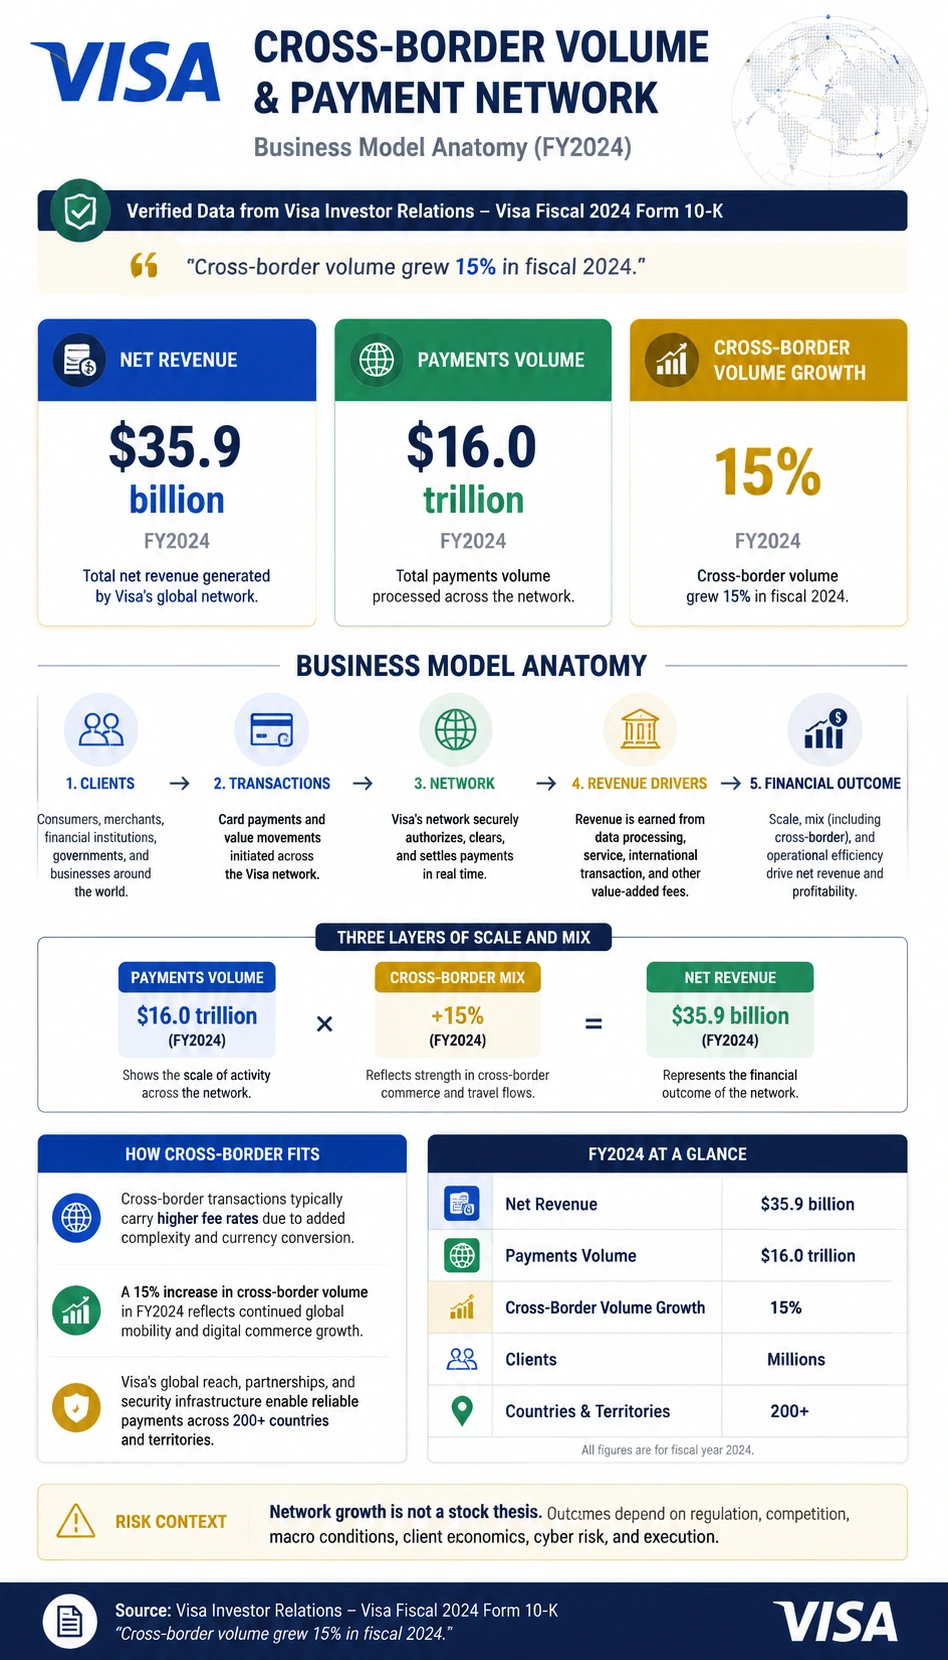
Visa Cross-Border Volume and Payment Network
A source-backed visa cross-border volume and payment network infographic template for earnings and market report learning.
Open detail page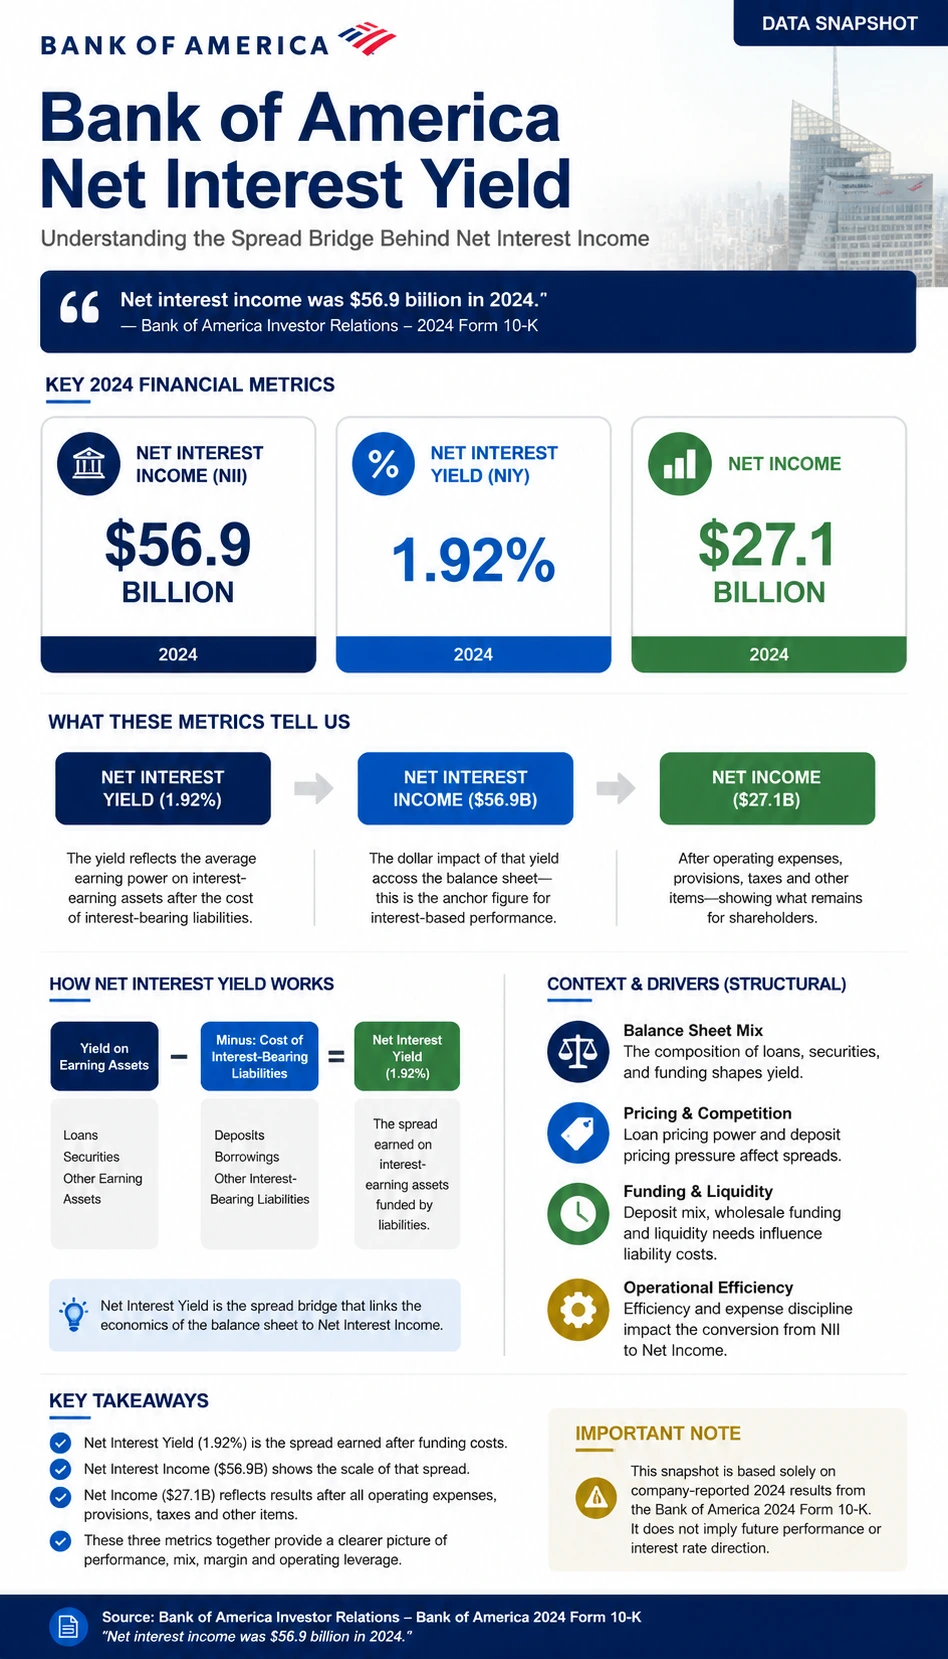
Bank of America Net Interest Yield
A source-backed bank of america net interest yield infographic template for earnings and market report learning.
Open detail page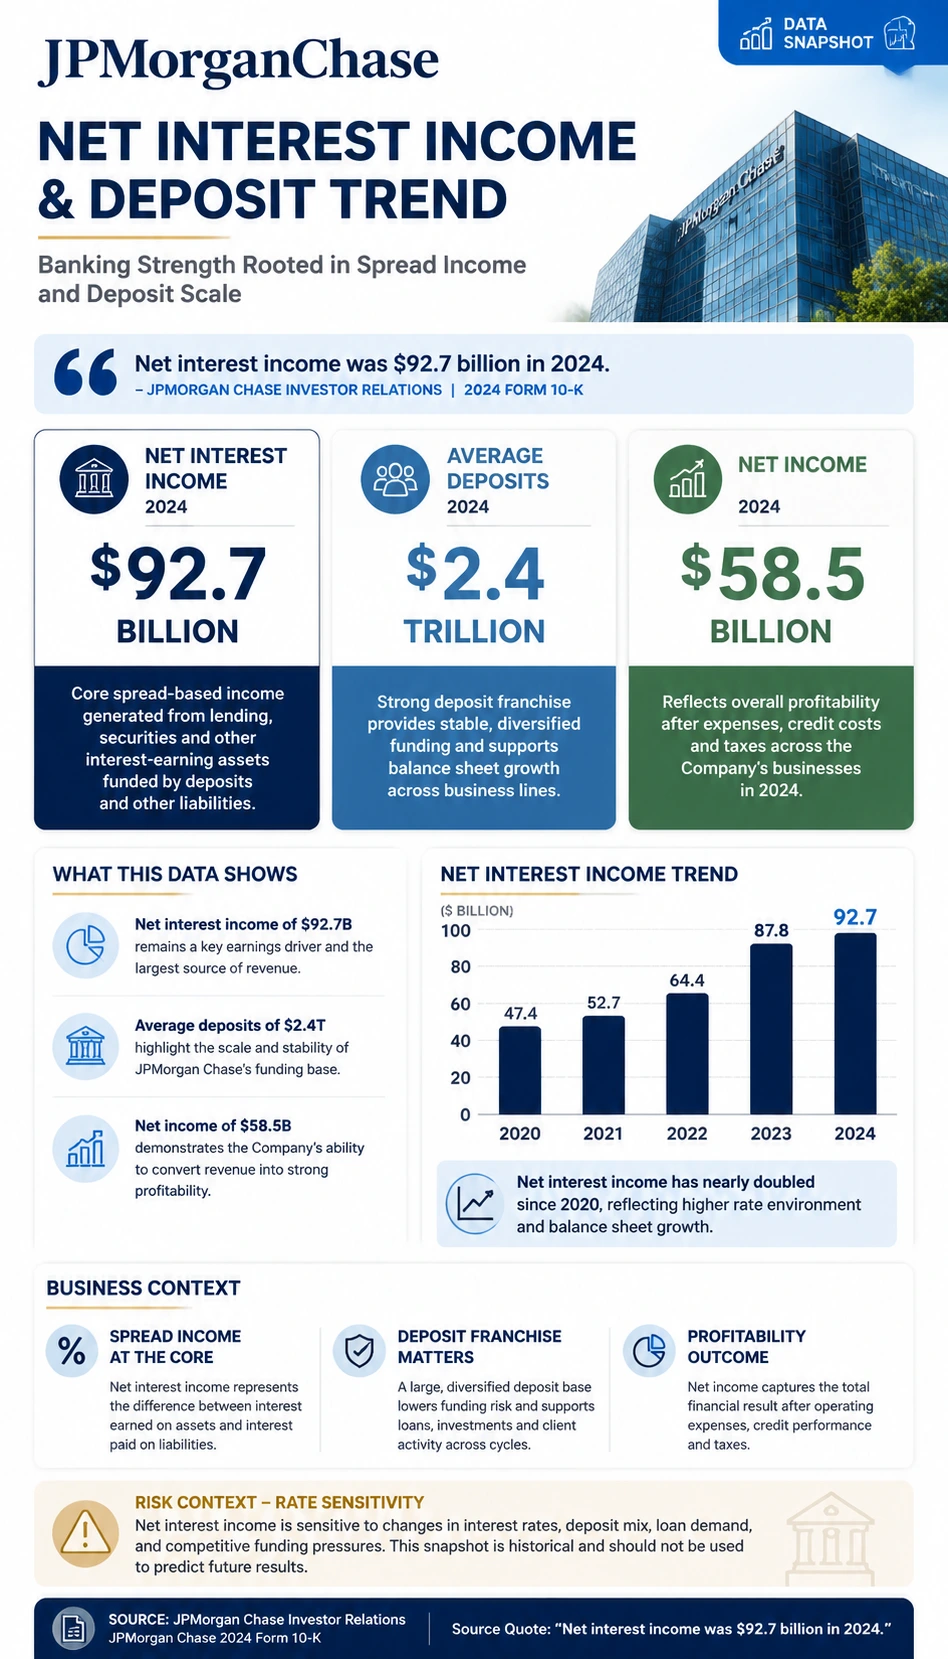
JPMorgan Net Interest Income and Deposit Trend
A source-backed jpmorgan net interest income and deposit trend infographic template for earnings and market report learning.
Open detail page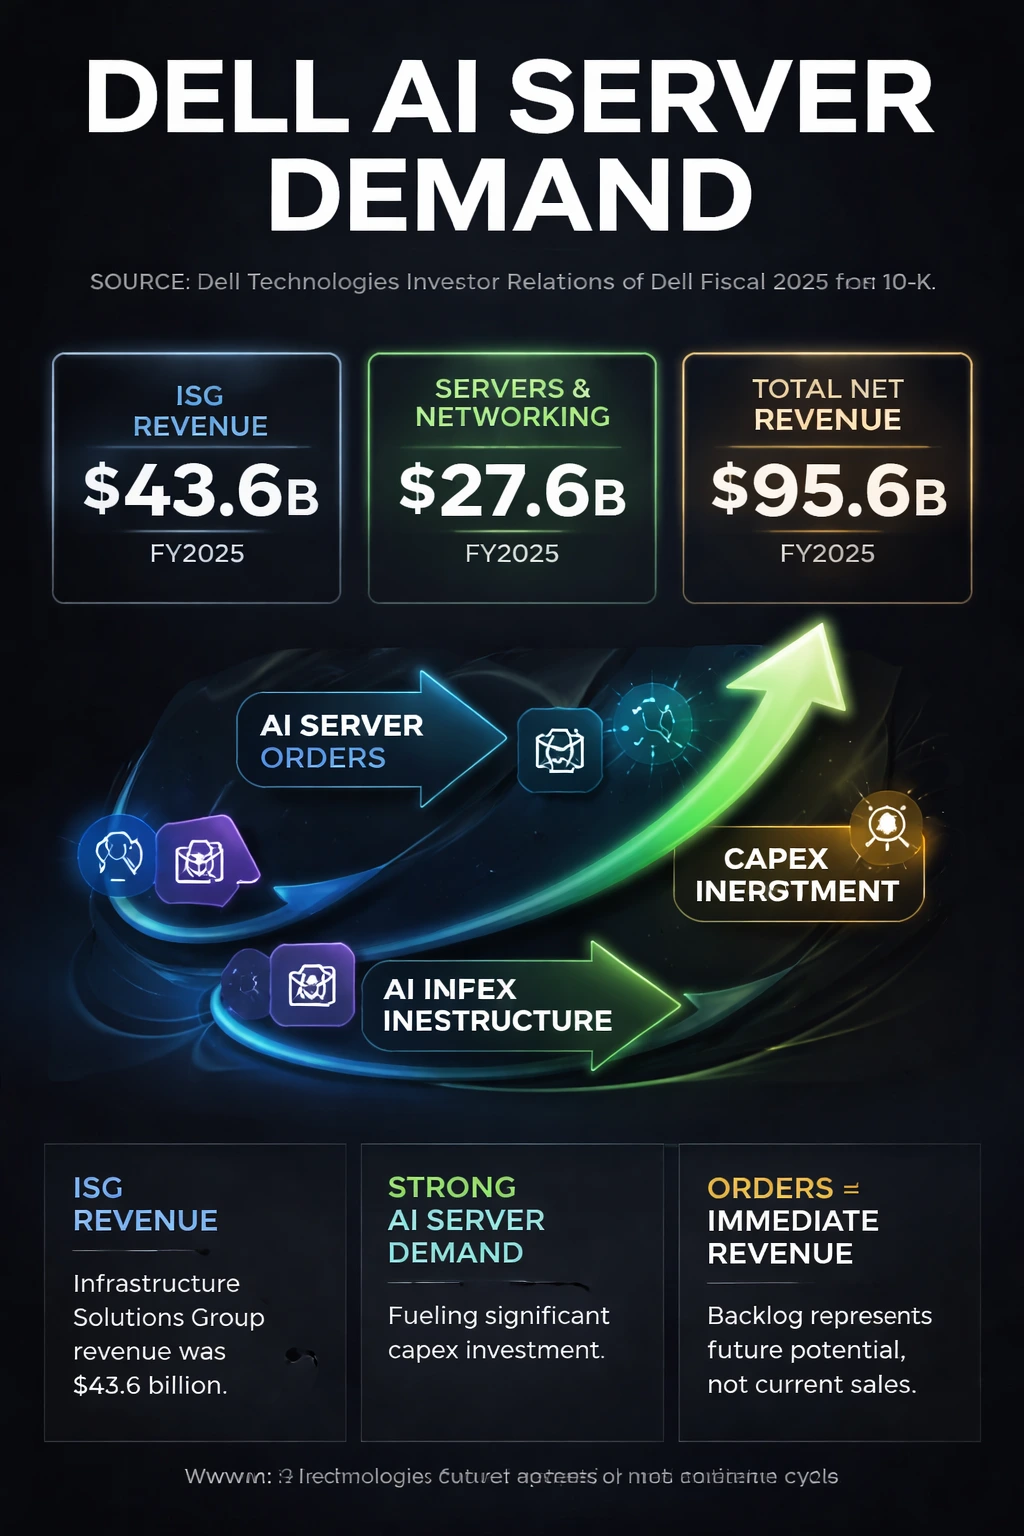
Dell AI Server Demand
A source-backed dell ai server demand infographic template for earnings and market report learning.
Open detail page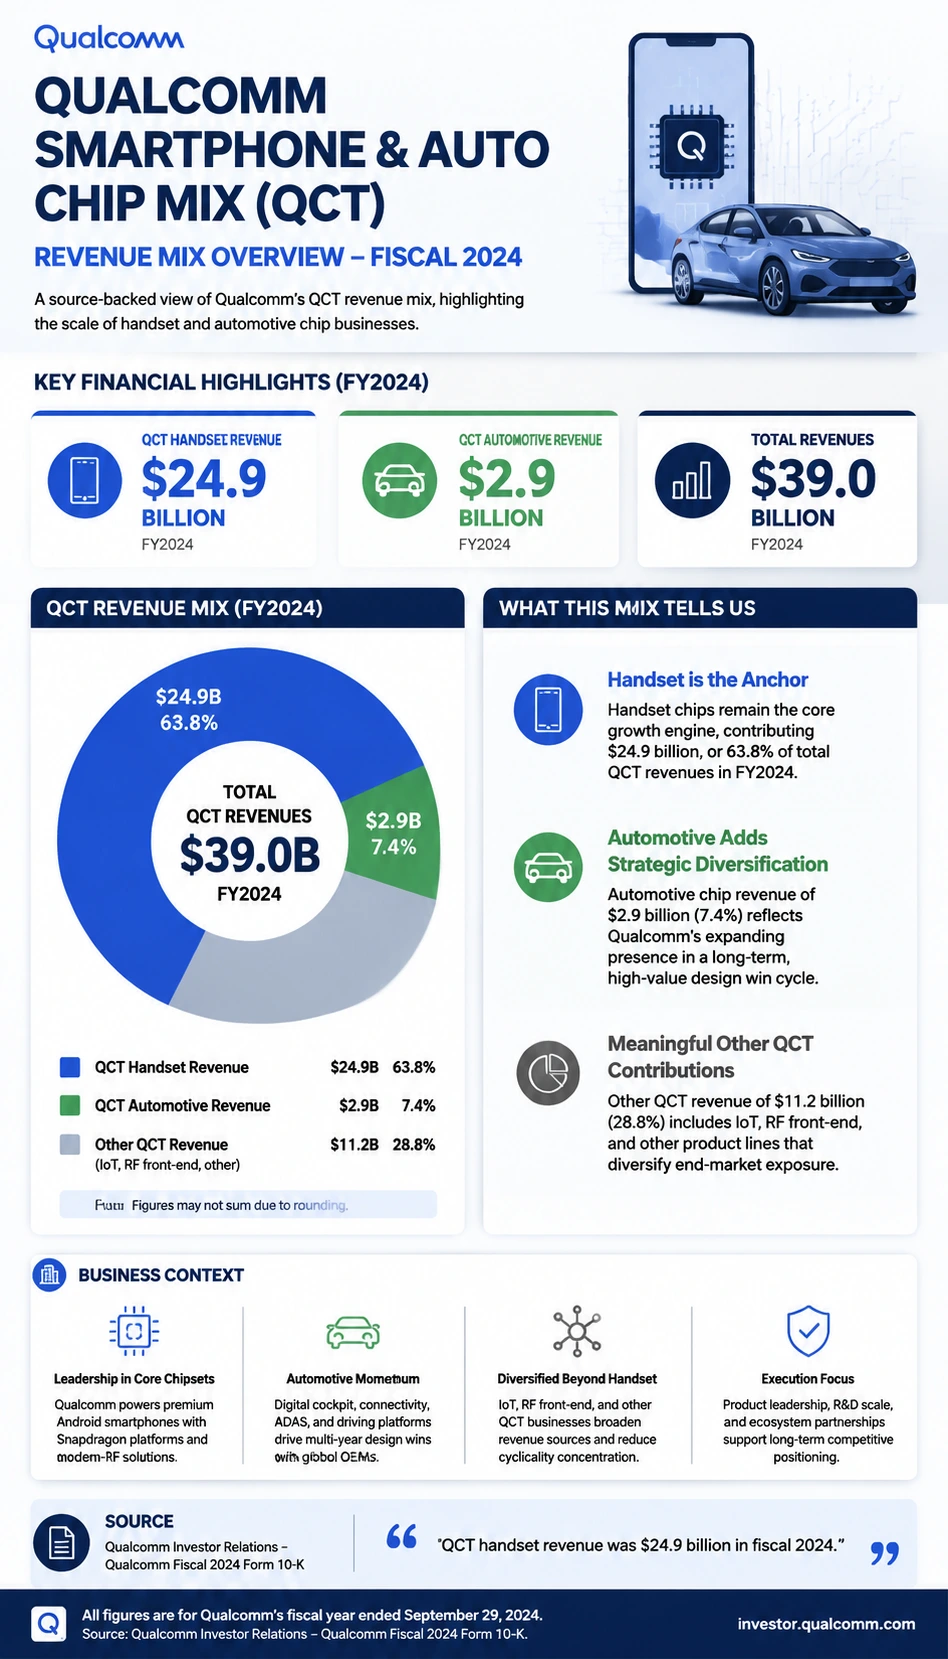
Qualcomm Smartphone and Auto Chip Mix
A source-backed qualcomm smartphone and auto chip mix infographic template for earnings and market report learning.
Open detail page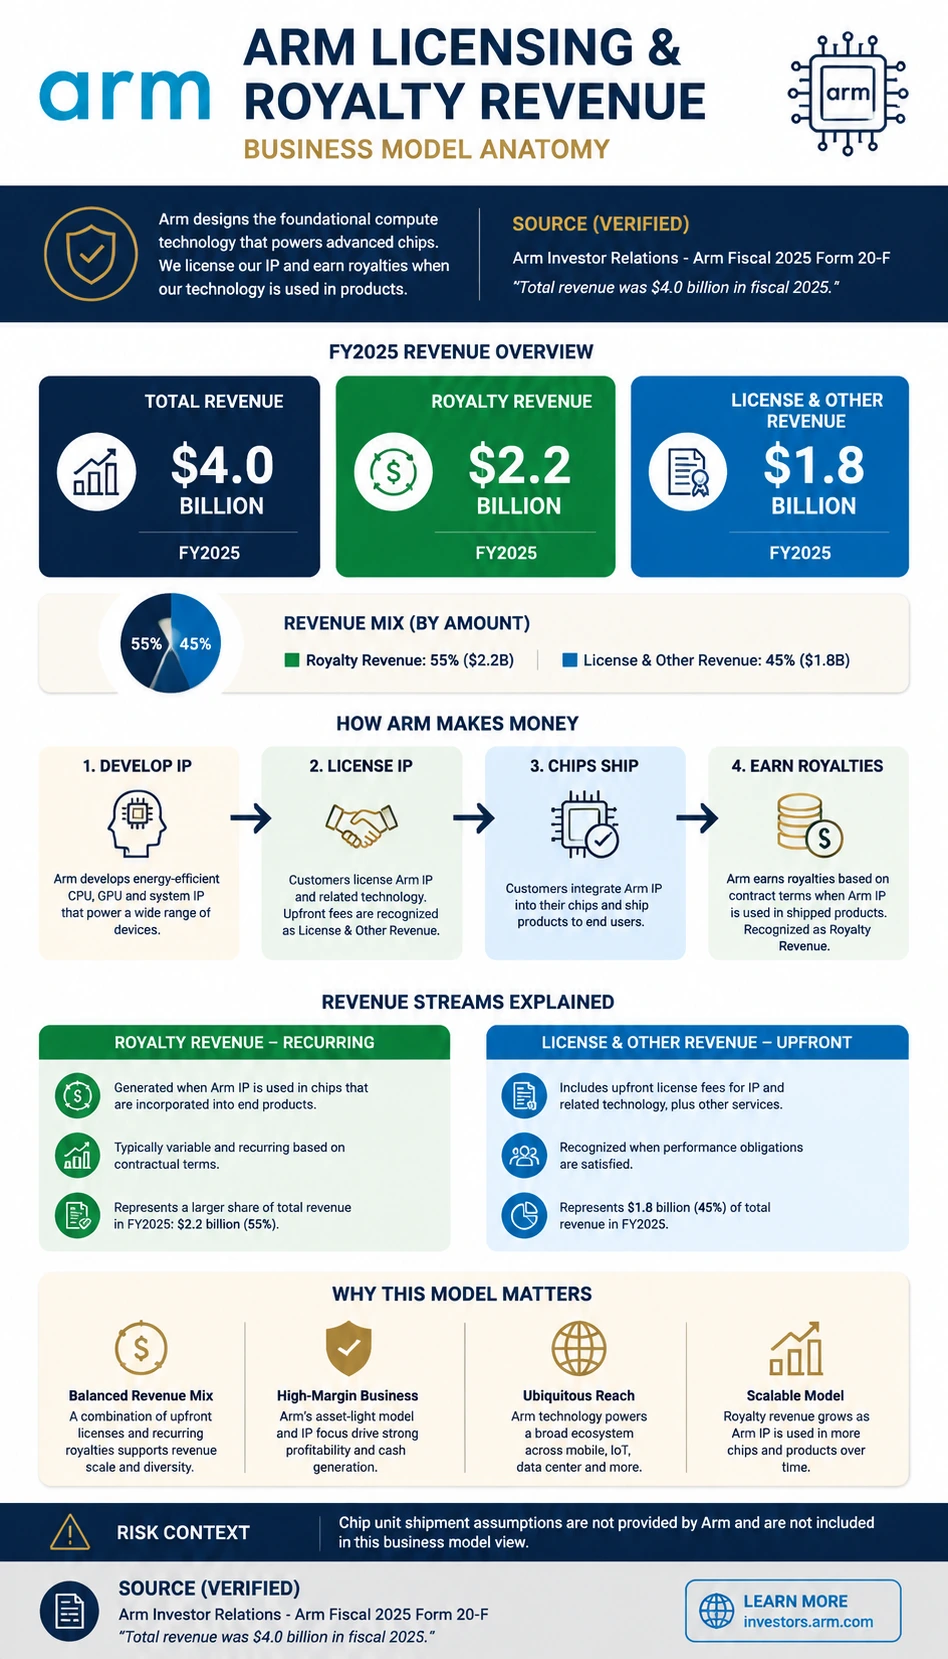
Arm Licensing and Royalty Revenue
A source-backed arm licensing and royalty revenue infographic template for earnings and market report learning.
Open detail page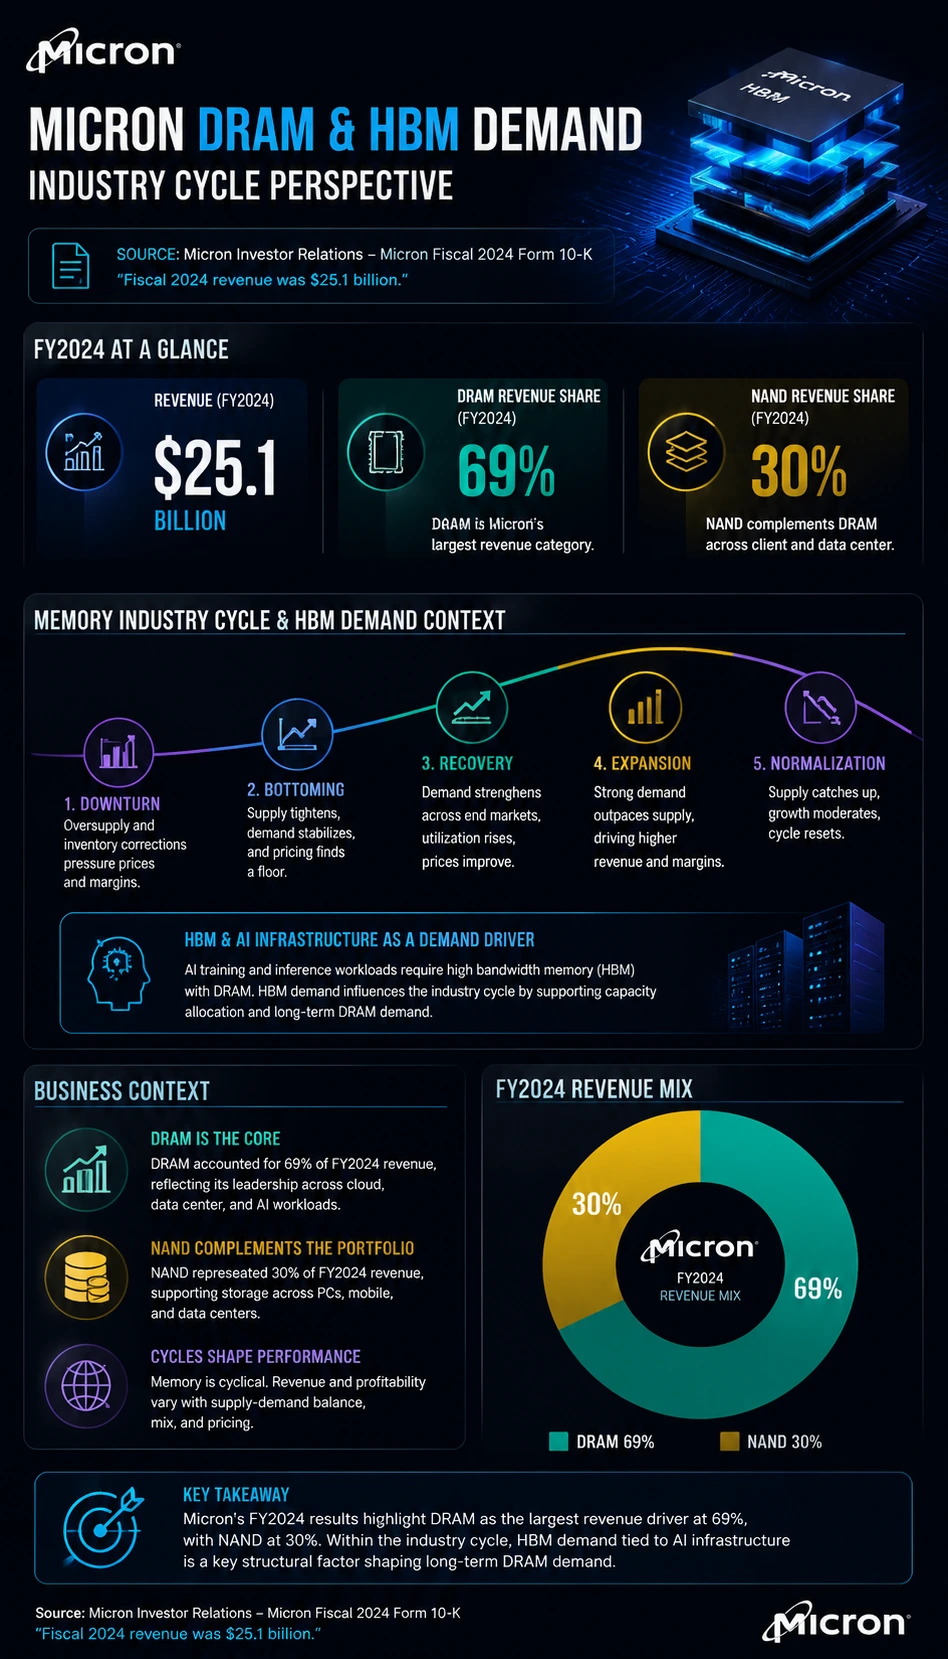
Micron DRAM and HBM Demand
A source-backed micron dram and hbm demand infographic template for earnings and market report learning.
Open detail page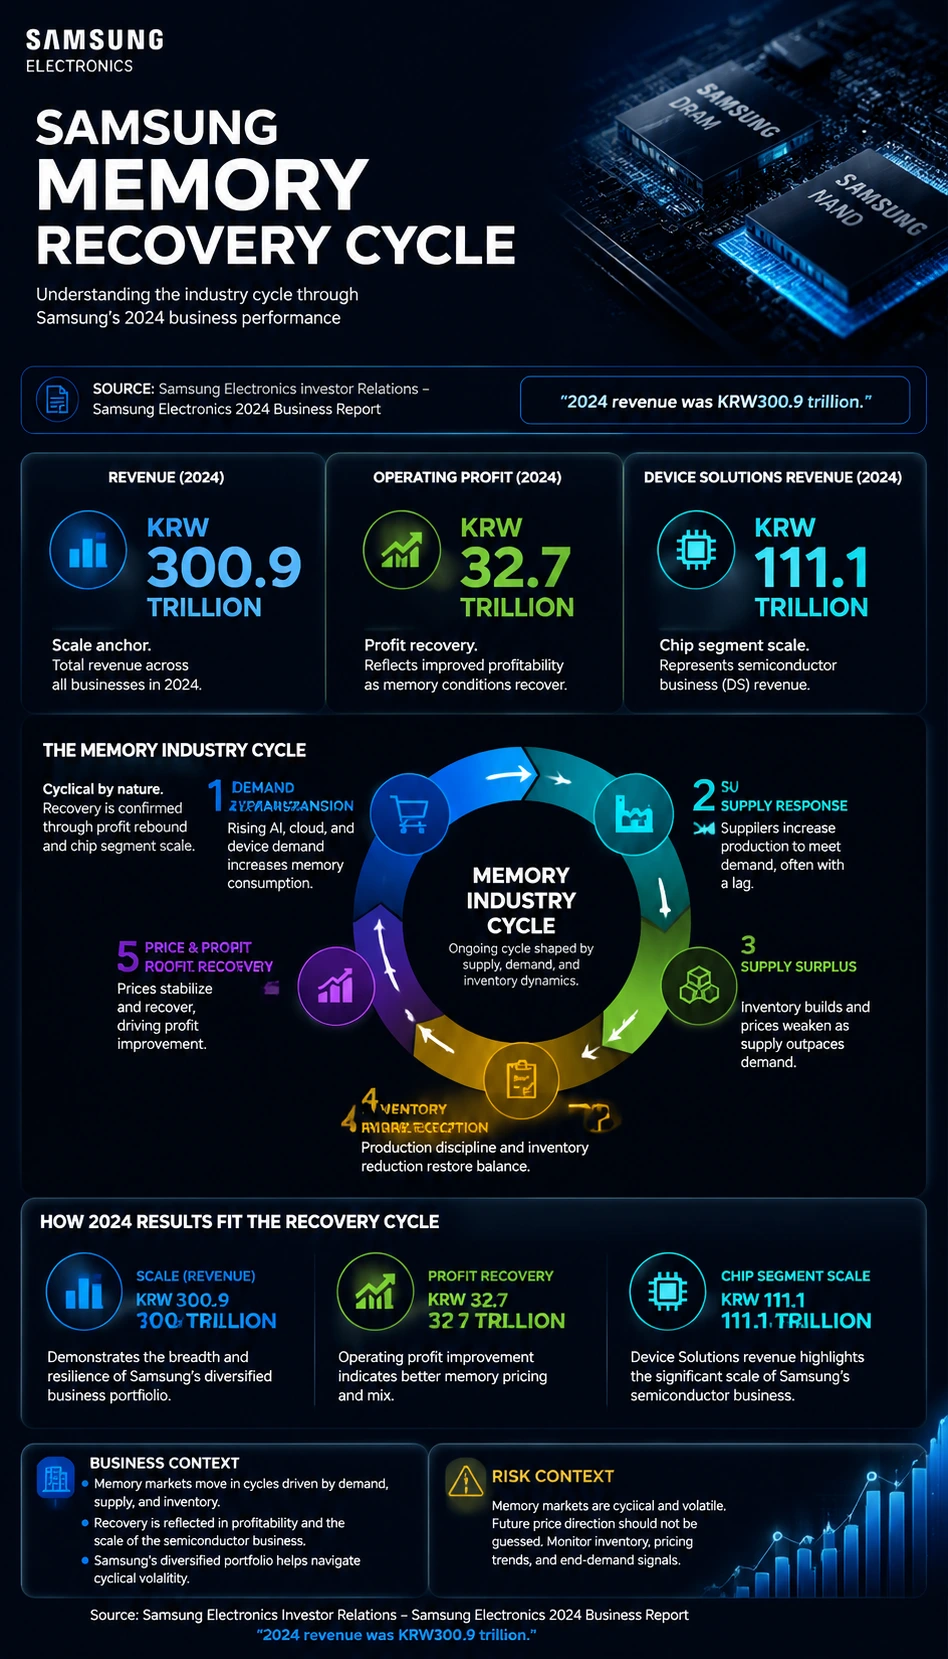
Samsung Memory Recovery Cycle
A source-backed samsung memory recovery cycle infographic template for earnings and market report learning.
Open detail page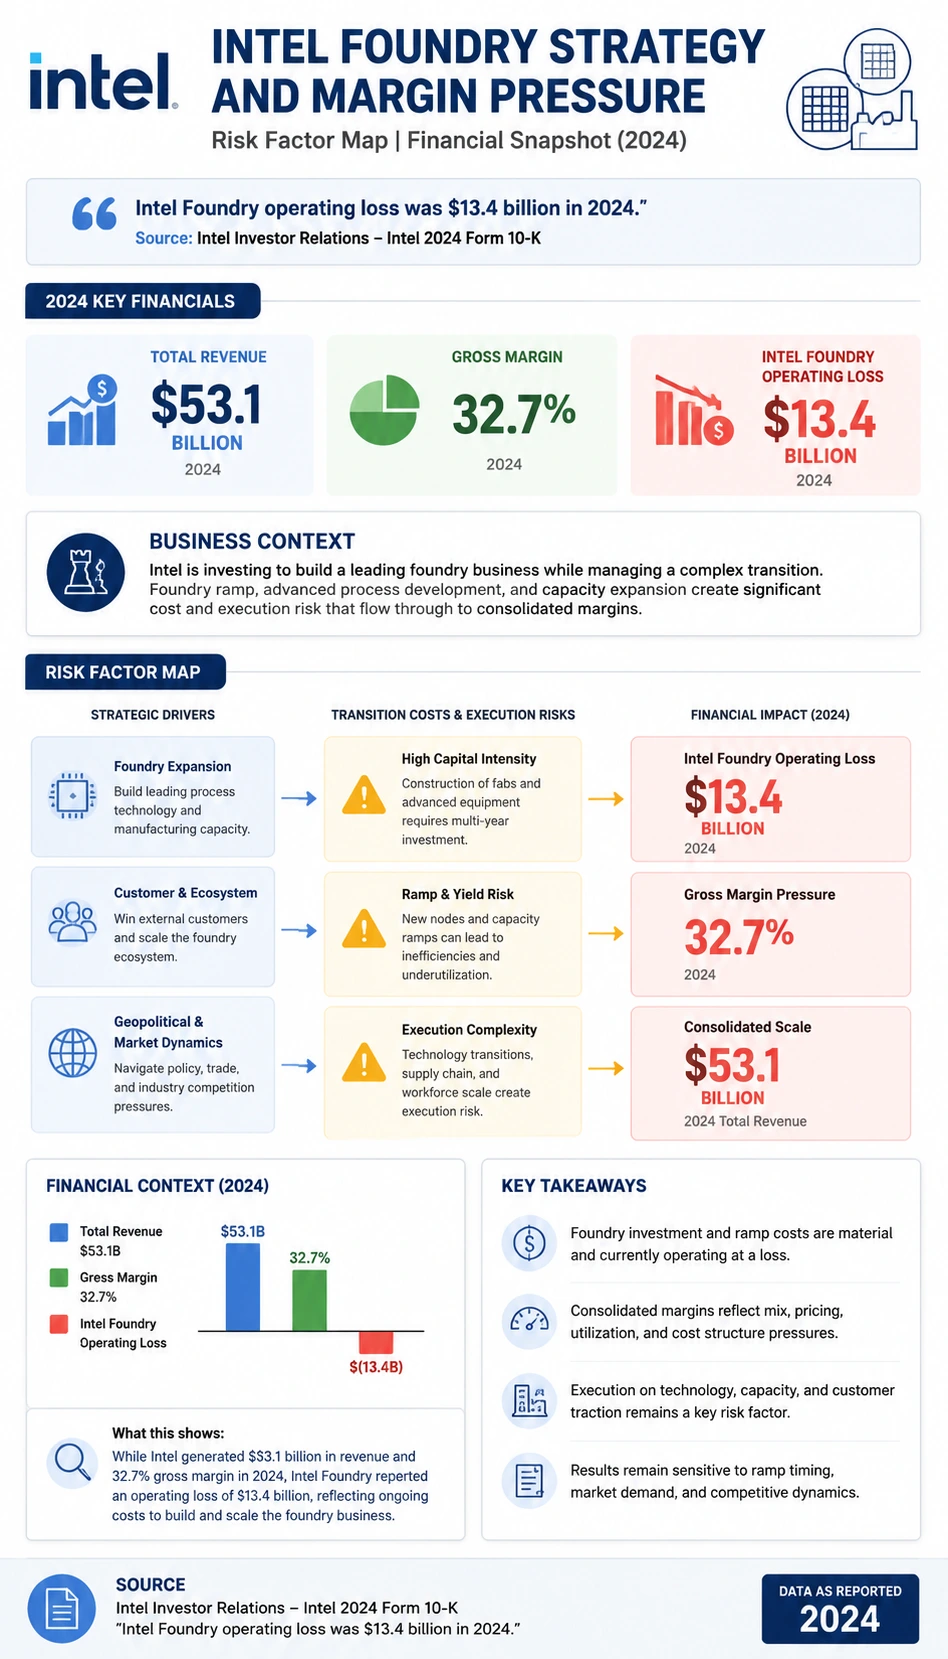
Intel Foundry Strategy and Margin Pressure
A source-backed intel foundry strategy and margin pressure infographic template for earnings and market report learning.
Open detail page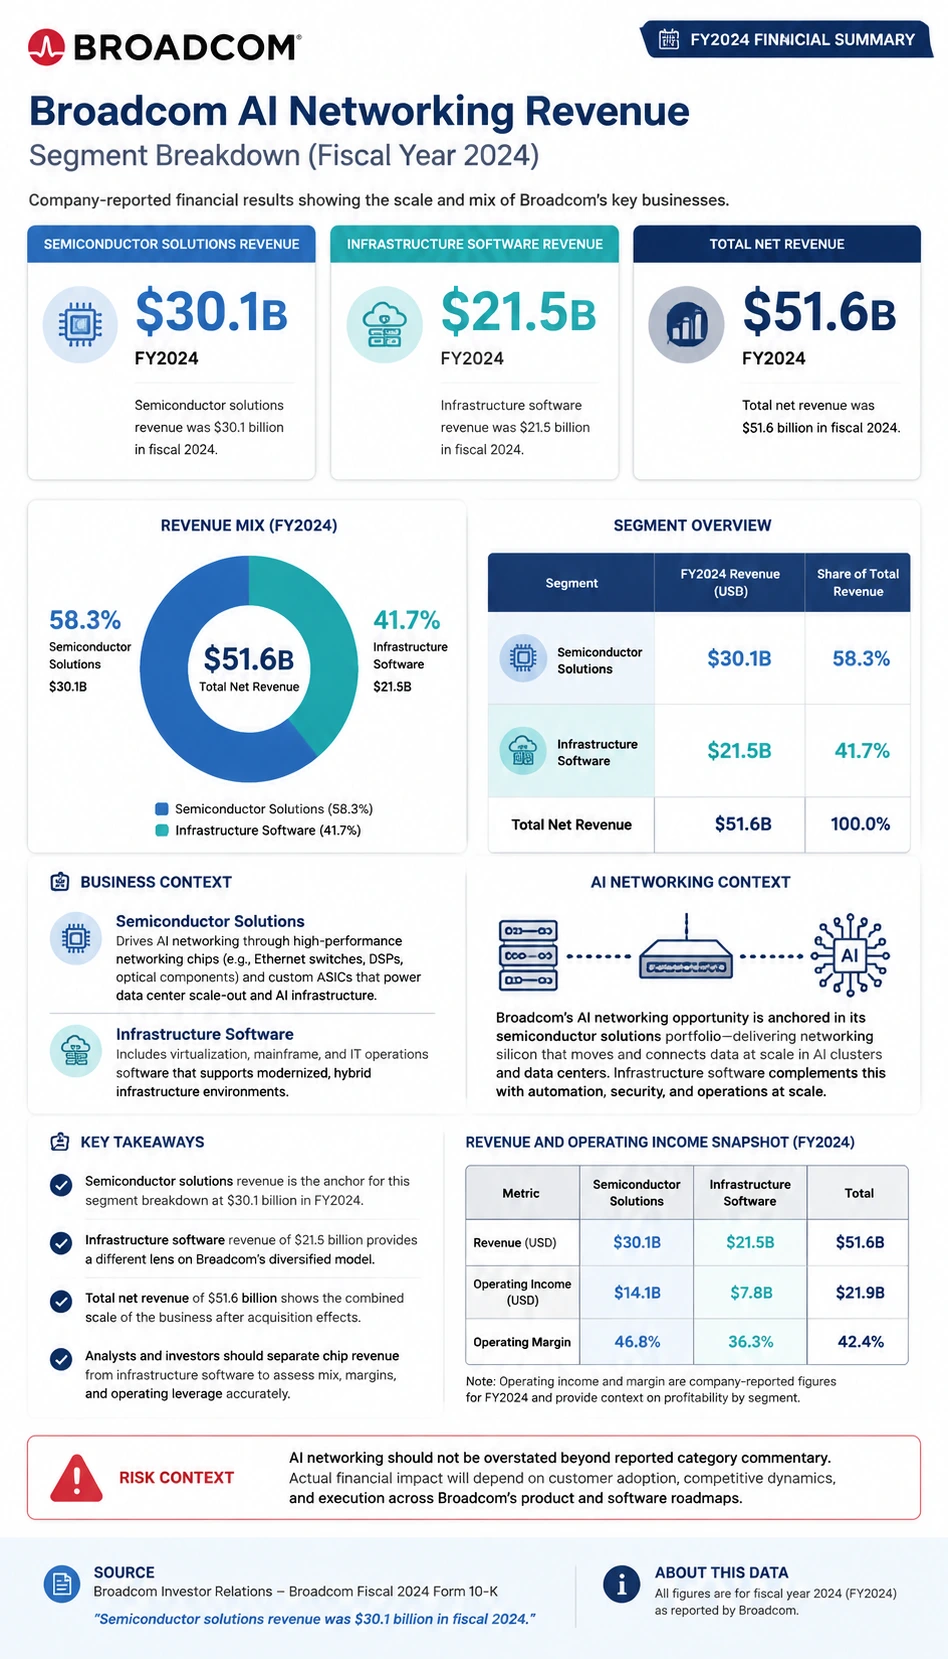
Broadcom AI Networking Revenue
A source-backed broadcom ai networking revenue infographic template for earnings and market report learning.
Open detail page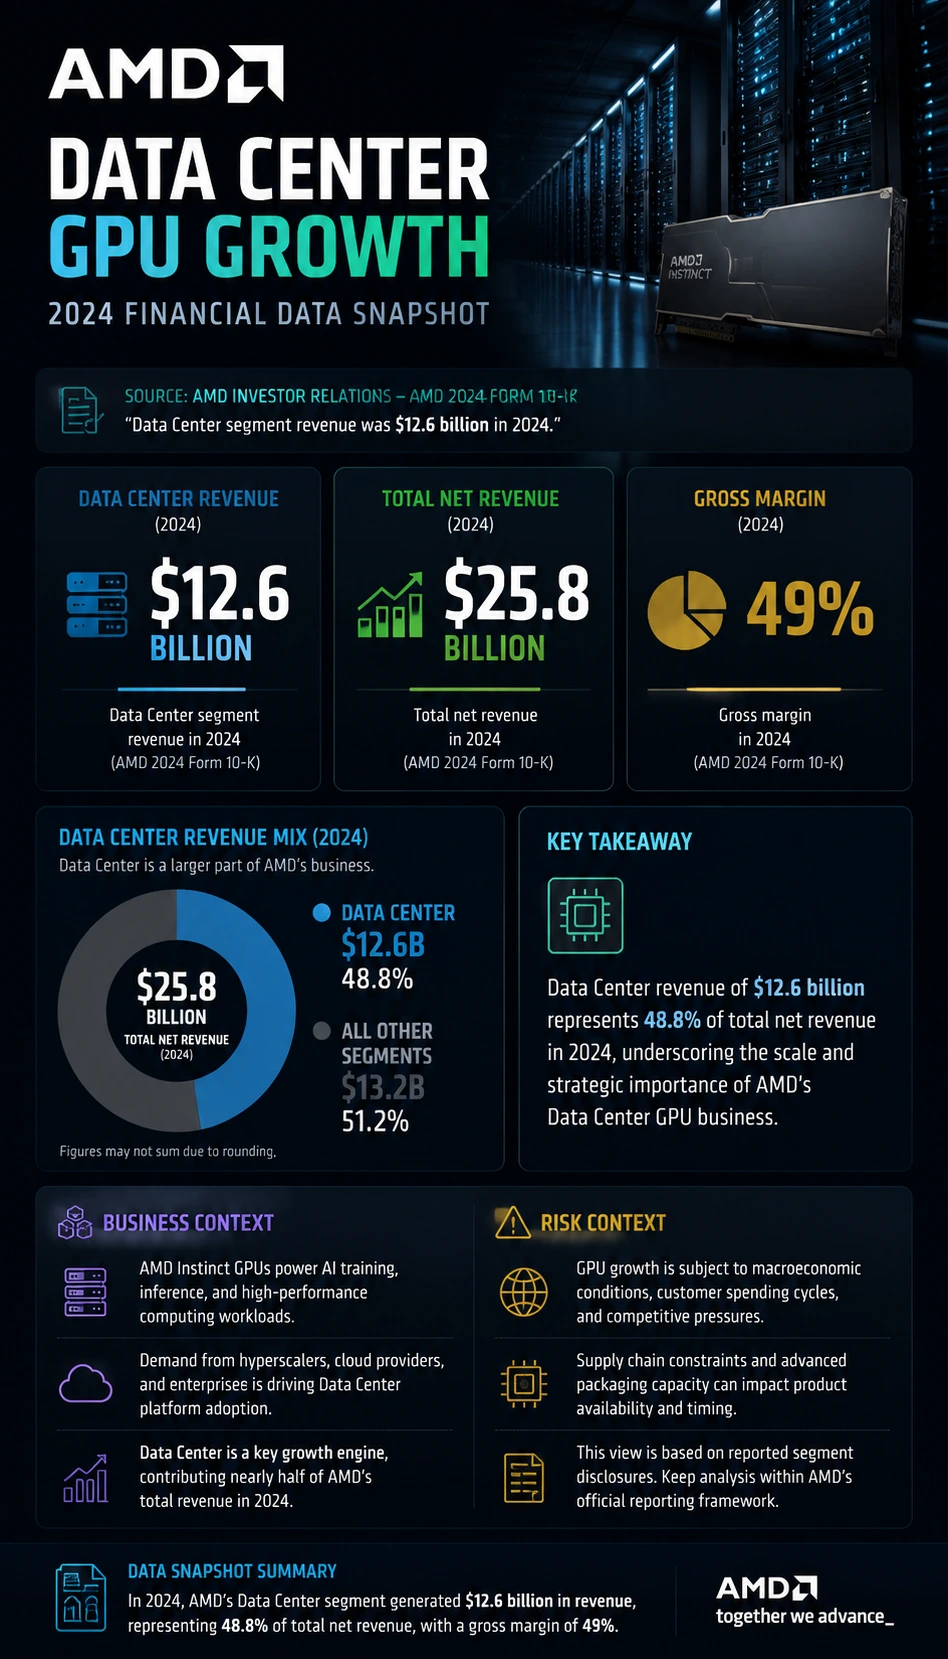
AMD Data Center GPU Growth
A source-backed amd data center gpu growth infographic template for earnings and market report learning.
Open detail page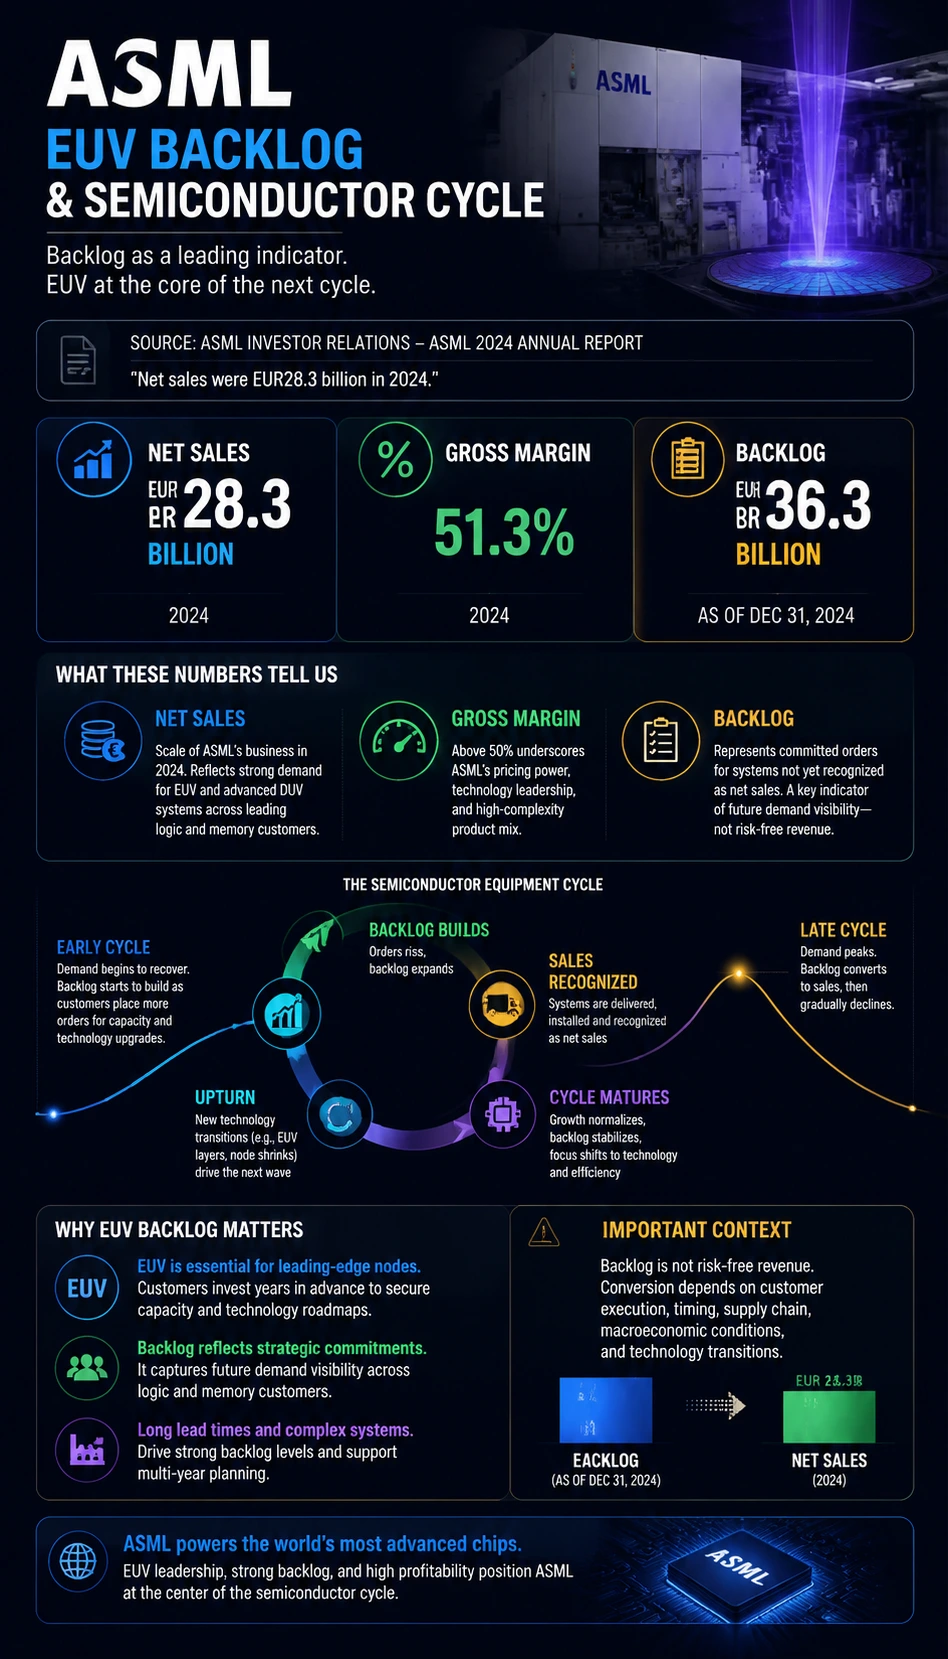
ASML EUV Backlog and Semiconductor Cycle
A source-backed asml euv backlog and semiconductor cycle infographic template for earnings and market report learning.
Open detail page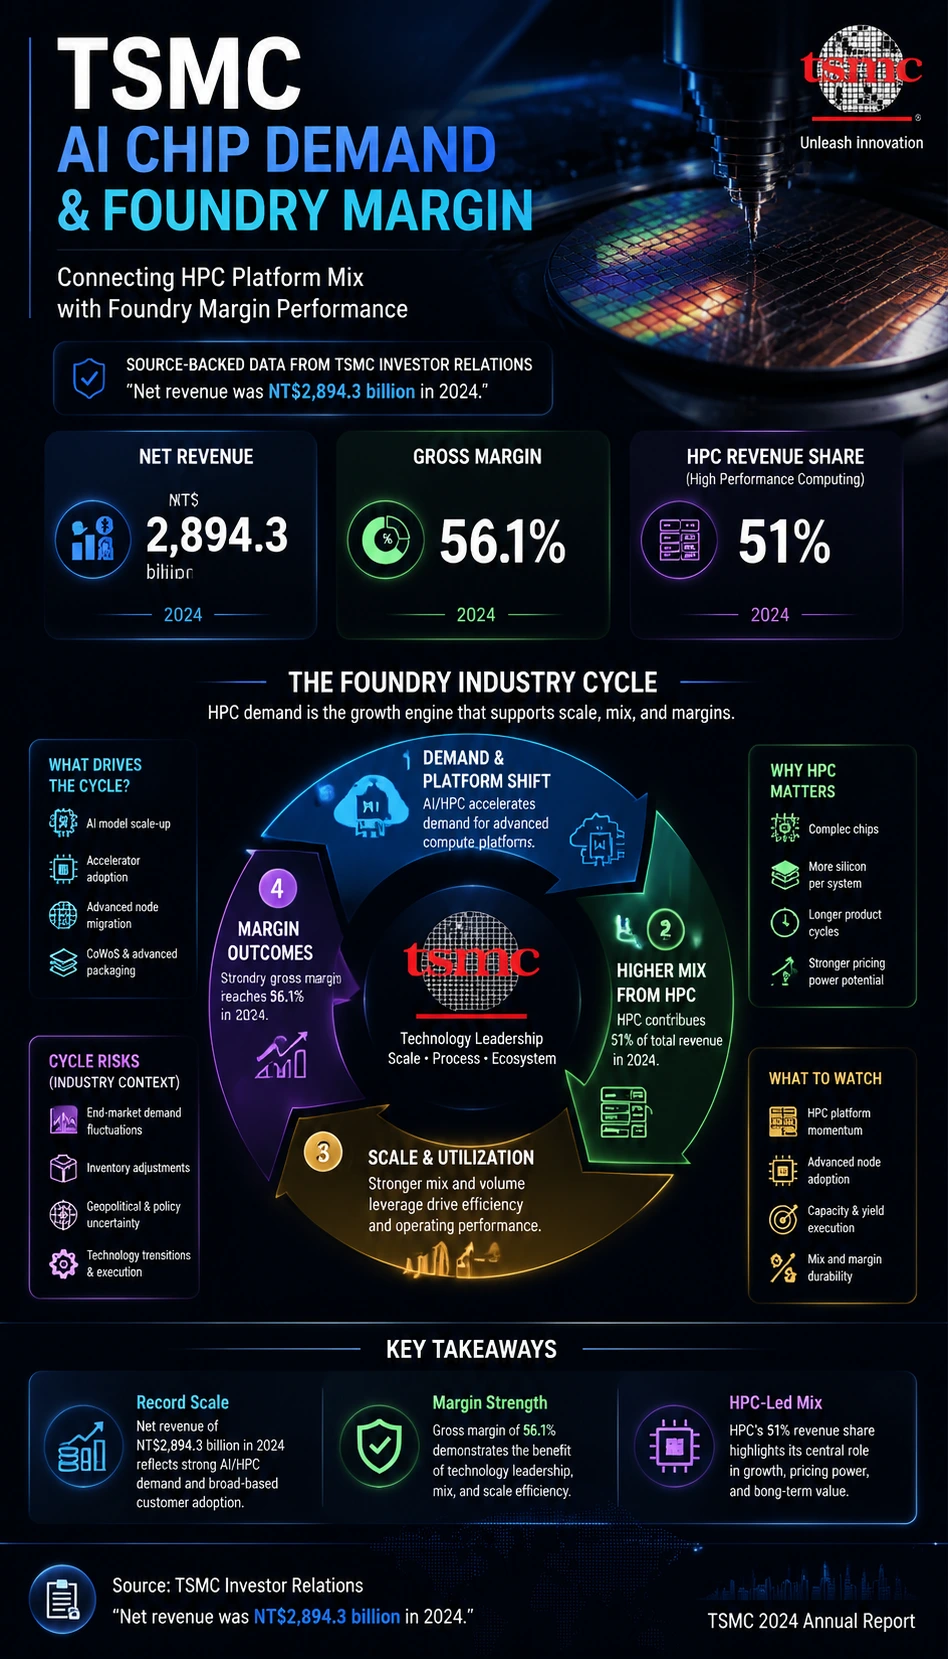
TSMC AI Chip Demand and Foundry Margin
A source-backed tsmc ai chip demand and foundry margin infographic template for earnings and market report learning.
Open detail page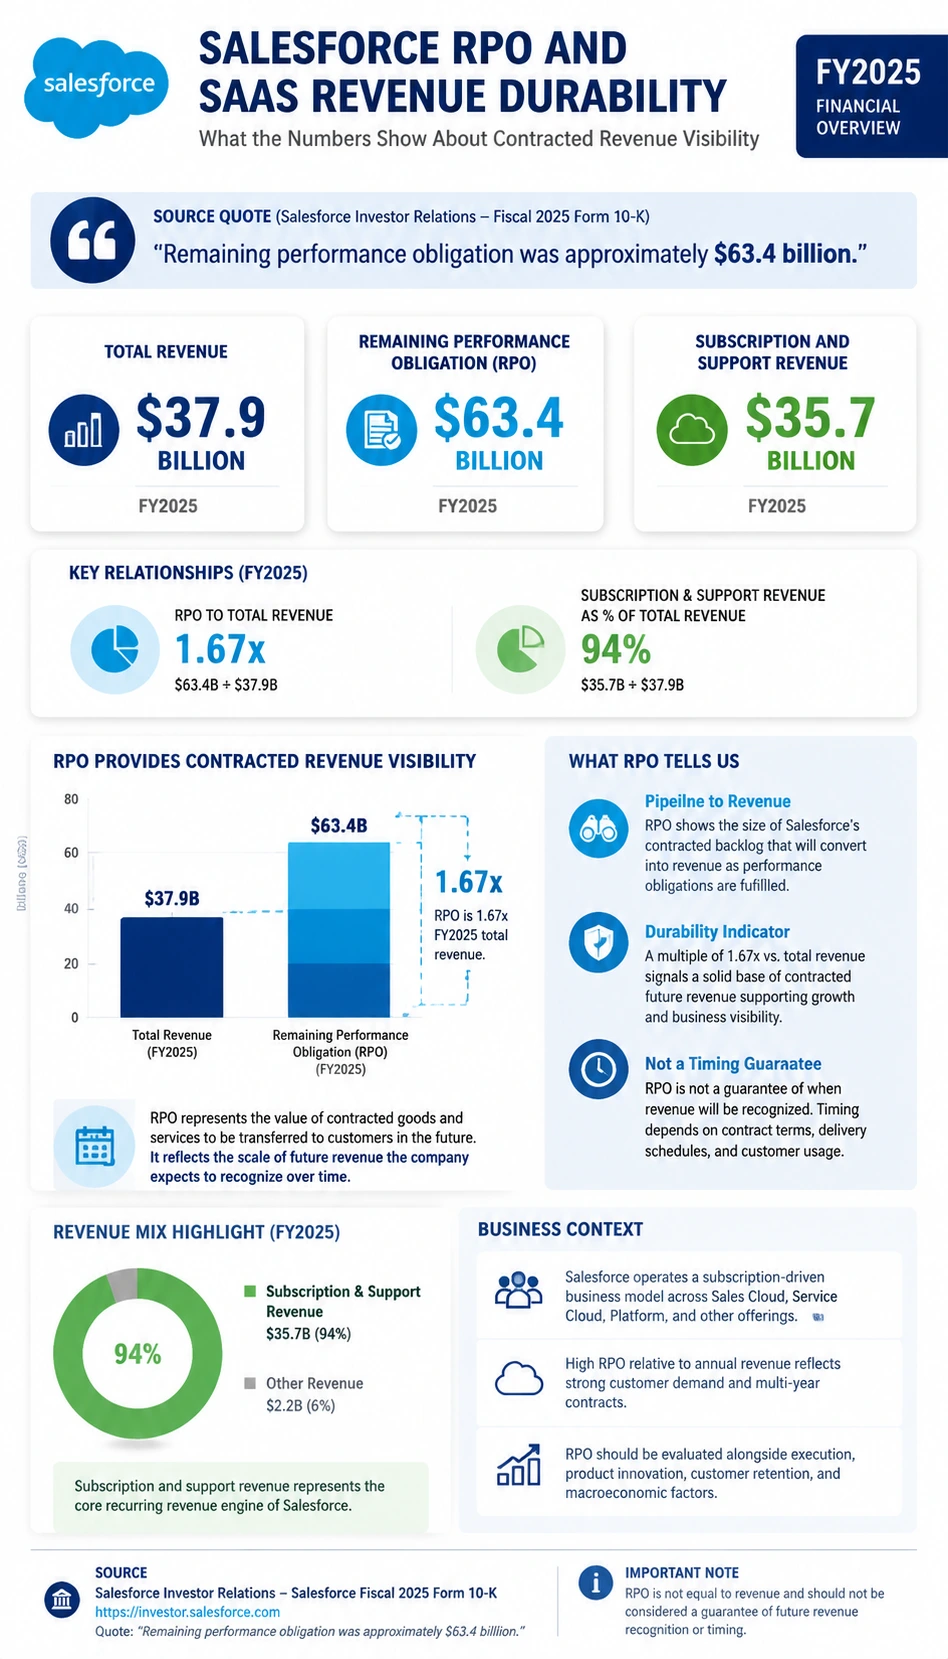
Salesforce RPO and SaaS Revenue Durability
A source-backed salesforce rpo and saas revenue durability infographic template for earnings and market report learning.
Open detail page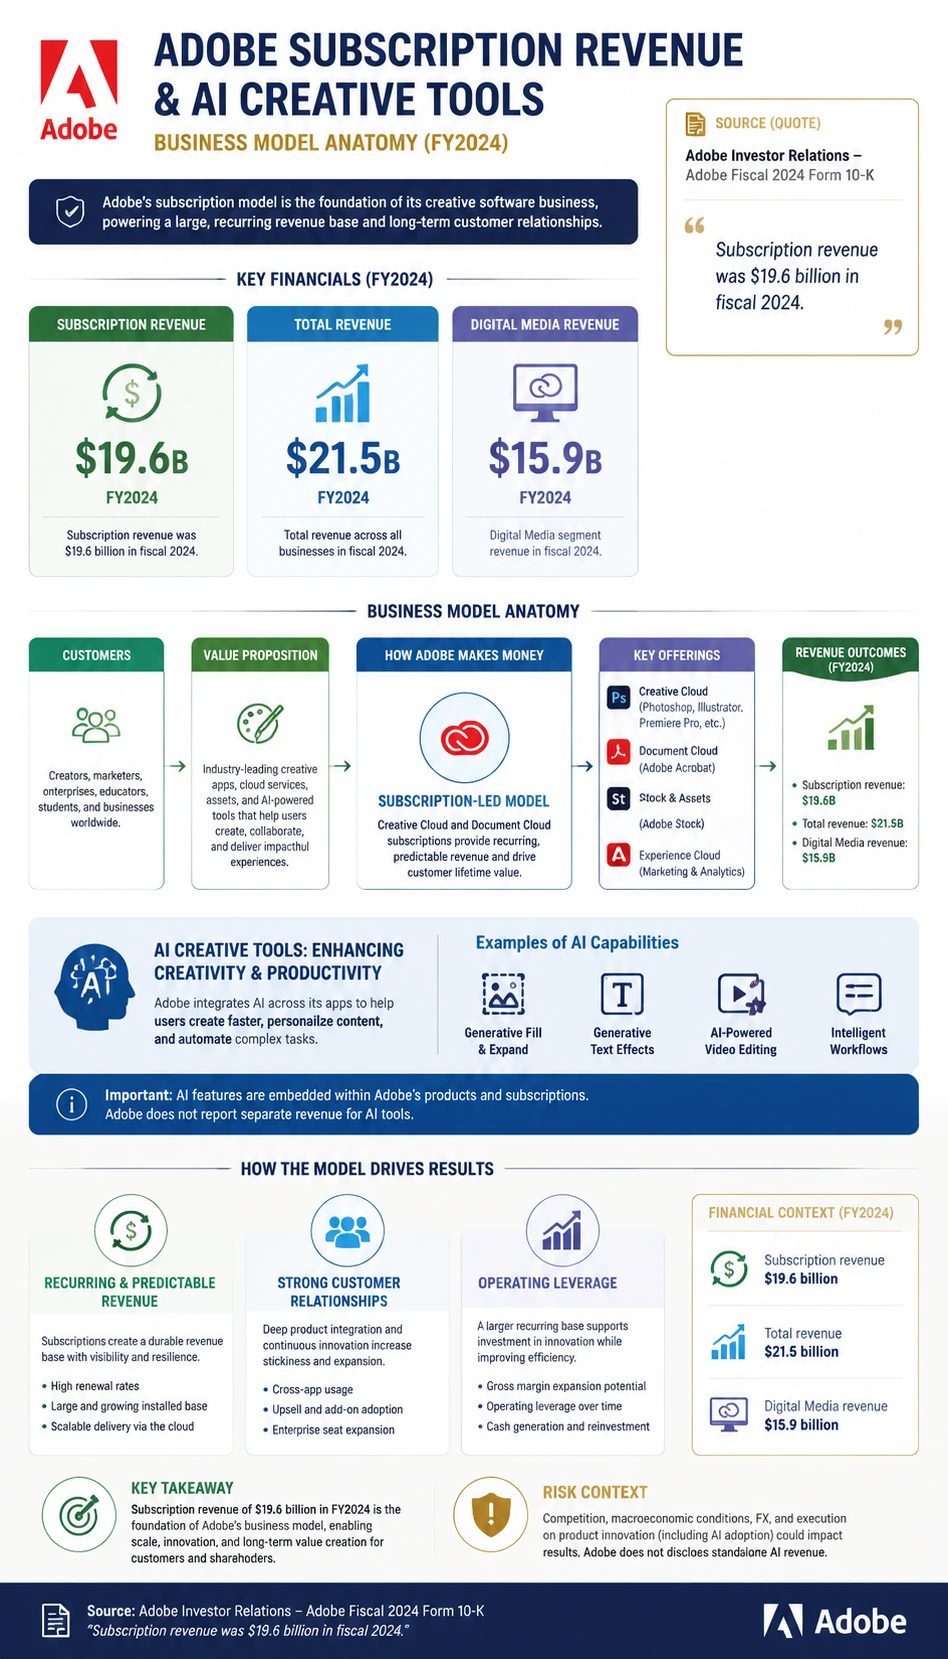
Adobe Subscription Revenue and AI Creative Tools
A source-backed adobe subscription revenue and ai creative tools infographic template for earnings and market report learning.
Open detail page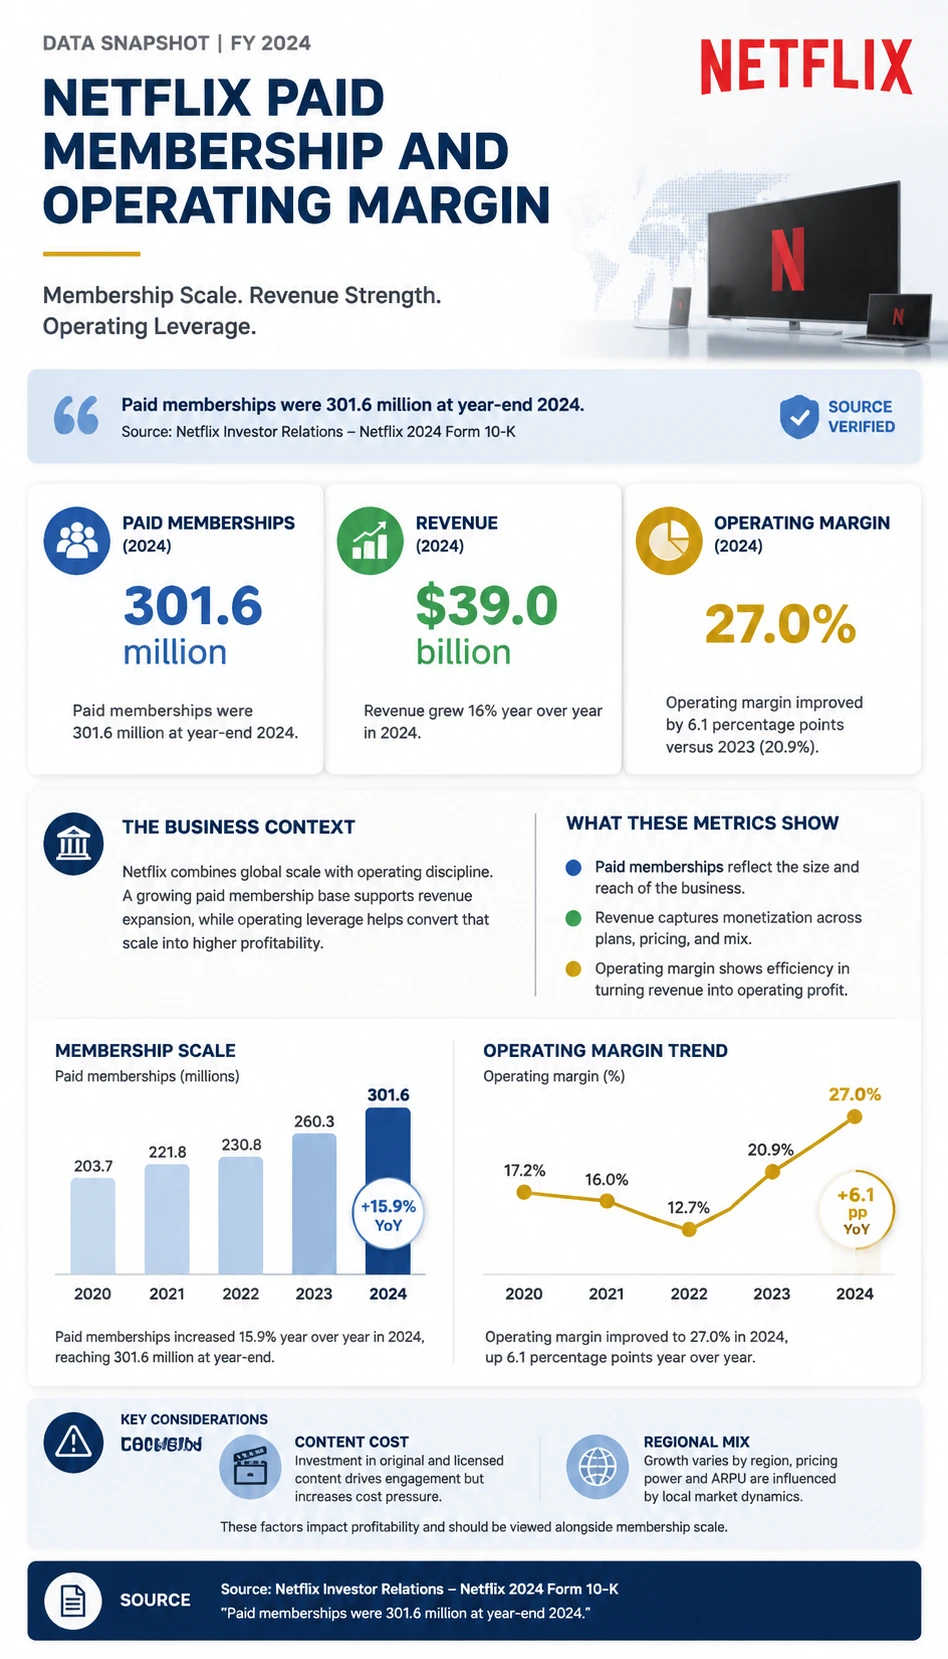
Netflix Paid Membership and Operating Margin
A source-backed netflix paid membership and operating margin infographic template for earnings and market report learning.
Open detail page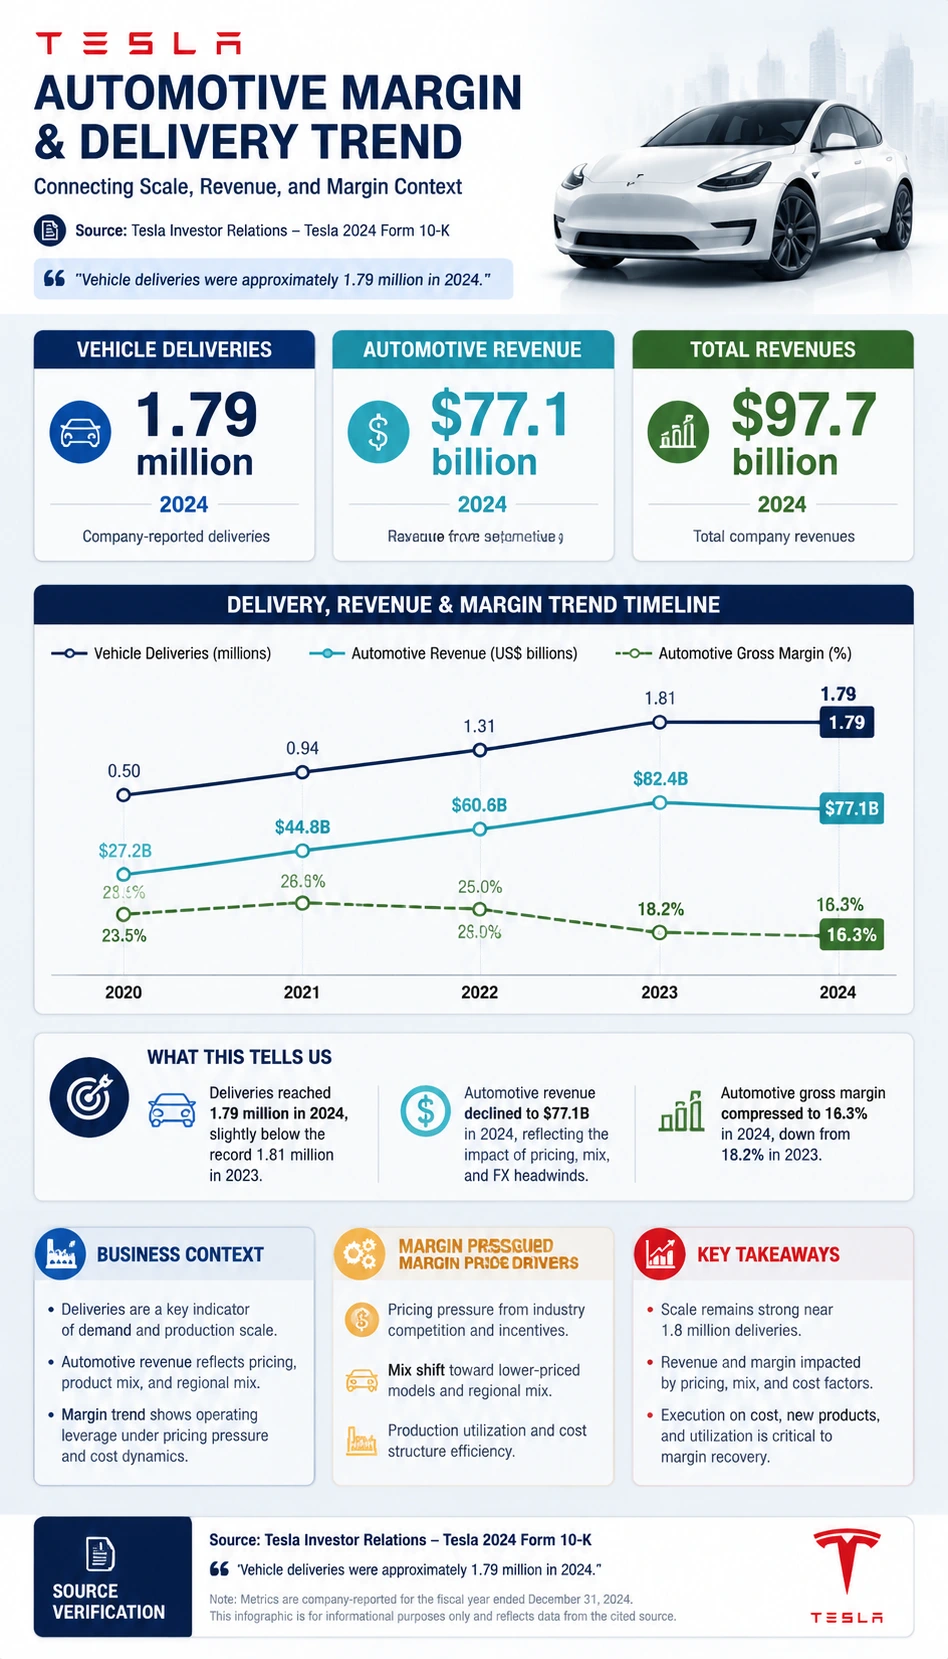
Tesla Automotive Margin and Delivery Trend
A source-backed tesla automotive margin and delivery trend infographic template for earnings and market report learning.
Open detail page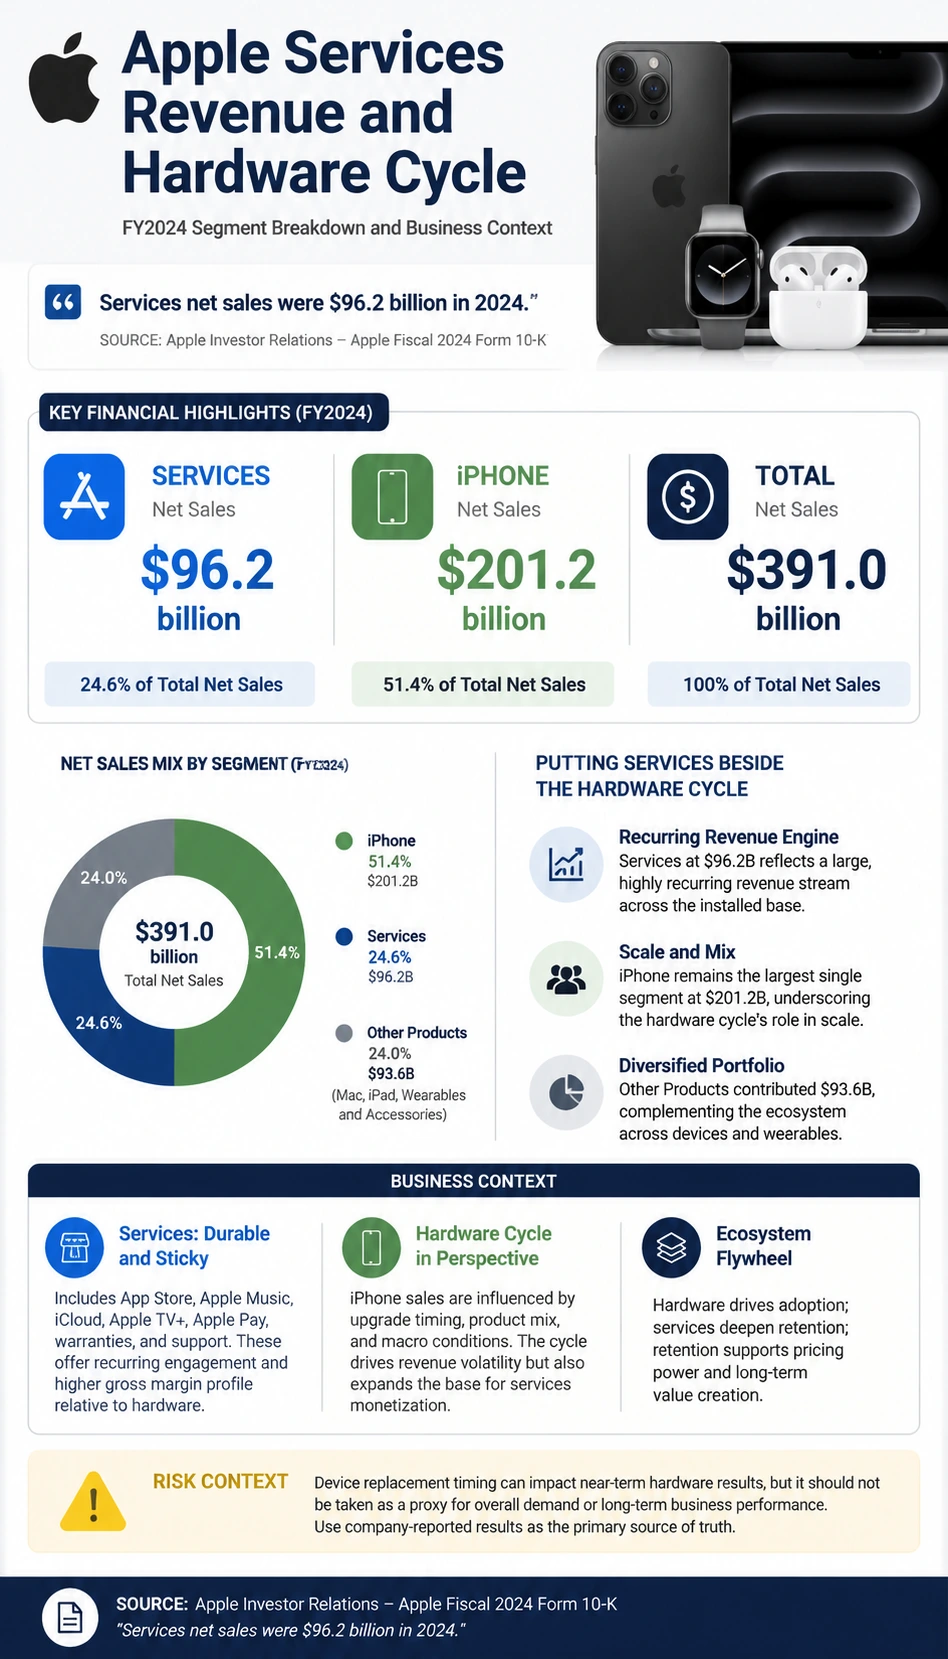
Apple Services Revenue and Hardware Cycle
A source-backed apple services revenue and hardware cycle infographic template for earnings and market report learning.
Open detail page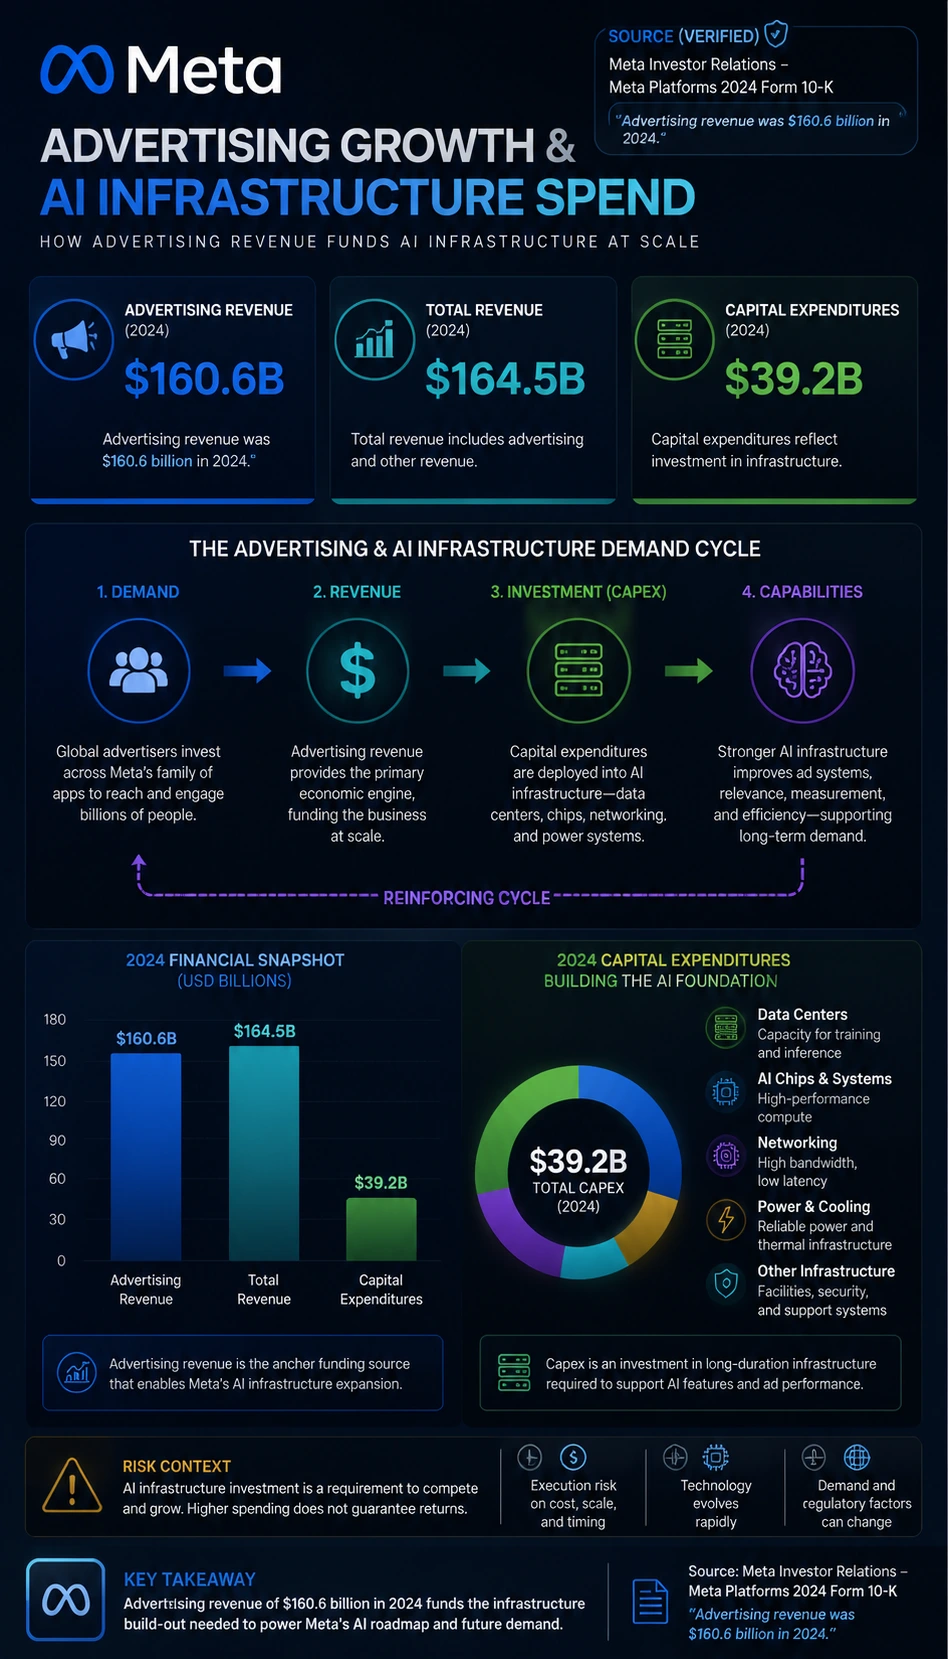
Meta Advertising Growth and AI Infrastructure Spend
A source-backed meta advertising growth and ai infrastructure spend infographic template for earnings and market report learning.
Open detail page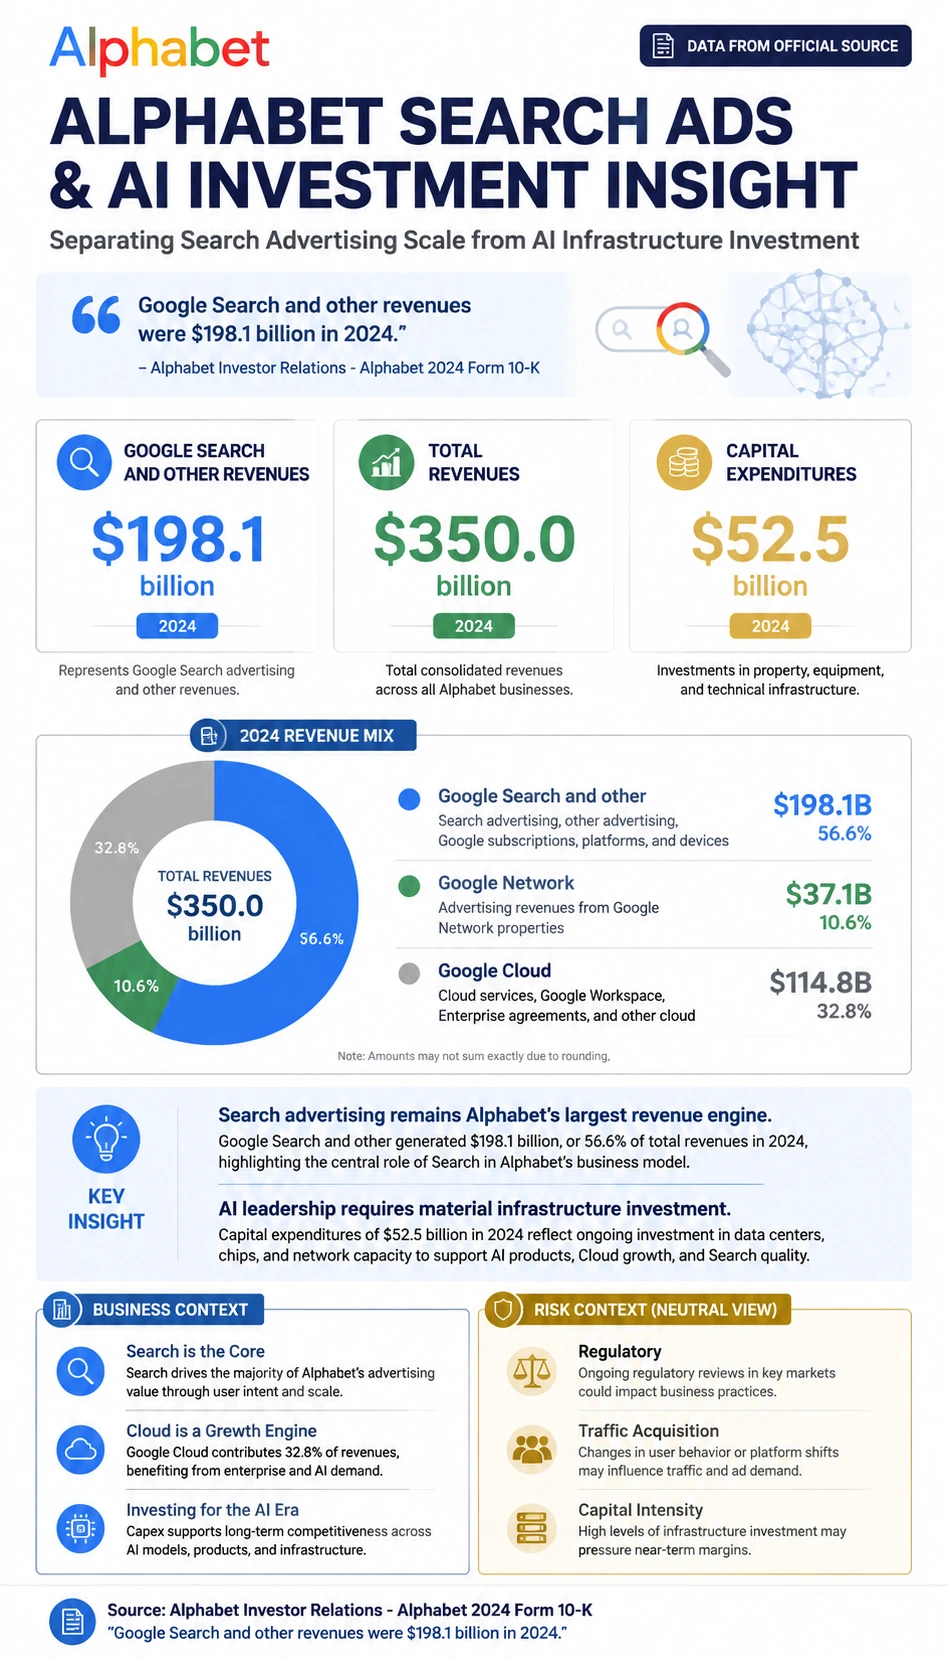
Alphabet Search Ads and AI Investment Insight
A source-backed alphabet search ads and ai investment insight infographic template for earnings and market report learning.
Open detail page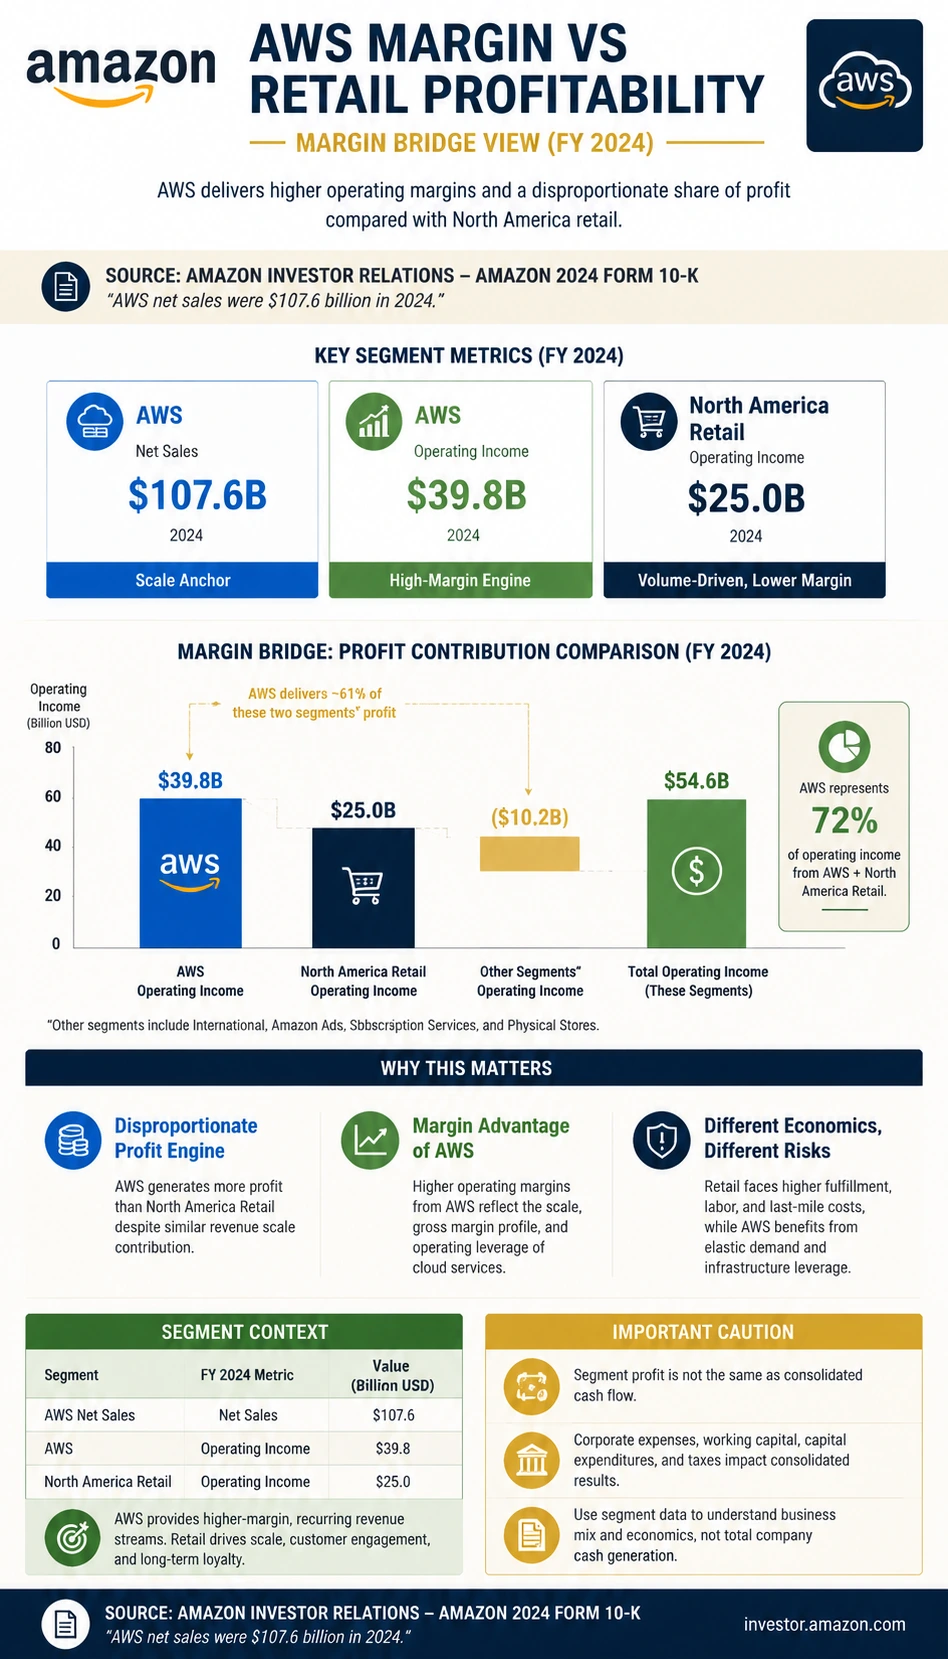
Amazon AWS Margin vs Retail Profitability
A source-backed amazon aws margin vs retail profitability infographic template for earnings and market report learning.
Open detail page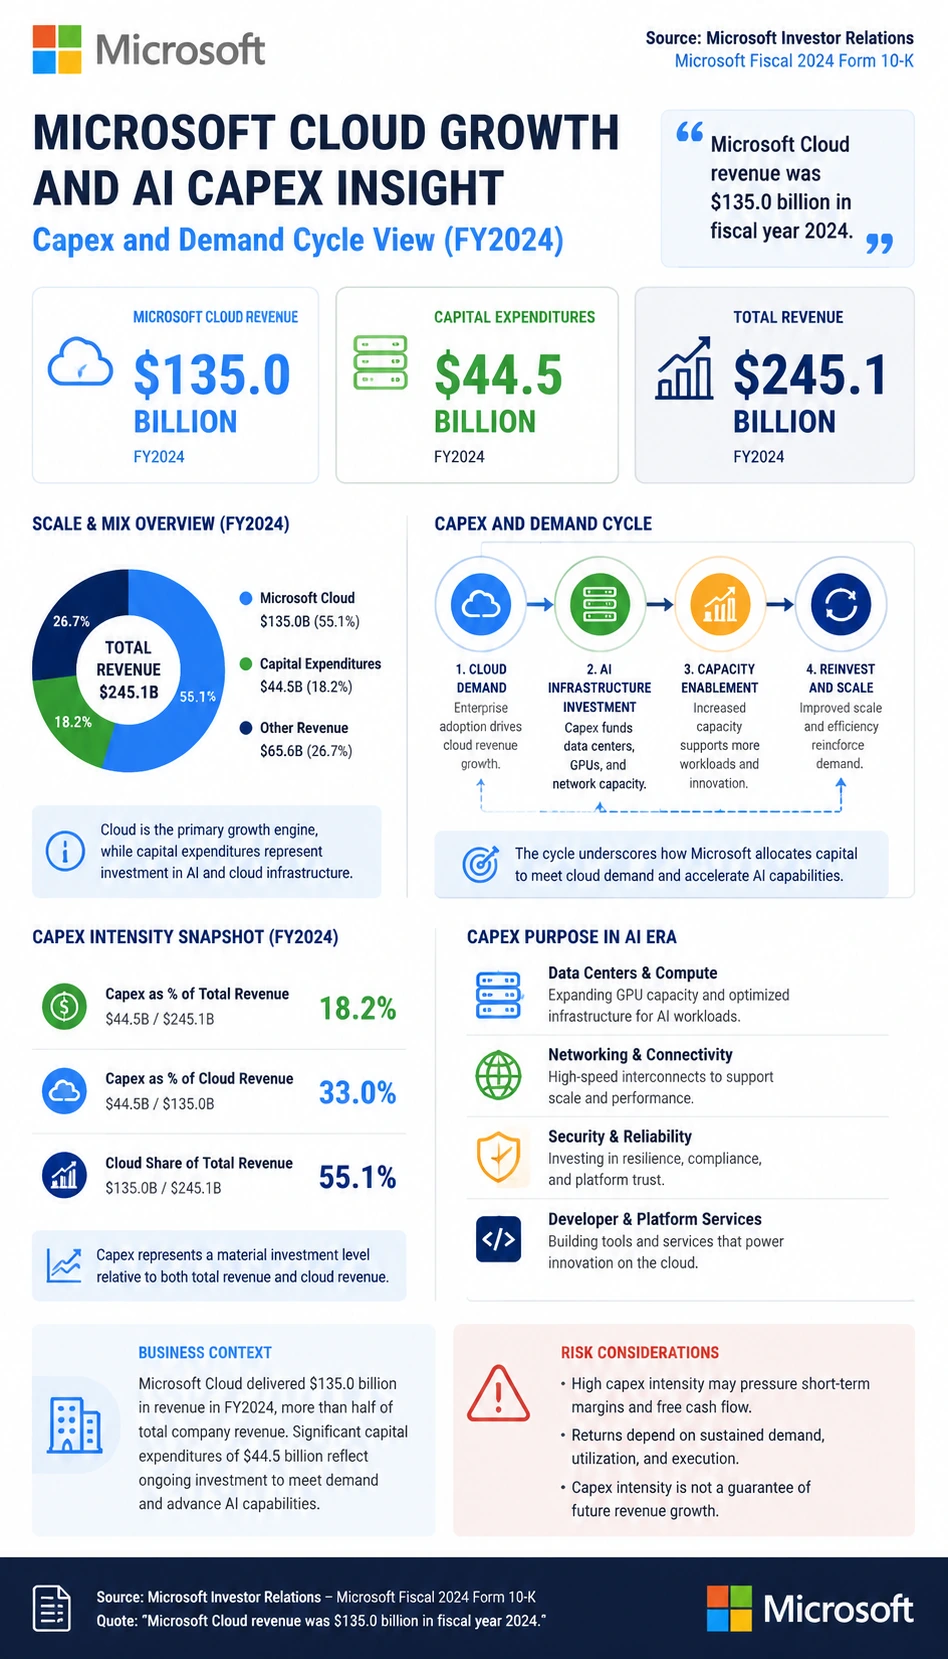
Microsoft Cloud Growth and AI Capex Insight
A source-backed microsoft cloud growth and ai capex insight infographic template for earnings and market report learning.
Open detail page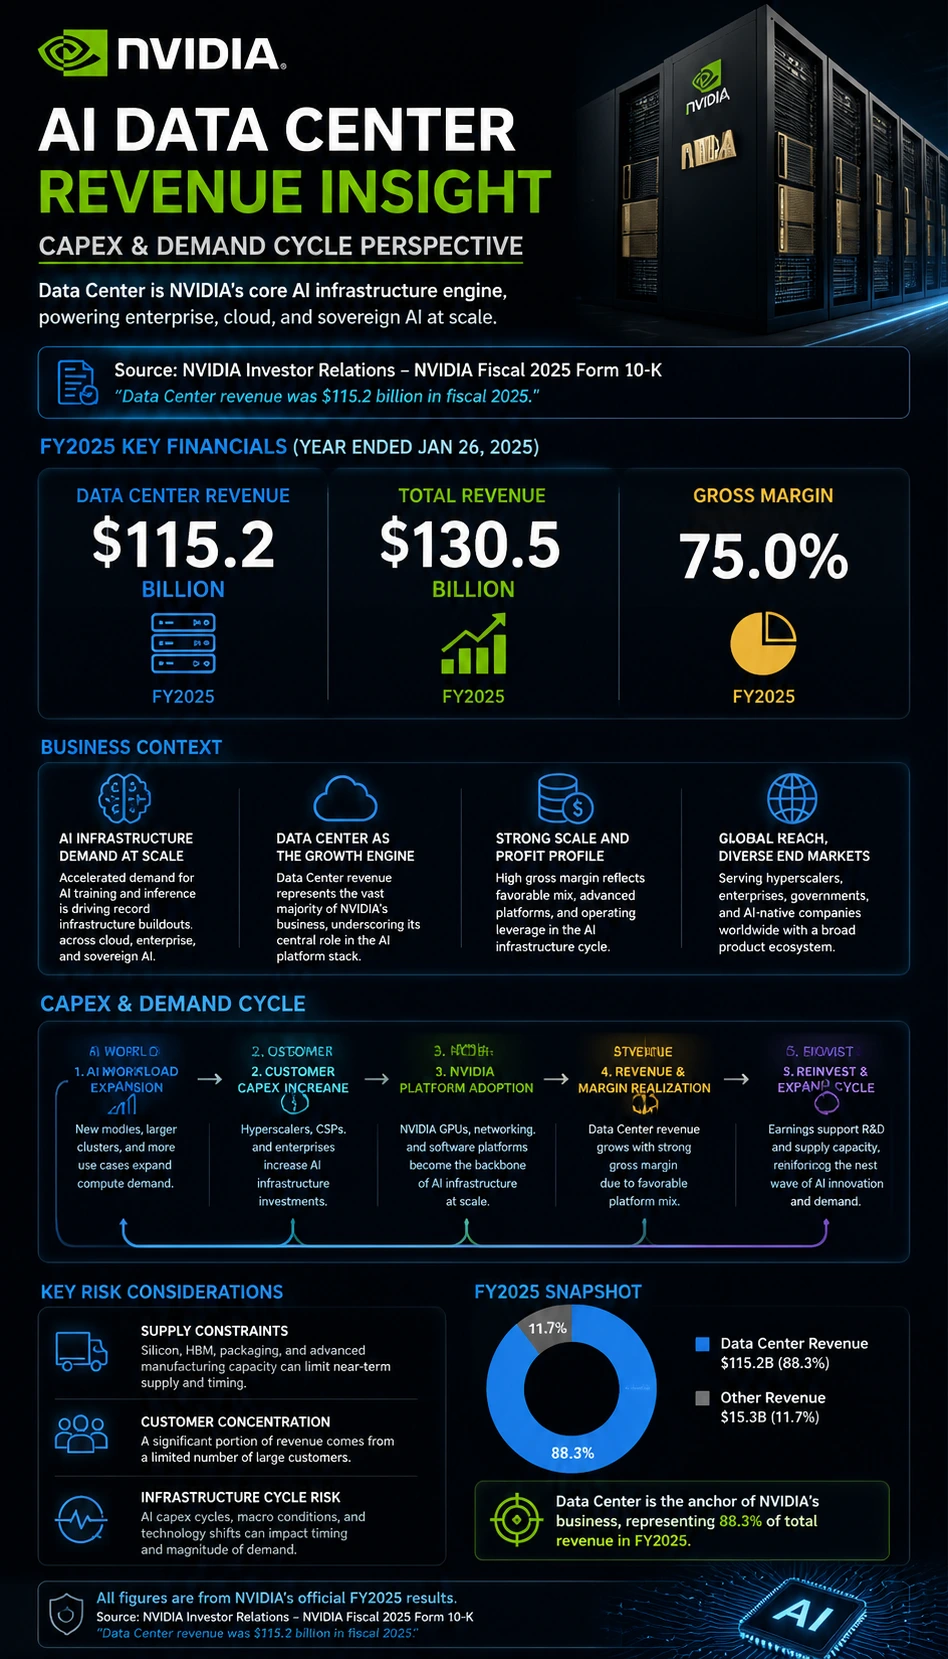
Nvidia AI Data Center Revenue Insight
A source-backed nvidia ai data center revenue insight infographic template for earnings and market report learning.
Open detail pageWhy this category works for search and discovery
These public example pages are built to do more than show an image. Each linked detail page adds a unique title, descriptive copy, image alt text, knowledge points, a create-similar action, and internal links back into the KnowLens example library. That gives both users and search engines a clearer understanding of what each visual covers.