About this industry report infographic
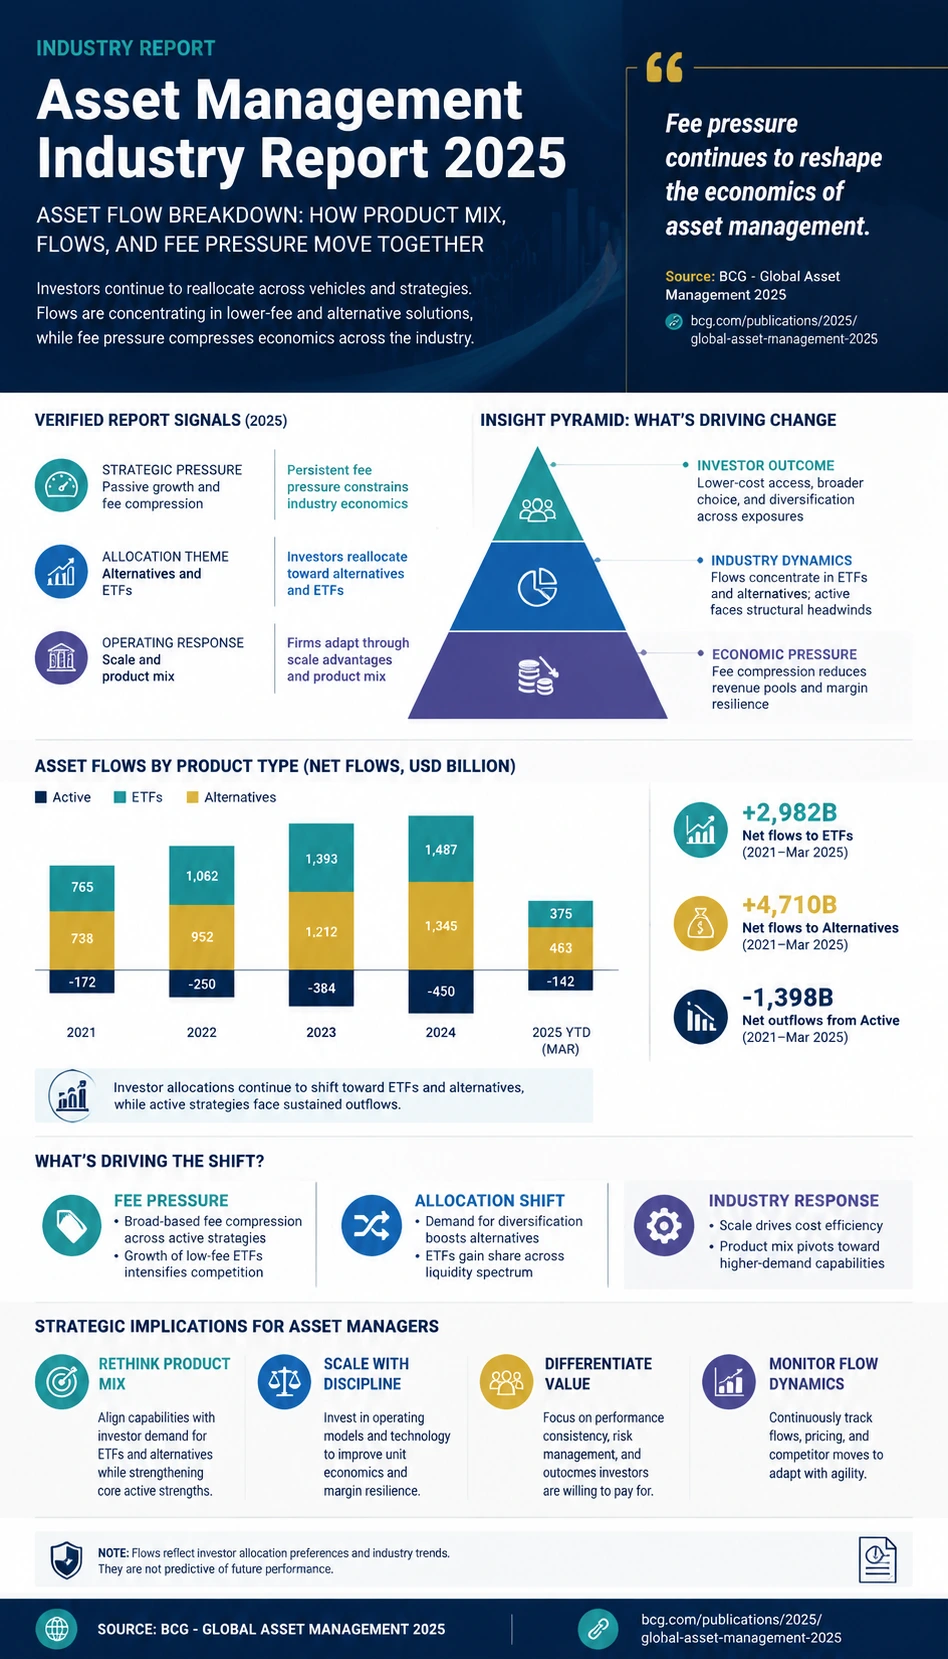
This Asset Management Industry Report poster turns BCG's Global Asset Management 2025 into a source-aware visual built for faster reading and stronger context. Instead of repeating the report verbatim, the poster separates the short direct quote from the original explanation, organizes verified report signals into a asset flow breakdown layout, and highlights what matters most for asset management readers: structure, pressure points, and key directional shifts. As an AI Infographic Generator, it helps teams, analysts, students, and creators understand the report's core message on mobile and desktop without drifting into investment advice or unsupported claims.
Template details
- Topic
- Asset Management Industry Report
- Industry
- Asset Management
- Aspect ratio
- 9:16
- Structure
- asset flow breakdown
- Style
- Consulting Insight Style
- Download
- Disabled
Key learning points
- The report treats strategic pressure as a lead indicator rather than a side statistic.
- The chosen asset flow breakdown layout helps separate drivers, bottlenecks, and outcomes instead of collapsing them into one summary box.
- Allocation theme adds a second lens, helping readers see how the report balances scale with operating context.
- The short quote works as a report anchor, not as the whole narrative; the interpretation remains separate and structured.
- Operating response gives the poster a third source-backed dimension so the topic does not read like a single-metric claim.
- The poster keeps one risk note visible: avoid turning flow patterns into a recommendation for any asset class.
Source and report signals
BCG's Global Asset Management 2025 is used as the primary report source for this asset management visual. The infographic keeps the direct quote short and separate from the original explanation, then translates report-backed signals such as strategic pressure and allocation theme into a structured asset flow breakdown view that helps readers understand industry direction, operating pressure, and system context without copying long source text.
Source: BCG- Strategic pressure
- Passive growth and fee compression
- 2025
- Allocation theme
- Alternatives and ETFs
- 2025
- Operating response
- Scale and product mix
- 2025
Create a similar industry report infographic
Use this prepared prompt to create a similar report-backed industry poster with KnowLens AI. The prompt keeps the source-aware framing, quote discipline, layout direction, and mobile-readable hierarchy aligned with this example.
Create similar infographic