Industry Report Infographic Template

Automotive Industry Report Poster Template

A source-aware automotive infographic poster template built from McKinsey's report findings.

Automotive industry report infographic poster
Automotive Industry Report poster created from a verified professional report source with KnowLens AI.
Aspect 9:16Consulting Insight StyleDownload disabled

About this industry report infographic

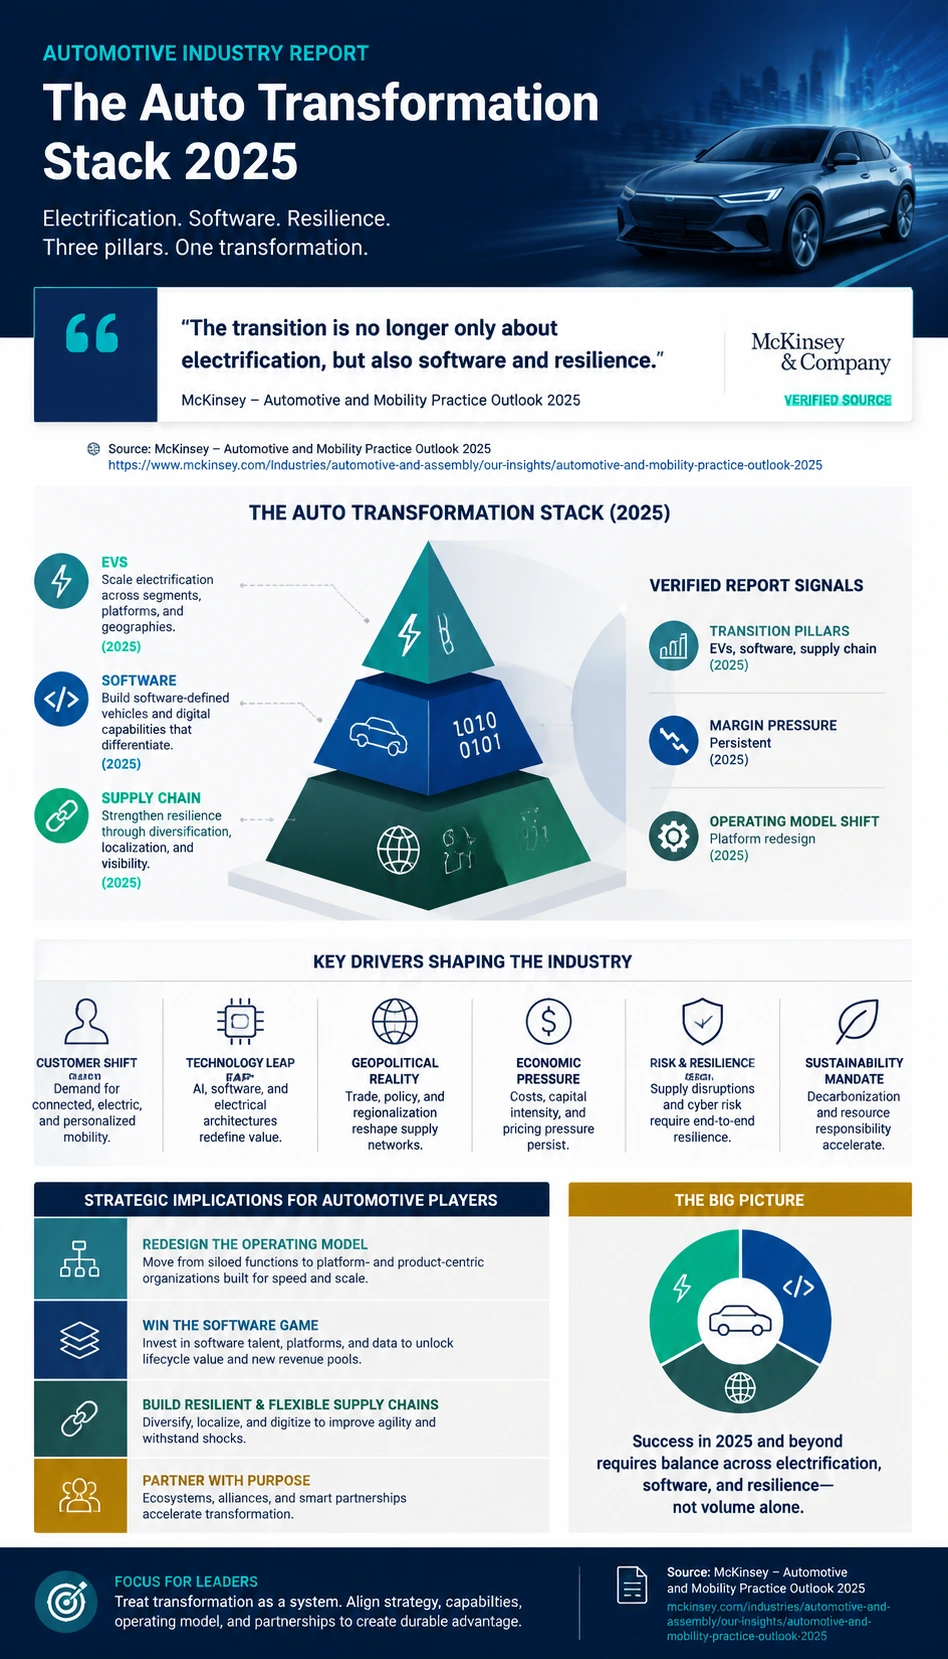
This Automotive Industry Report poster turns McKinsey's Automotive and Mobility Practice Outlook 2025 into a source-aware visual built for faster reading and stronger context. Instead of repeating the report verbatim, the poster separates the short direct quote from the original explanation, organizes verified report signals into a auto transformation stack layout, and highlights what matters most for automotive readers: structure, pressure points, and key directional shifts. As an AI Infographic Generator, it helps teams, analysts, students, and creators understand the report's core message on mobile and desktop without drifting into investment advice or unsupported claims.

Template details

Topic
Automotive Industry Report
Industry
Automotive
Aspect ratio
9:16
Structure
auto transformation stack
Style
Consulting Insight Style
Download
Disabled

Key learning points

  • The report treats transition pillars as a lead indicator rather than a side statistic.
  • The chosen auto transformation stack layout helps separate drivers, bottlenecks, and outcomes instead of collapsing them into one summary box.
  • Margin pressure adds a second lens, helping readers see how the report balances scale with operating context.
  • The report quote is presented as source language, while the surrounding sections stay original and explanatory.
  • Operating model shift gives the poster a third source-backed dimension so the topic does not read like a single-metric claim.
  • One important limit in the report framing is that do not reduce the automotive shift to EV volume alone.

Source and report signals

McKinsey's Automotive and Mobility Practice Outlook 2025 is used as the primary report source for this automotive visual. The infographic keeps the direct quote short and separate from the original explanation, then translates report-backed signals such as transition pillars and margin pressure into a structured auto transformation stack view that helps readers understand industry direction, operating pressure, and system context without copying long source text.

Source: McKinsey
Transition pillars
EVs, software, supply chain
2025
Margin pressure
Persistent
2025
Operating model shift
Platform redesign
2025

Create a similar industry report infographic

Use this prepared prompt to create a similar report-backed industry poster with KnowLens AI. The prompt keeps the source-aware framing, quote discipline, layout direction, and mobile-readable hierarchy aligned with this example.

Create similar infographic

Related industry report templates