About this industry report infographic
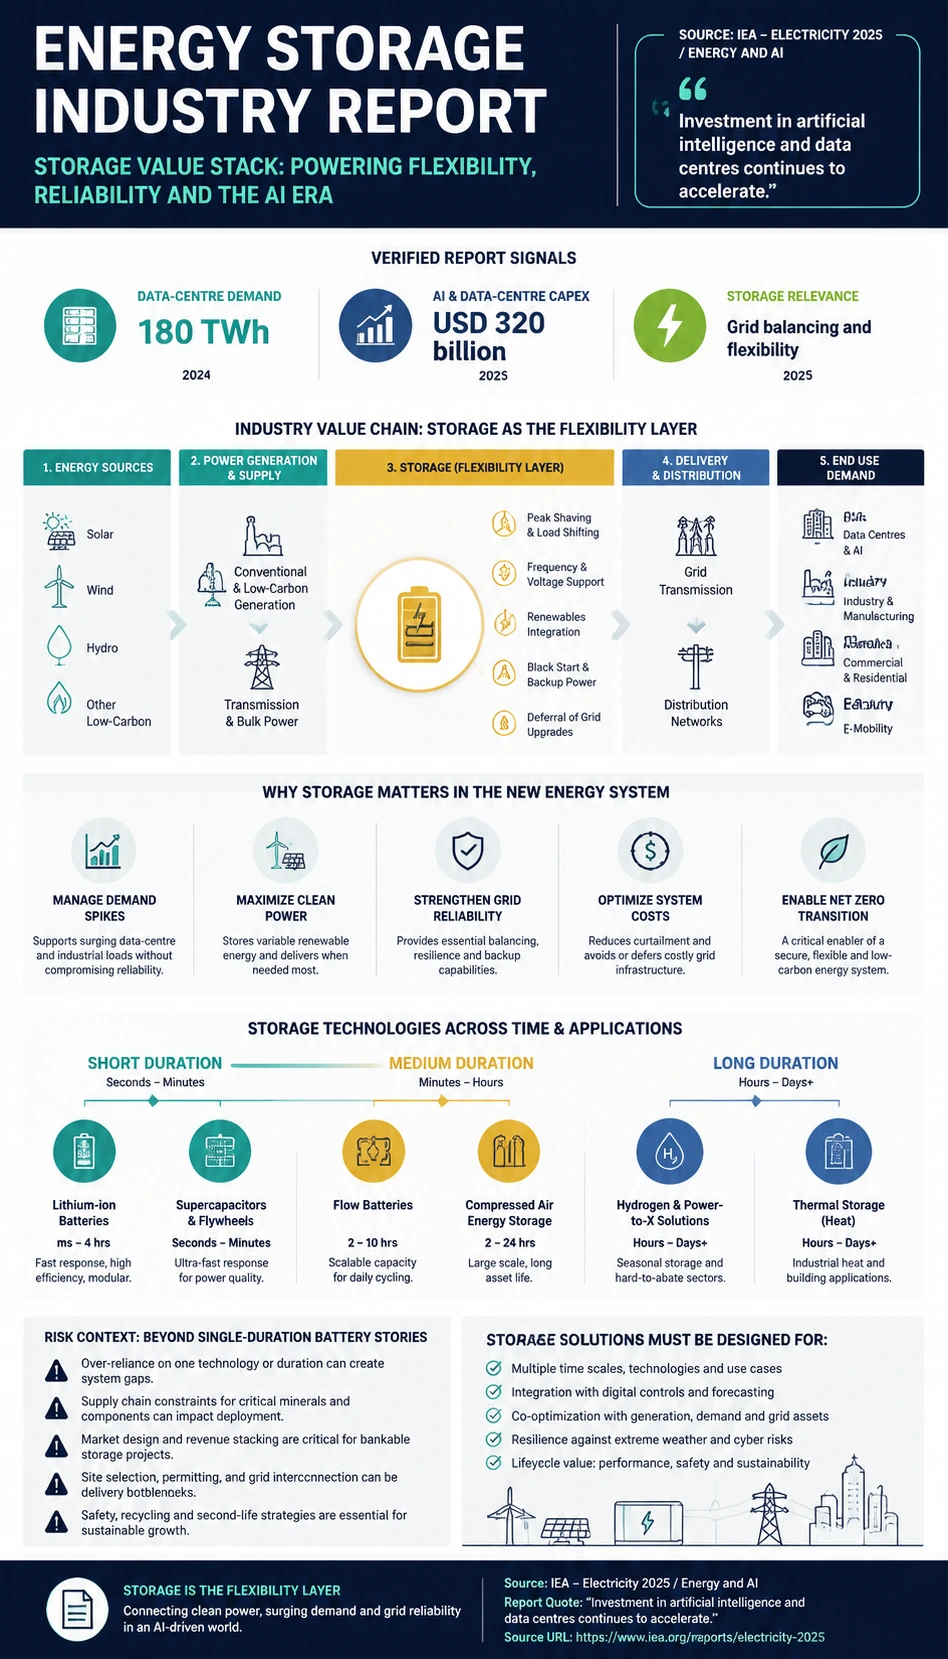
This Energy Storage Industry Report poster turns IEA's Electricity 2025 / Energy and AI supporting analysis into a source-aware visual built for faster reading and stronger context. Instead of repeating the report verbatim, the poster separates the short direct quote from the original explanation, organizes verified report signals into a storage value stack layout, and highlights what matters most for energy storage readers: structure, pressure points, and key directional shifts. As an Industry Report Infographic Generator, it helps teams, analysts, students, and creators understand the report's core message on mobile and desktop without drifting into investment advice or unsupported claims.
Template details
- Topic
- Energy Storage Industry Report
- Industry
- Energy Storage
- Aspect ratio
- 9:16
- Structure
- storage value stack
- Style
- Industry Value Chain Style
- Download
- Disabled
Key learning points
- The strongest signal in this report is data-centre demand, which sets the tone for the rest of the analysis.
- This storage value stack view is deliberately built to keep system relationships visible on a phone screen.
- AI and data-centre capex helps the visual explain whether the report is highlighting growth, cost, risk, or execution pressure.
- The quoted line, "Investment in artificial intelligence and data centres continues to accelerate.", is kept short so the page distinguishes direct report wording from KnowLens' original explanation.
- Storage relevance gives the poster a third source-backed dimension so the topic does not read like a single-metric claim.
- A careful reading also requires context: do not reduce storage to a single-duration battery procurement story.
Source and report signals
IEA's Electricity 2025 / Energy and AI supporting analysis is used as the primary report source for this energy storage visual. The infographic keeps the direct quote short and separate from the original explanation, then translates report-backed signals such as data-centre demand and ai and data-centre capex into a structured storage value stack view that helps readers understand industry direction, operating pressure, and system context without copying long source text.
Source: IEA- Data-centre demand
- 180 TWh
- 2024
- AI and data-centre capex
- USD 320 billion
- 2025
- Storage relevance
- Grid balancing and flexibility
- 2025
Create a similar industry report infographic
Use this prepared prompt to create a similar report-backed industry poster with KnowLens AI. The prompt keeps the source-aware framing, quote discipline, layout direction, and mobile-readable hierarchy aligned with this example.
Create similar infographic