About this industry report infographic
This Food and Agriculture Report poster turns FAO's The State of Food Security and Nutrition in the World 2025 into a source-aware visual built for faster reading and stronger context. Instead of repeating the report verbatim, the poster separates the short direct quote from the original explanation, organizes verified report signals into a food system risk map layout, and highlights what matters most for agriculture readers: structure, pressure points, and key directional shifts. As an Industry Report Infographic Generator, it helps teams, analysts, students, and creators understand the report's core message on mobile and desktop without drifting into investment advice or unsupported claims.
Template details
- Topic
- Food and Agriculture Report
- Industry
- Agriculture
- Aspect ratio
- 9:16
- Structure
- food system risk map
- Style
- Institutional Research Dashboard Style
- Download
- Disabled
Key learning points
- The strongest signal in this report is system challenge, which sets the tone for the rest of the analysis.
- This food system risk map view is deliberately built to keep system relationships visible on a phone screen.
- Output lens helps the visual explain whether the report is highlighting growth, cost, risk, or execution pressure.
- The short quote works as a report anchor, not as the whole narrative; the interpretation remains separate and structured.
- Access lens gives the poster a third source-backed dimension so the topic does not read like a single-metric claim.
- The poster keeps one risk note visible: avoid reducing food security to one commodity or one harvest cycle.
Source and report signals
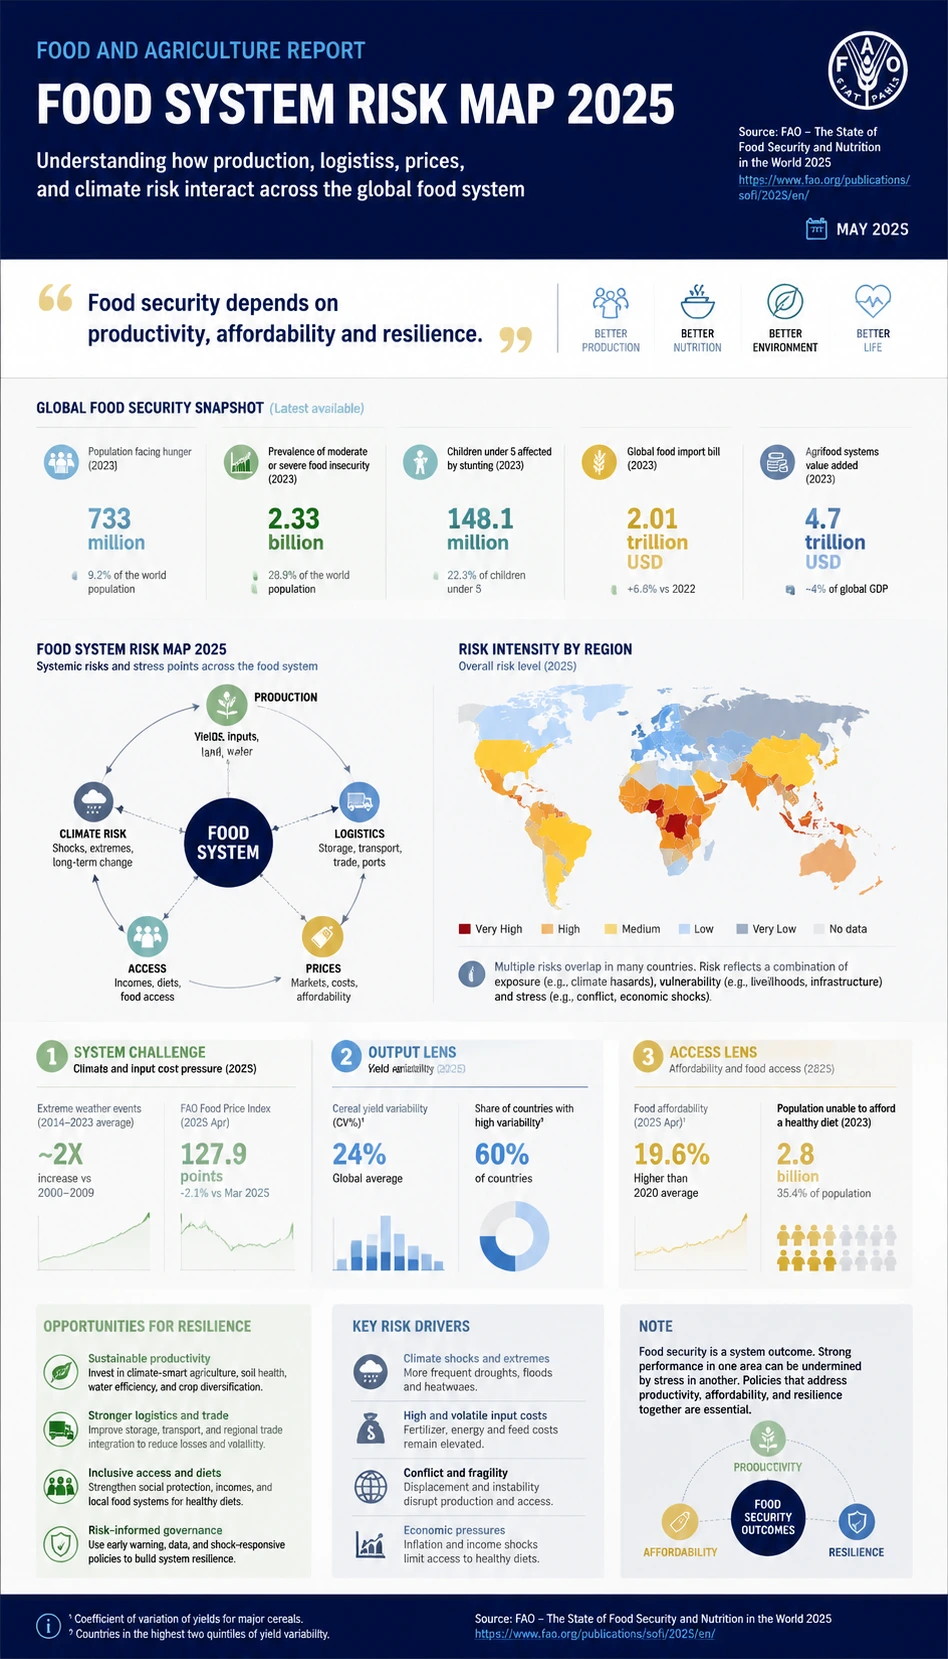
FAO's The State of Food Security and Nutrition in the World 2025 is used as the primary report source for this agriculture visual. The infographic keeps the direct quote short and separate from the original explanation, then translates report-backed signals such as system challenge and output lens into a structured food system risk map view that helps readers understand industry direction, operating pressure, and system context without copying long source text.
Source: FAO- System challenge
- Climate and input cost pressure
- 2025
- Output lens
- Yield variability
- 2025
- Access lens
- Affordability and food access
- 2025
Create a similar industry report infographic
Use this prepared prompt to create a similar report-backed industry poster with KnowLens AI. The prompt keeps the source-aware framing, quote discipline, layout direction, and mobile-readable hierarchy aligned with this example.
Create similar infographic