About this industry report infographic
This Housing Market Report poster turns OECD's Brick by Brick: Better Housing Policies in the Post-COVID-19 Era into a source-aware visual built for faster reading and stronger context. Instead of repeating the report verbatim, the poster separates the short direct quote from the original explanation, organizes verified report signals into a affordability pressure map layout, and highlights what matters most for housing readers: structure, pressure points, and key directional shifts. As an Infographic Maker, it helps teams, analysts, students, and creators understand the report's core message on mobile and desktop without drifting into investment advice or unsupported claims.
Template details
- Topic
- Housing Market Report
- Industry
- Housing
- Aspect ratio
- 9:16
- Structure
- affordability pressure map
- Style
- Institutional Research Dashboard Style
- Download
- Disabled
Key learning points
- The report treats pressure point as a lead indicator rather than a side statistic.
- The chosen affordability pressure map layout helps separate drivers, bottlenecks, and outcomes instead of collapsing them into one summary box.
- Supply issue adds a second lens, helping readers see how the report balances scale with operating context.
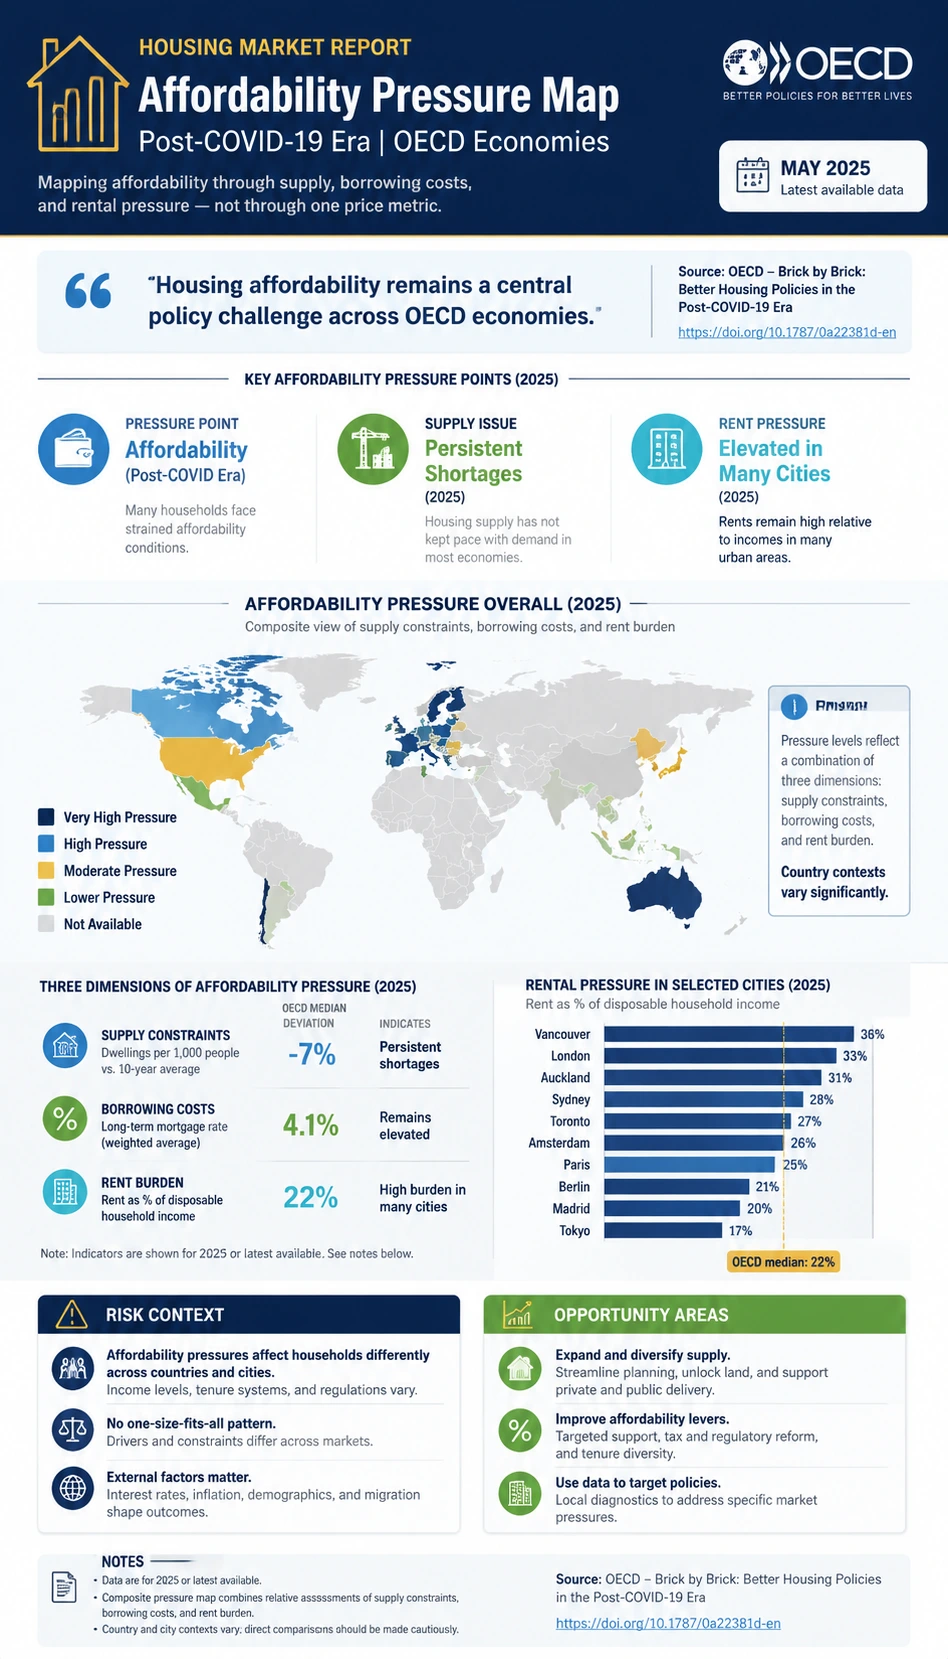
- The quoted line, "Housing affordability remains a central policy challenge across OECD economies.", is kept short so the page distinguishes direct report wording from KnowLens' original explanation.
- Rent pressure gives the poster a third source-backed dimension so the topic does not read like a single-metric claim.
- A careful reading also requires context: do not imply one housing pattern applies equally across countries.
Source and report signals
OECD's Brick by Brick: Better Housing Policies in the Post-COVID-19 Era is used as the primary report source for this housing visual. The infographic keeps the direct quote short and separate from the original explanation, then translates report-backed signals such as pressure point and supply issue into a structured affordability pressure map view that helps readers understand industry direction, operating pressure, and system context without copying long source text.
Source: OECD- Pressure point
- Affordability
- post-COVID era
- Supply issue
- Persistent shortages
- 2025
- Rent pressure
- Elevated in many cities
- 2025
Create a similar industry report infographic
Use this prepared prompt to create a similar report-backed industry poster with KnowLens AI. The prompt keeps the source-aware framing, quote discipline, layout direction, and mobile-readable hierarchy aligned with this example.
Create similar infographic