About this industry report infographic
This Media and Streaming Industry Report poster turns Deloitte's Digital Media Trends 2026 into a source-aware visual built for faster reading and stronger context. Instead of repeating the report verbatim, the poster separates the short direct quote from the original explanation, organizes verified report signals into a streaming economics map layout, and highlights what matters most for streaming media readers: structure, pressure points, and key directional shifts. As an Professional Report Infographic Maker, it helps teams, analysts, students, and creators understand the report's core message on mobile and desktop without drifting into investment advice or unsupported claims.
Template details
- Topic
- Media and Streaming Industry Report
- Industry
- Streaming Media
- Aspect ratio
- 9:16
- Structure
- streaming economics map
- Style
- Market Trend Poster Style
- Download
- Disabled
Key learning points
- A useful first read of this report starts with consumer issue, because it anchors the rest of the sector story.
- Using a streaming economics map structure makes it easier to compare where the report describes momentum versus where it describes constraint.
- Monetization issue shows that the report is not only about one metric, but about how several signals move together.
- The short quote works as a report anchor, not as the whole narrative; the interpretation remains separate and structured.
- Cost issue gives the poster a third source-backed dimension so the topic does not read like a single-metric claim.
- The poster keeps one risk note visible: do not read subscriber-scale alone as a profitability signal.
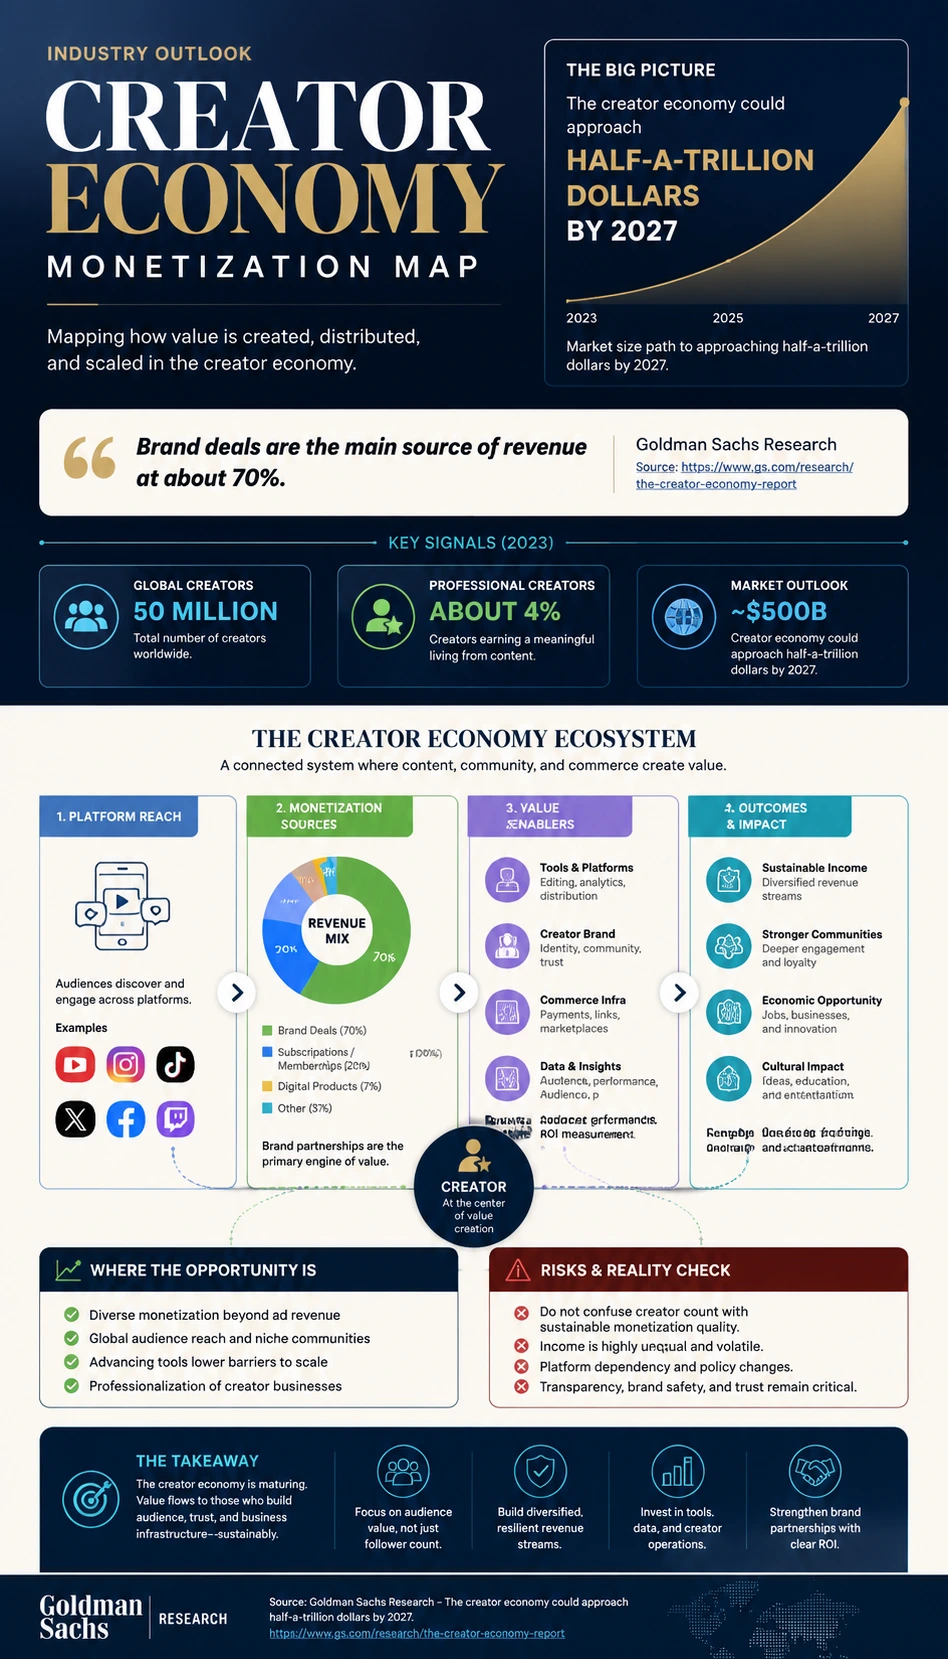
Source and report signals
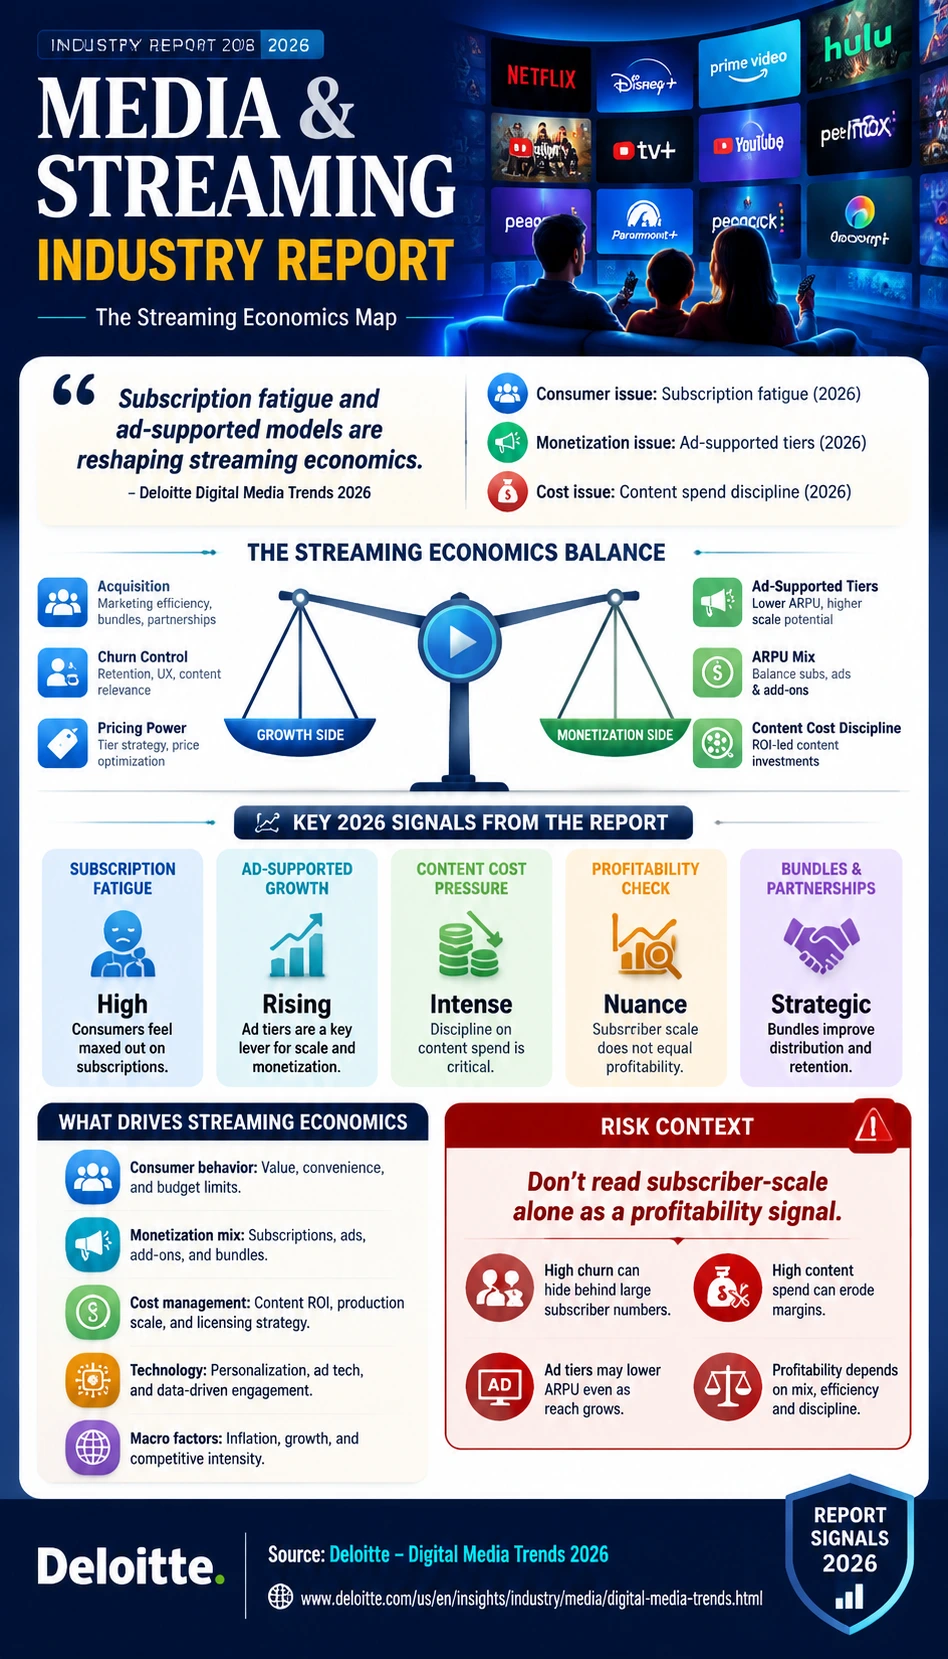
Deloitte's Digital Media Trends 2026 is used as the primary report source for this streaming media visual. The infographic keeps the direct quote short and separate from the original explanation, then translates report-backed signals such as consumer issue and monetization issue into a structured streaming economics map view that helps readers understand industry direction, operating pressure, and system context without copying long source text.
Source: Deloitte- Consumer issue
- Subscription fatigue
- 2026
- Monetization issue
- Ad-supported tiers
- 2026
- Cost issue
- Content spend discipline
- 2026
Create a similar industry report infographic
Use this prepared prompt to create a similar report-backed industry poster with KnowLens AI. The prompt keeps the source-aware framing, quote discipline, layout direction, and mobile-readable hierarchy aligned with this example.
Create similar infographic