About this industry report infographic
This Pharmaceutical Industry Report poster turns IQVIA's The Global Use of Medicines 2025 into a source-aware visual built for faster reading and stronger context. Instead of repeating the report verbatim, the poster separates the short direct quote from the original explanation, organizes verified report signals into a pharma value chain layout, and highlights what matters most for pharma readers: structure, pressure points, and key directional shifts. As an Professional Report Infographic Maker, it helps teams, analysts, students, and creators understand the report's core message on mobile and desktop without drifting into investment advice or unsupported claims.
Template details
- Topic
- Pharmaceutical Industry Report
- Industry
- Pharma
- Aspect ratio
- 9:16
- Structure
- pharma value chain
- Style
- Professional Report Editorial Style
- Download
- Disabled
Key learning points
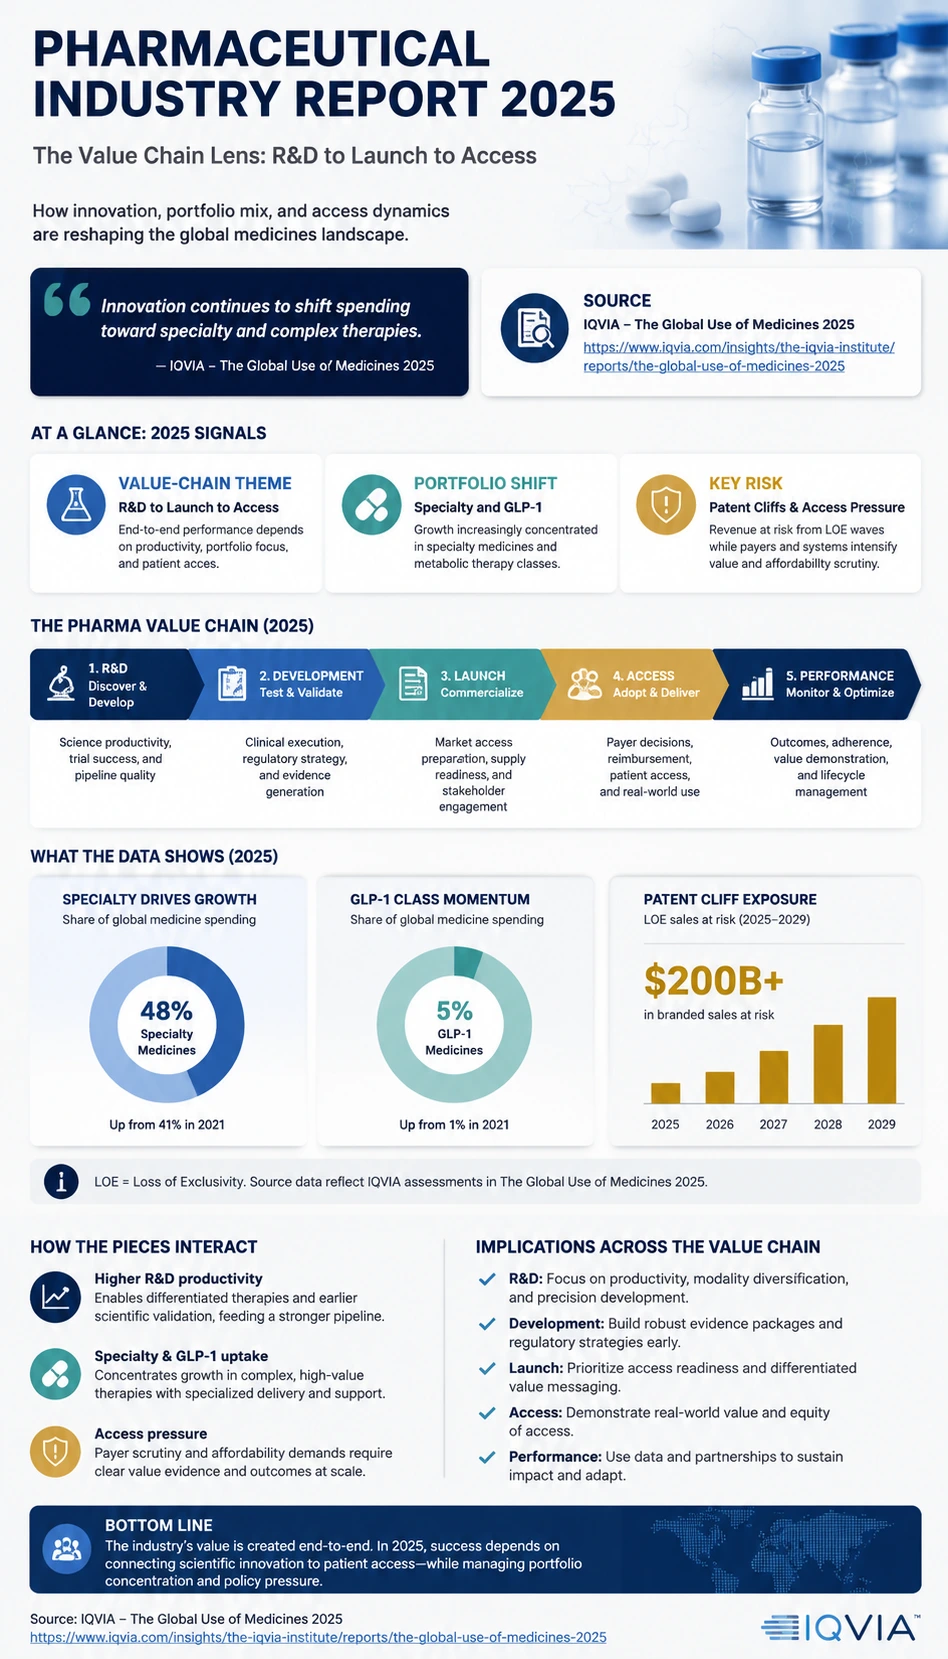
- The strongest signal in this report is value-chain theme, which sets the tone for the rest of the analysis.
- This pharma value chain view is deliberately built to keep system relationships visible on a phone screen.
- Portfolio shift helps the visual explain whether the report is highlighting growth, cost, risk, or execution pressure.
- The report quote is presented as source language, while the surrounding sections stay original and explanatory.
- Risk gives the poster a third source-backed dimension so the topic does not read like a single-metric claim.
- One important limit in the report framing is that keep medicine-market insight separate from treatment claims or advice.
Source and report signals
IQVIA's The Global Use of Medicines 2025 is used as the primary report source for this pharma visual. The infographic keeps the direct quote short and separate from the original explanation, then translates report-backed signals such as value-chain theme and portfolio shift into a structured pharma value chain view that helps readers understand industry direction, operating pressure, and system context without copying long source text.
Source: IQVIA- Value-chain theme
- R&D to launch to access
- 2025
- Portfolio shift
- Specialty and GLP-1
- 2025
- Risk
- Patent cliffs and access pressure
- 2025
Create a similar industry report infographic
Use this prepared prompt to create a similar report-backed industry poster with KnowLens AI. The prompt keeps the source-aware framing, quote discipline, layout direction, and mobile-readable hierarchy aligned with this example.
Create similar infographic