About this industry report infographic
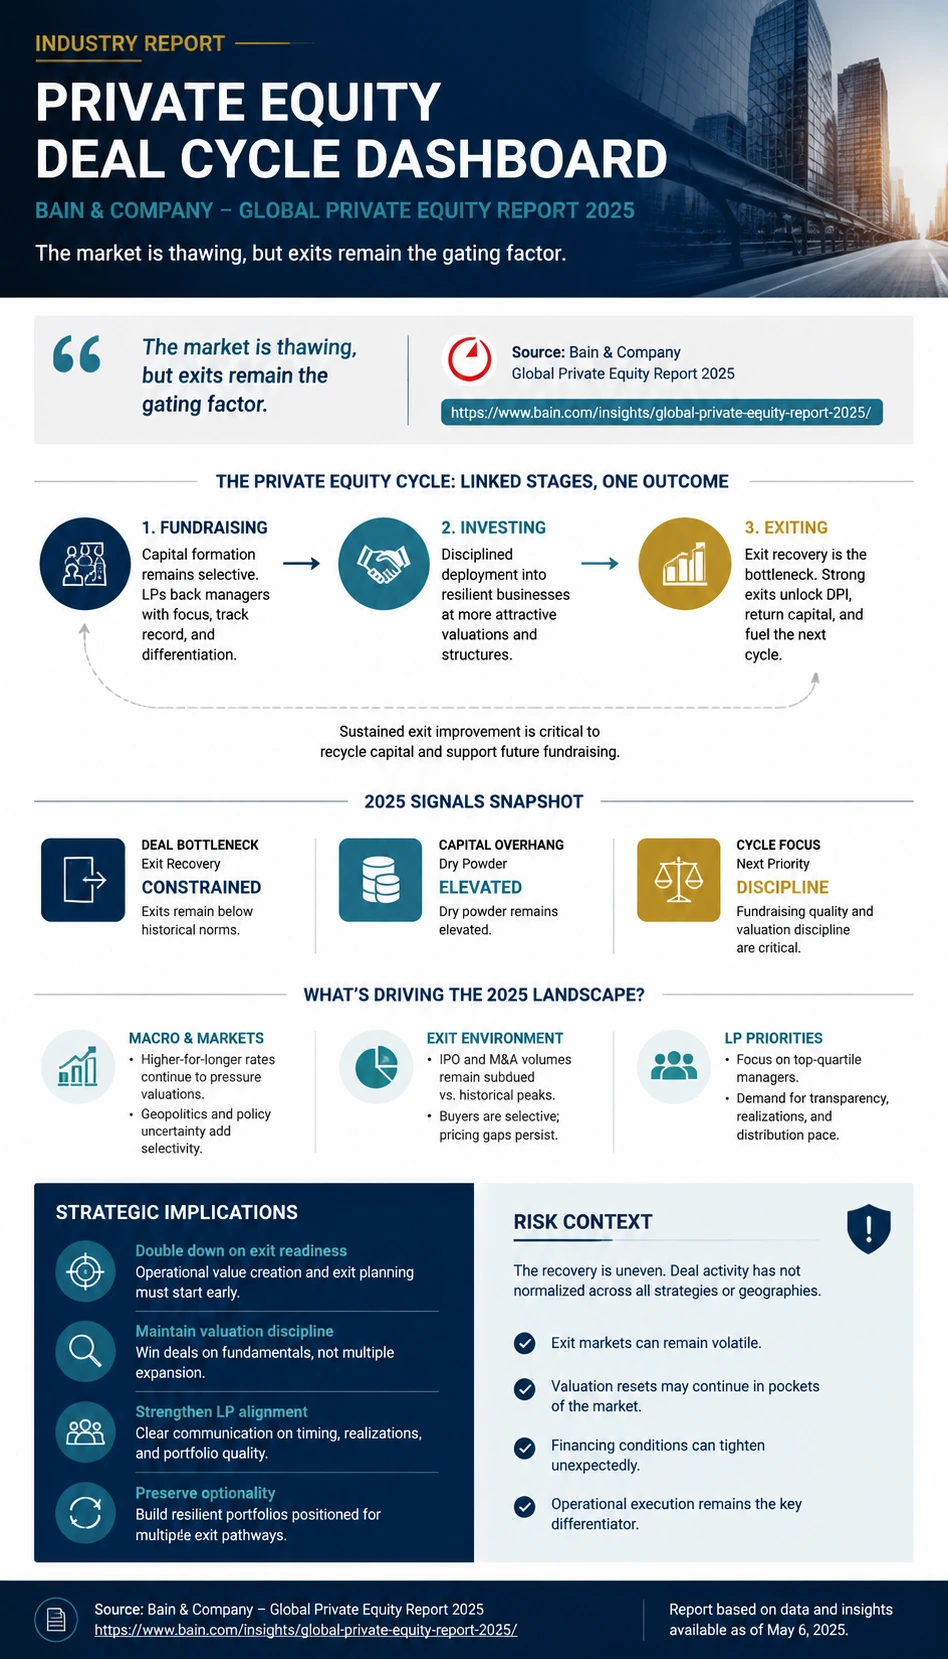
This Private Equity Industry Report poster turns Bain & Company's Global Private Equity Report 2025 into a source-aware visual built for faster reading and stronger context. Instead of repeating the report verbatim, the poster separates the short direct quote from the original explanation, organizes verified report signals into a deal cycle dashboard layout, and highlights what matters most for private equity readers: structure, pressure points, and key directional shifts. As an Infographic Maker, it helps teams, analysts, students, and creators understand the report's core message on mobile and desktop without drifting into investment advice or unsupported claims.
Template details
- Topic
- Private Equity Industry Report
- Industry
- Private Equity
- Aspect ratio
- 9:16
- Structure
- deal cycle dashboard
- Style
- Consulting Insight Style
- Download
- Disabled
Key learning points
- A useful first read of this report starts with deal bottleneck, because it anchors the rest of the sector story.
- Using a deal cycle dashboard structure makes it easier to compare where the report describes momentum versus where it describes constraint.
- Capital overhang shows that the report is not only about one metric, but about how several signals move together.
- The quoted line, "The market is thawing, but exits remain the gating factor.", is kept short so the page distinguishes direct report wording from KnowLens' original explanation.
- Cycle focus gives the poster a third source-backed dimension so the topic does not read like a single-metric claim.
- A careful reading also requires context: do not imply that deal activity has normalized across all strategies.
Source and report signals
Bain & Company's Global Private Equity Report 2025 is used as the primary report source for this private equity visual. The infographic keeps the direct quote short and separate from the original explanation, then translates report-backed signals such as deal bottleneck and capital overhang into a structured deal cycle dashboard view that helps readers understand industry direction, operating pressure, and system context without copying long source text.
Source: Bain & Company- Deal bottleneck
- Exit recovery
- 2025
- Capital overhang
- Dry powder remains elevated
- 2025
- Cycle focus
- Fundraising and valuation discipline
- 2025
Create a similar industry report infographic
Use this prepared prompt to create a similar report-backed industry poster with KnowLens AI. The prompt keeps the source-aware framing, quote discipline, layout direction, and mobile-readable hierarchy aligned with this example.
Create similar infographic