About this industry report infographic
This Solar Energy Market Report poster turns IEA's Renewables 2025 into a source-aware visual built for faster reading and stronger context. Instead of repeating the report verbatim, the poster separates the short direct quote from the original explanation, organizes verified report signals into a market size and driver breakdown layout, and highlights what matters most for solar energy readers: structure, pressure points, and key directional shifts. As an AI Infographic Generator, it helps teams, analysts, students, and creators understand the report's core message on mobile and desktop without drifting into investment advice or unsupported claims.
Template details
- Topic
- Solar Energy Market Report
- Industry
- Solar Energy
- Aspect ratio
- 9:16
- Structure
- market size and driver breakdown
- Style
- Market Trend Poster Style
- Download
- Disabled
Key learning points
- A useful first read of this report starts with capacity driver, because it anchors the rest of the sector story.
- Using a market size and driver breakdown structure makes it easier to compare where the report describes momentum versus where it describes constraint.
- Manufacturing concentration shows that the report is not only about one metric, but about how several signals move together.
- The report quote is presented as source language, while the surrounding sections stay original and explanatory.
- Cost signal gives the poster a third source-backed dimension so the topic does not read like a single-metric claim.
- One important limit in the report framing is that do not turn manufacturing dominance into a fixed long-term prediction.
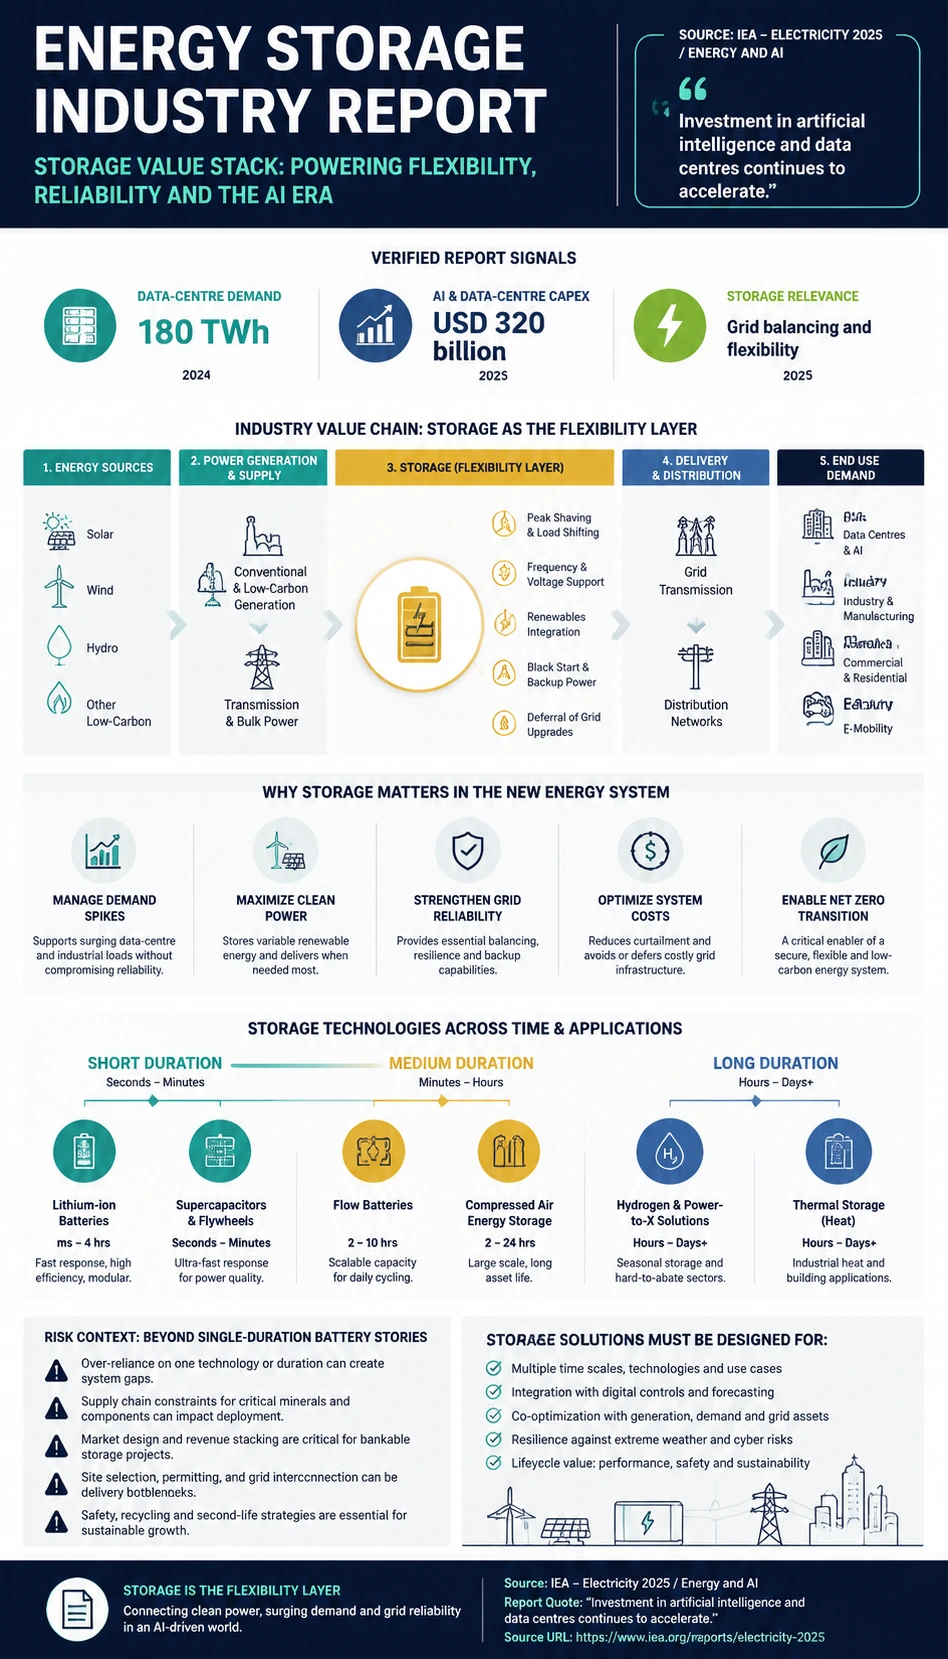
Source and report signals
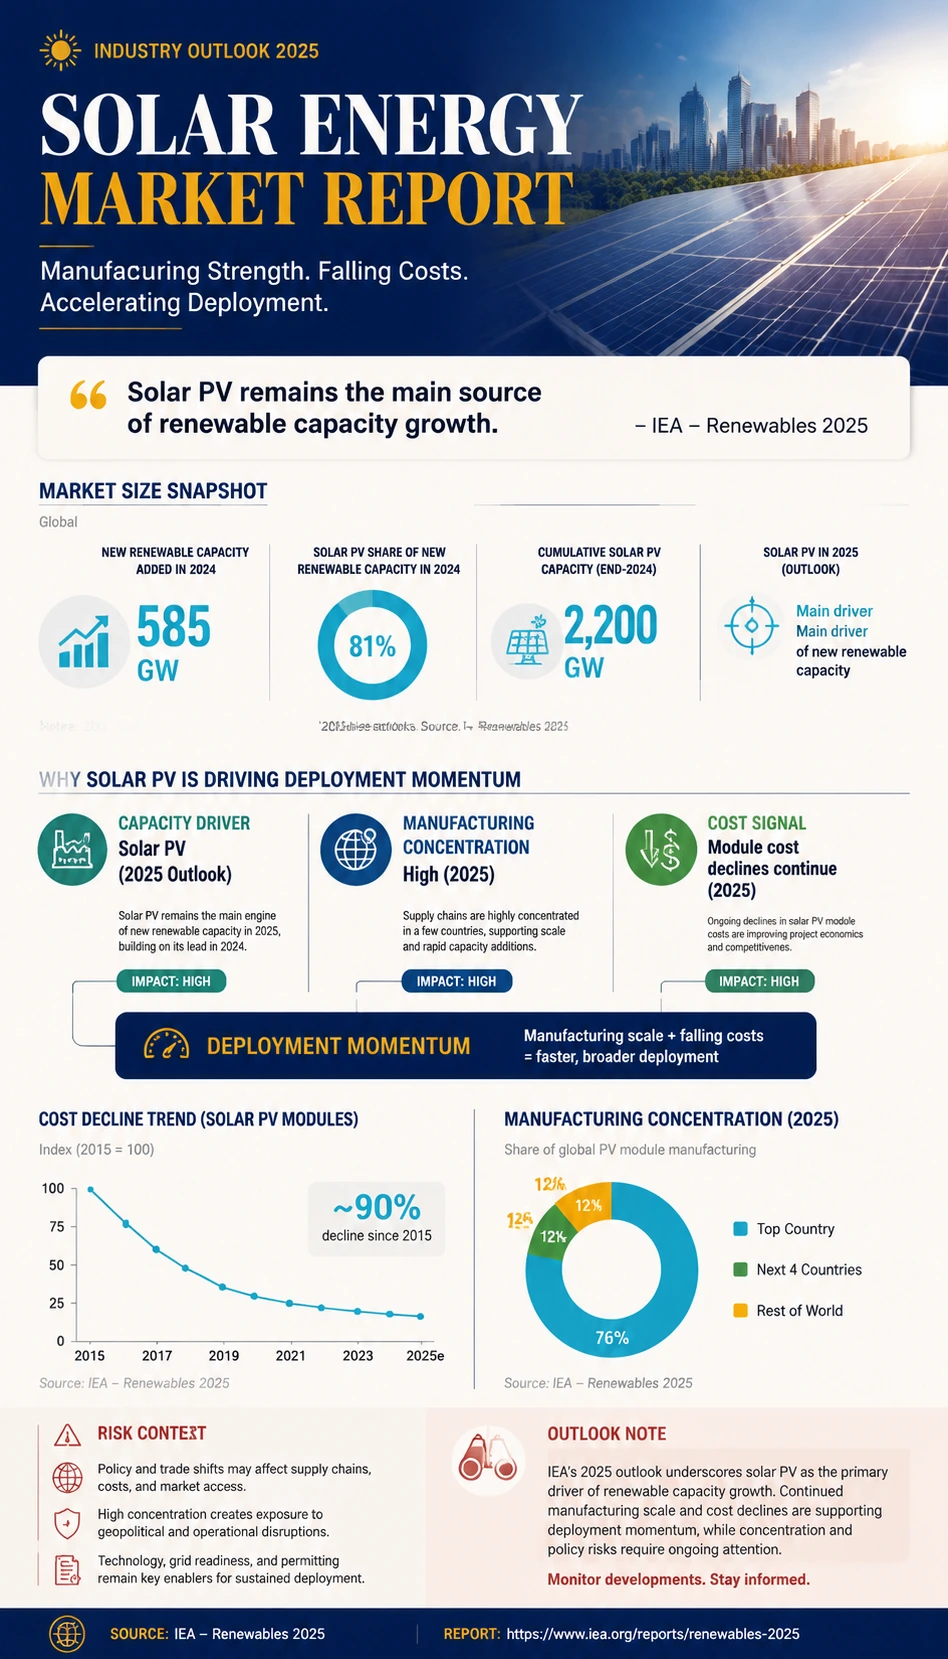
IEA's Renewables 2025 is used as the primary report source for this solar energy visual. The infographic keeps the direct quote short and separate from the original explanation, then translates report-backed signals such as capacity driver and manufacturing concentration into a structured market size and driver breakdown view that helps readers understand industry direction, operating pressure, and system context without copying long source text.
Source: IEA- Capacity driver
- Solar PV
- 2025 outlook
- Manufacturing concentration
- High
- 2025
- Cost signal
- Module cost declines continue
- 2025
Create a similar industry report infographic
Use this prepared prompt to create a similar report-backed industry poster with KnowLens AI. The prompt keeps the source-aware framing, quote discipline, layout direction, and mobile-readable hierarchy aligned with this example.
Create similar infographic