About this industry report infographic
This Wind Energy Industry Report poster turns GWEC's Global Wind Report 2025 into a source-aware visual built for faster reading and stronger context. Instead of repeating the report verbatim, the poster separates the short direct quote from the original explanation, organizes verified report signals into a project pipeline map layout, and highlights what matters most for wind energy readers: structure, pressure points, and key directional shifts. As an Infographic Maker, it helps teams, analysts, students, and creators understand the report's core message on mobile and desktop without drifting into investment advice or unsupported claims.
Template details
- Topic
- Wind Energy Industry Report
- Industry
- Wind Energy
- Aspect ratio
- 9:16
- Structure
- project pipeline map
- Style
- Industry Value Chain Style
- Download
- Disabled
Key learning points
- Pipeline issue acts as the clearest starting point for understanding this wind energy report.
- The project pipeline map format is useful here because the report describes multiple linked forces, not a single headline trend.
- The inclusion of supply-chain issue keeps the poster grounded in report structure instead of generic commentary.
- The short quote works as a report anchor, not as the whole narrative; the interpretation remains separate and structured.
- Deployment theme gives the poster a third source-backed dimension so the topic does not read like a single-metric claim.
- The poster keeps one risk note visible: avoid treating announced projects as secured delivered capacity.
Source and report signals
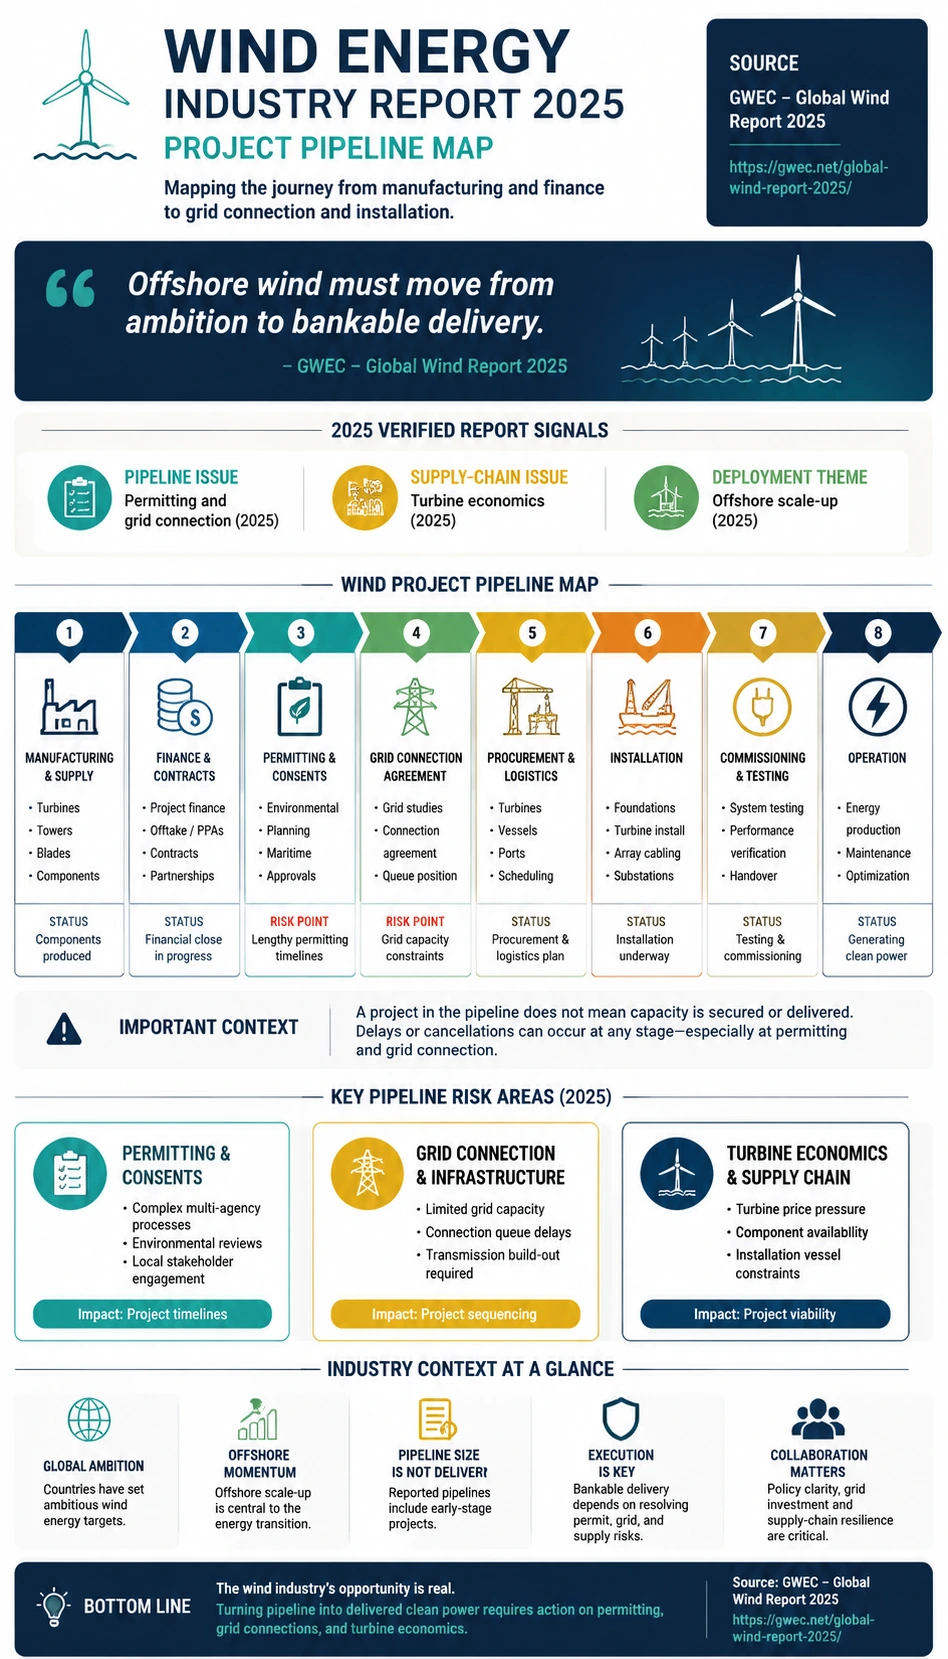
GWEC's Global Wind Report 2025 is used as the primary report source for this wind energy visual. The infographic keeps the direct quote short and separate from the original explanation, then translates report-backed signals such as pipeline issue and supply-chain issue into a structured project pipeline map view that helps readers understand industry direction, operating pressure, and system context without copying long source text.
Source: GWEC- Pipeline issue
- Permitting and grid connection
- 2025
- Supply-chain issue
- Turbine economics
- 2025
- Deployment theme
- Offshore scale-up
- 2025
Create a similar industry report infographic
Use this prepared prompt to create a similar report-backed industry poster with KnowLens AI. The prompt keeps the source-aware framing, quote discipline, layout direction, and mobile-readable hierarchy aligned with this example.
Create similar infographic