About this industry report infographic
This Workforce and Future of Work Report poster turns World Economic Forum's Future of Jobs Report 2025 into a source-aware visual built for faster reading and stronger context. Instead of repeating the report verbatim, the poster separates the short direct quote from the original explanation, organizes verified report signals into a skills transition map layout, and highlights what matters most for future of work readers: structure, pressure points, and key directional shifts. As an Industry Report Infographic Generator, it helps teams, analysts, students, and creators understand the report's core message on mobile and desktop without drifting into investment advice or unsupported claims.
Template details
- Topic
- Workforce and Future of Work Report
- Industry
- Future of Work
- Aspect ratio
- 9:16
- Structure
- skills transition map
- Style
- Institutional Research Dashboard Style
- Download
- Disabled
Key learning points
- A useful first read of this report starts with primary driver, because it anchors the rest of the sector story.
- Using a skills transition map structure makes it easier to compare where the report describes momentum versus where it describes constraint.
- Work design shows that the report is not only about one metric, but about how several signals move together.
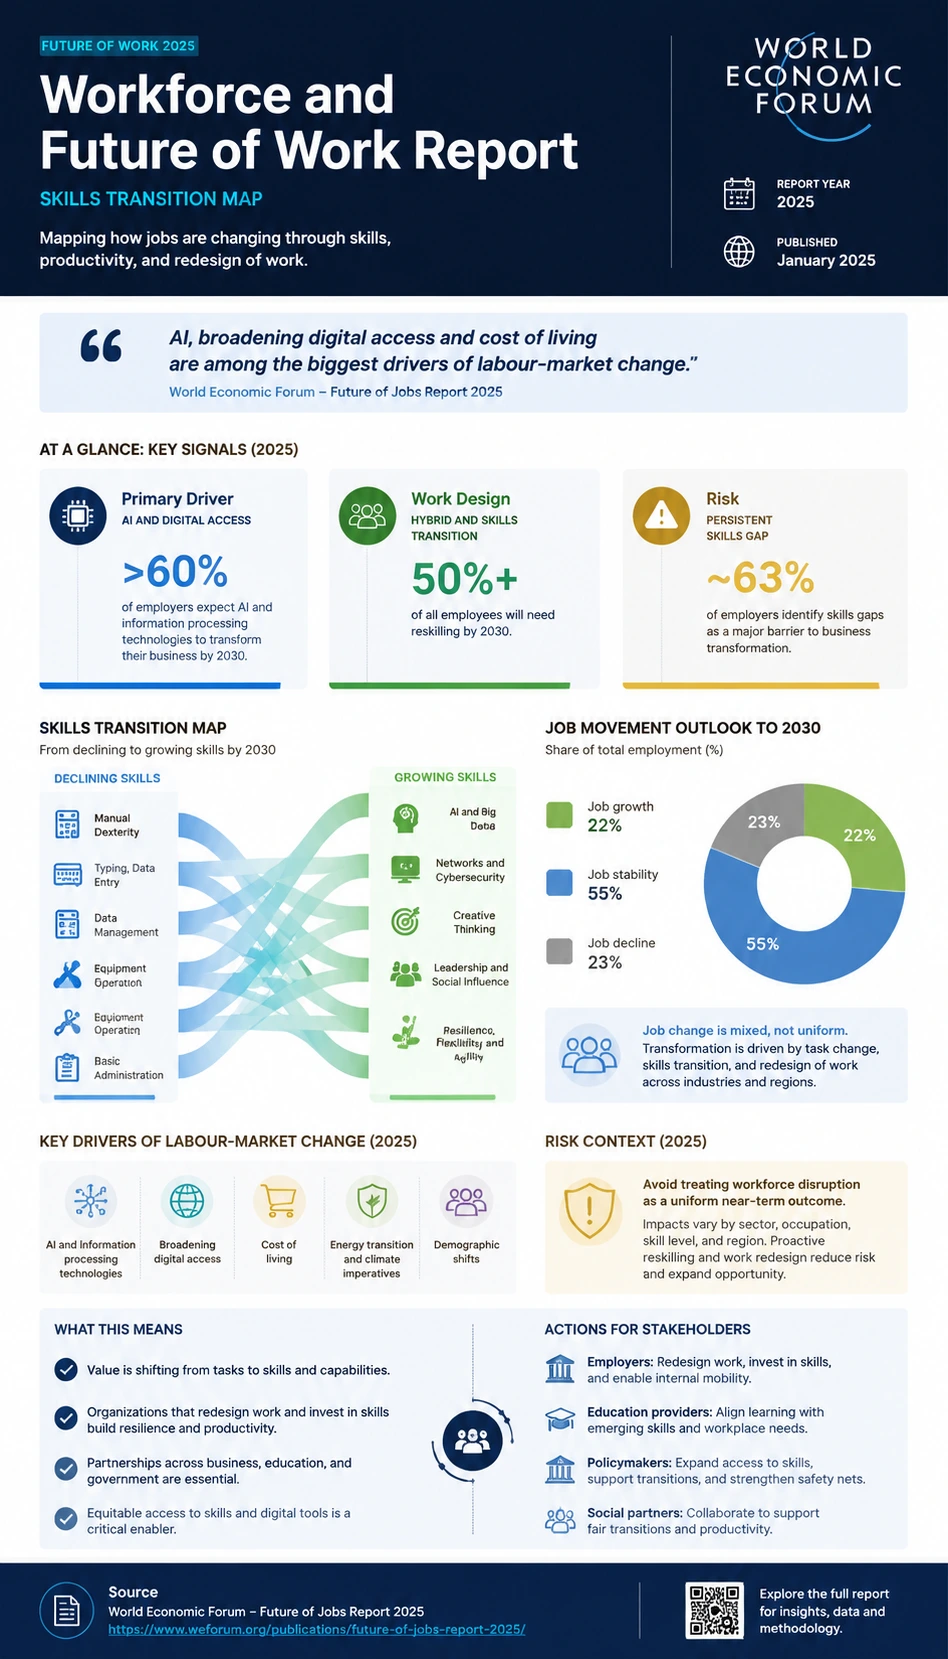
- The quoted line, "AI, broadening digital access and cost of living are among the biggest drivers of labour-market change.", is kept short so the page distinguishes direct report wording from KnowLens' original explanation.
- Risk gives the poster a third source-backed dimension so the topic does not read like a single-metric claim.
- A careful reading also requires context: avoid treating workforce disruption as a uniform near-term outcome.
Source and report signals
World Economic Forum's Future of Jobs Report 2025 is used as the primary report source for this future of work visual. The infographic keeps the direct quote short and separate from the original explanation, then translates report-backed signals such as primary driver and work design into a structured skills transition map view that helps readers understand industry direction, operating pressure, and system context without copying long source text.
Source: World Economic Forum- Primary driver
- AI and digital access
- 2025
- Work design
- Hybrid and skills transition
- 2025
- Risk
- Persistent skills gap
- 2025
Create a similar industry report infographic
Use this prepared prompt to create a similar report-backed industry poster with KnowLens AI. The prompt keeps the source-aware framing, quote discipline, layout direction, and mobile-readable hierarchy aligned with this example.
Create similar infographic