About this insurance infographic
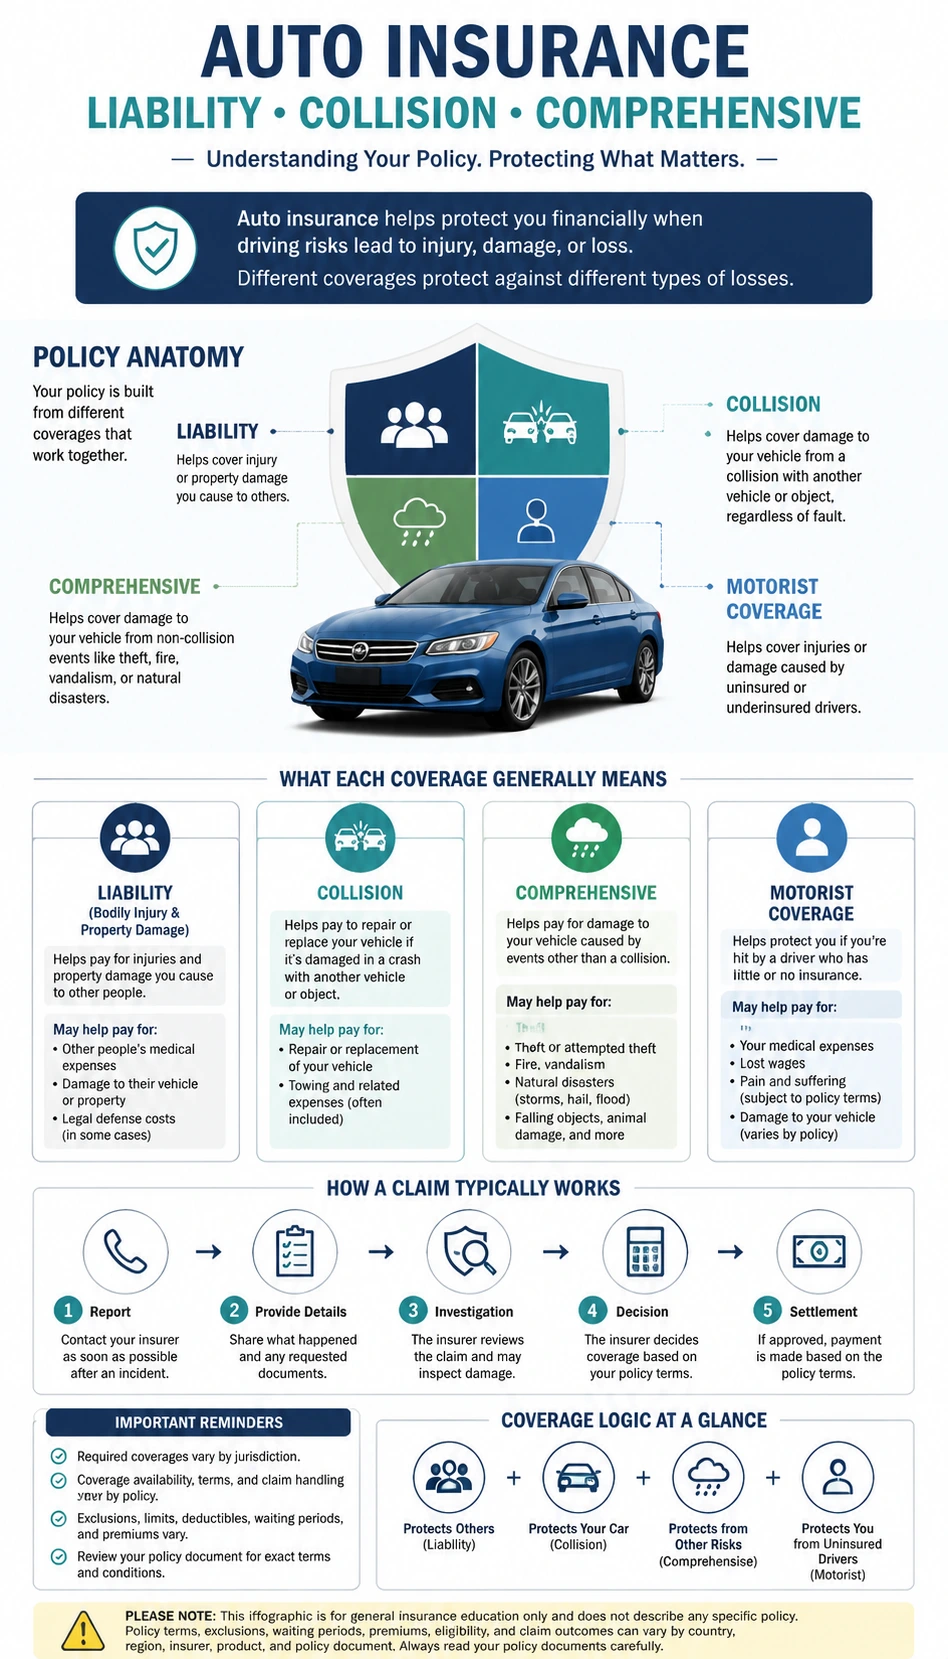
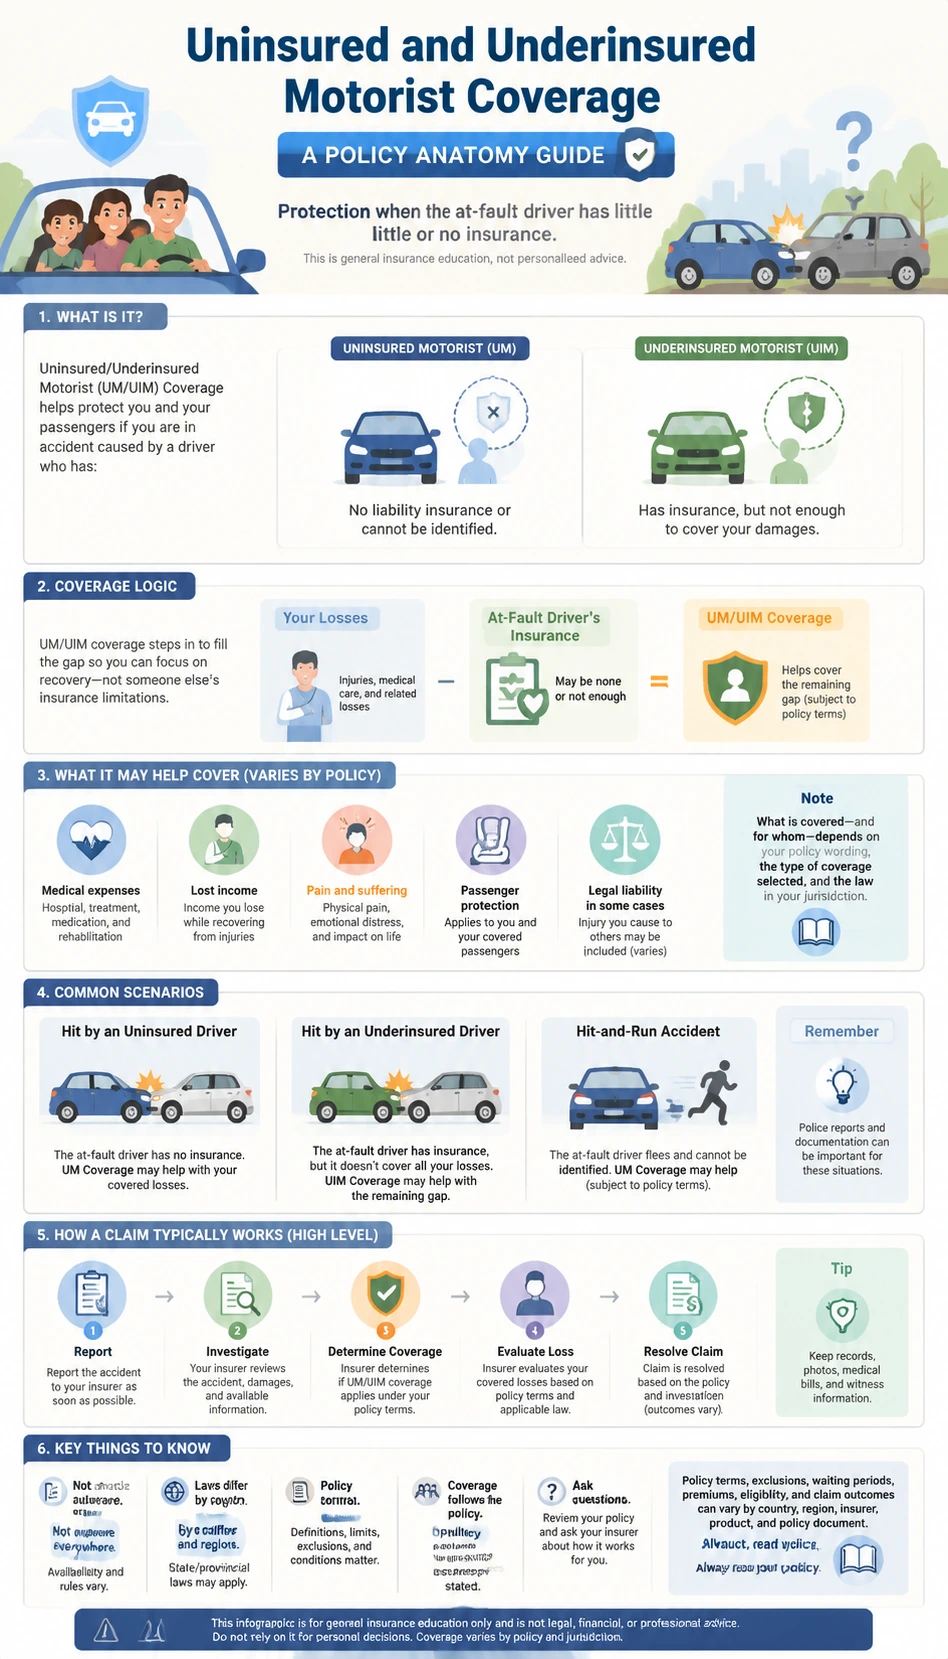
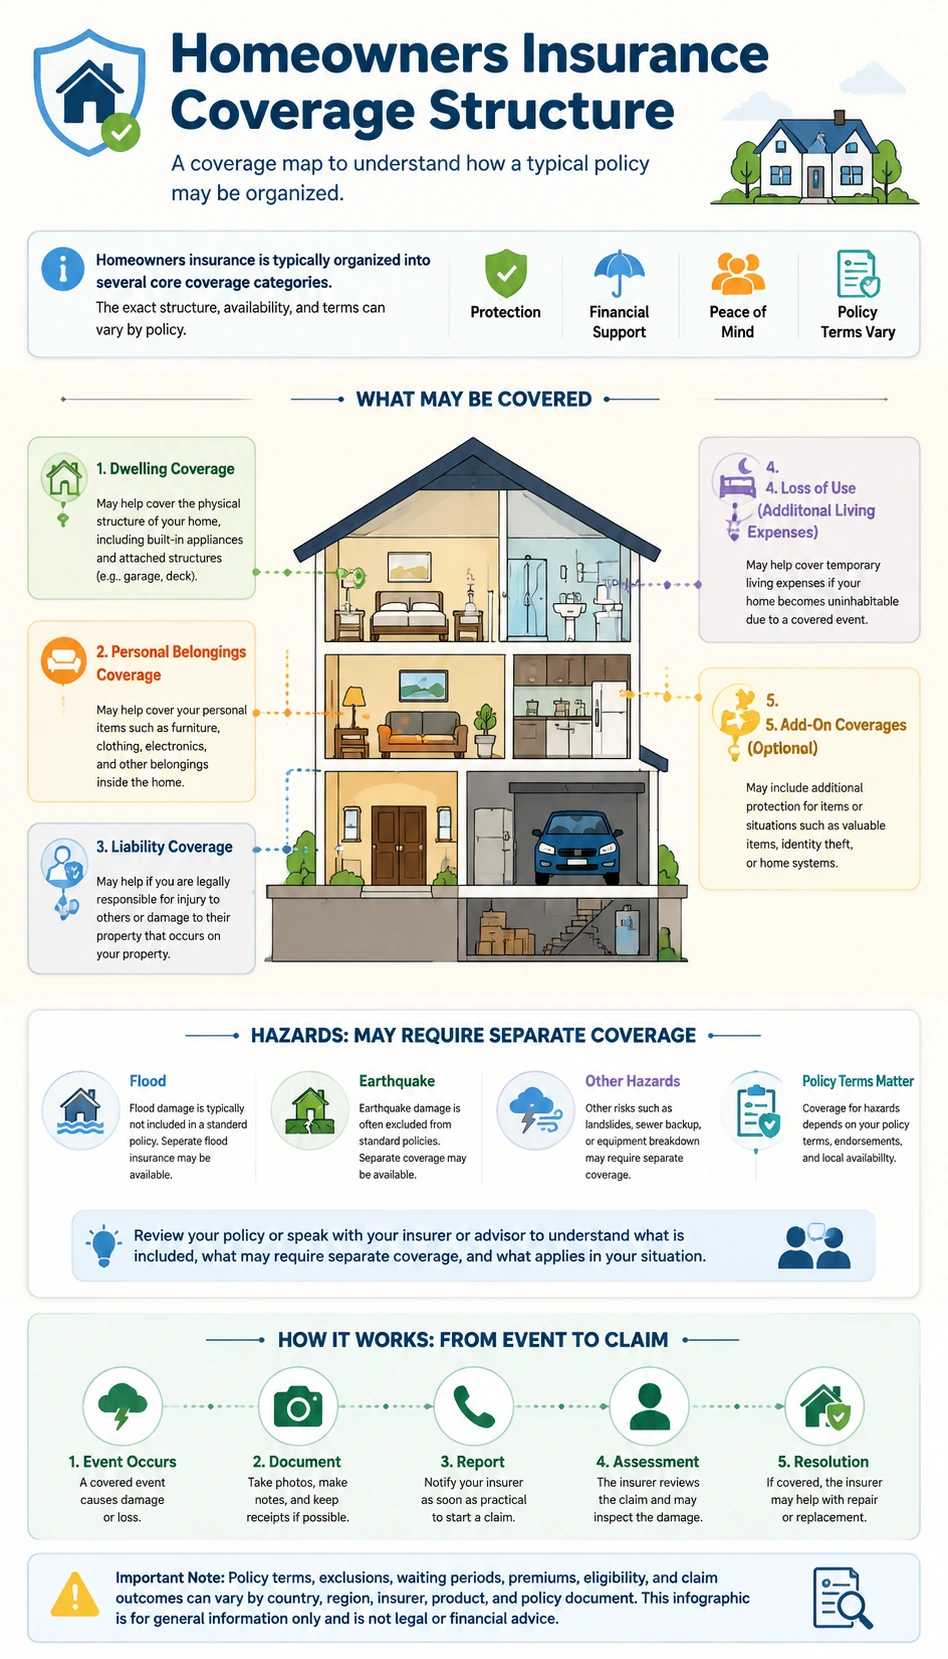
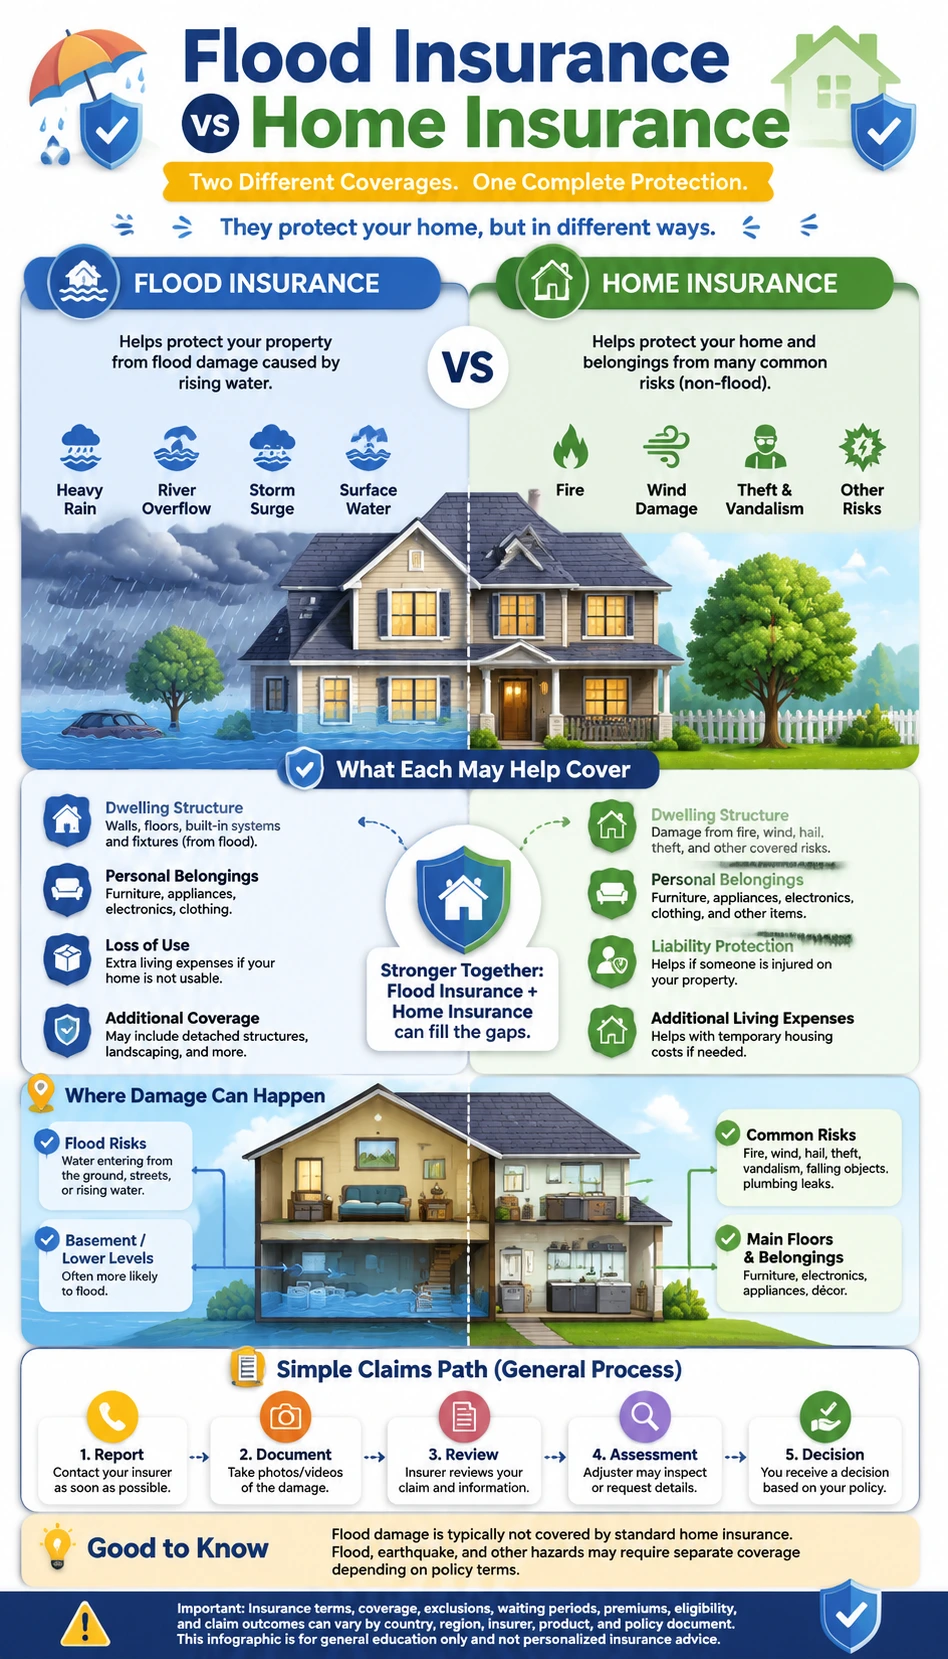
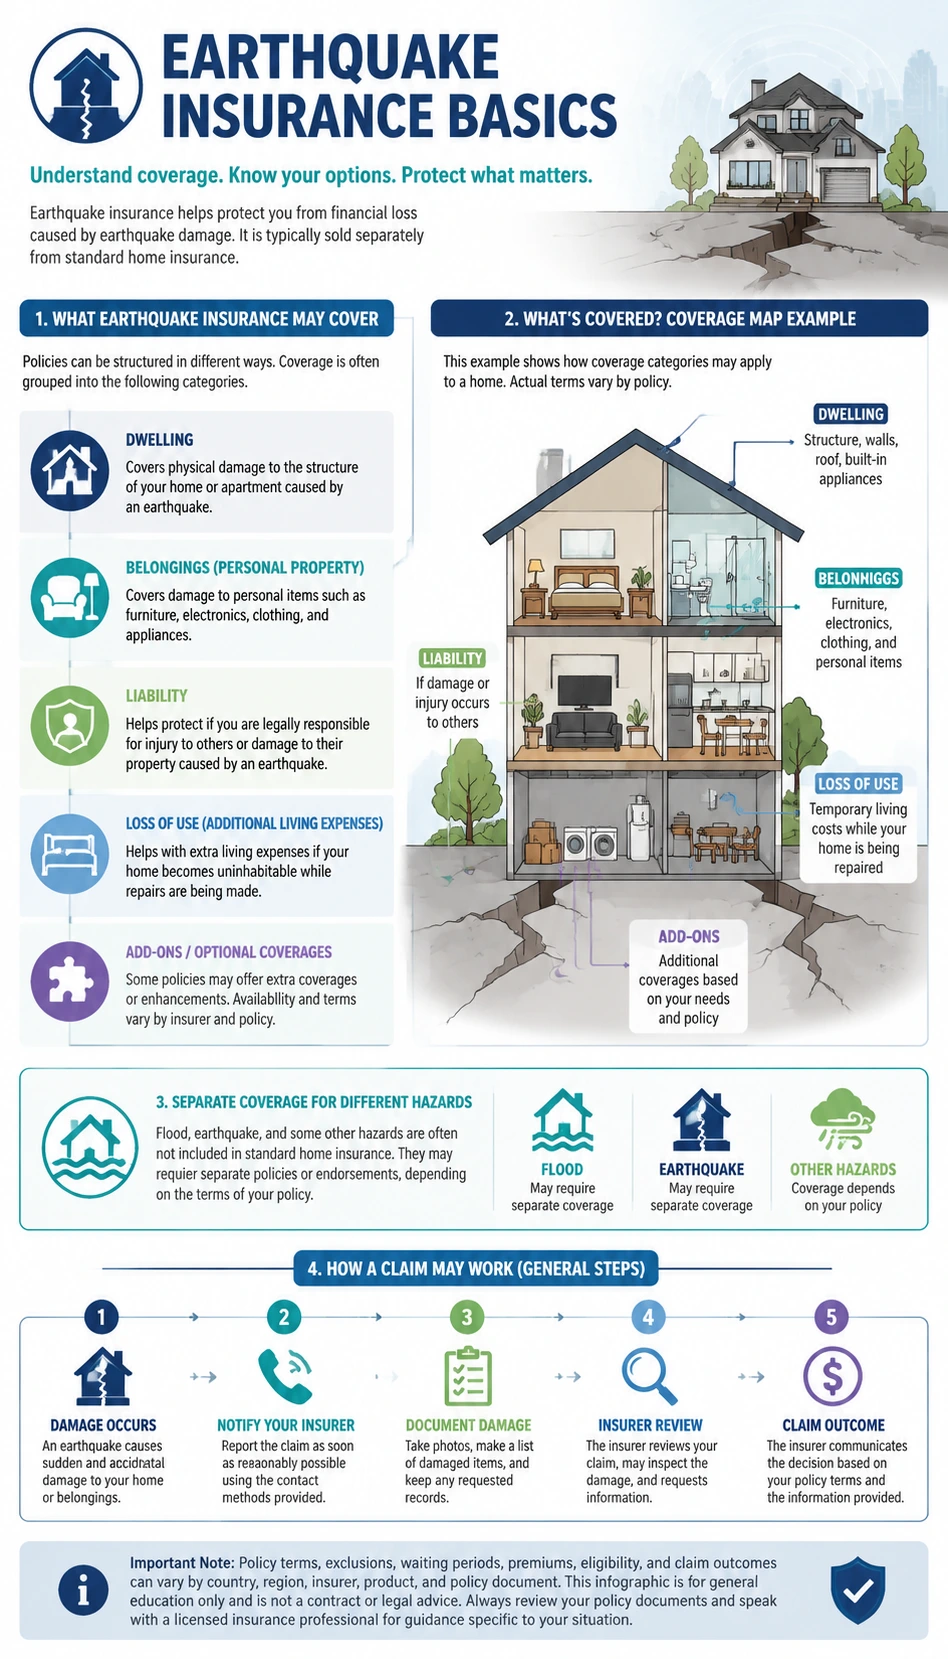
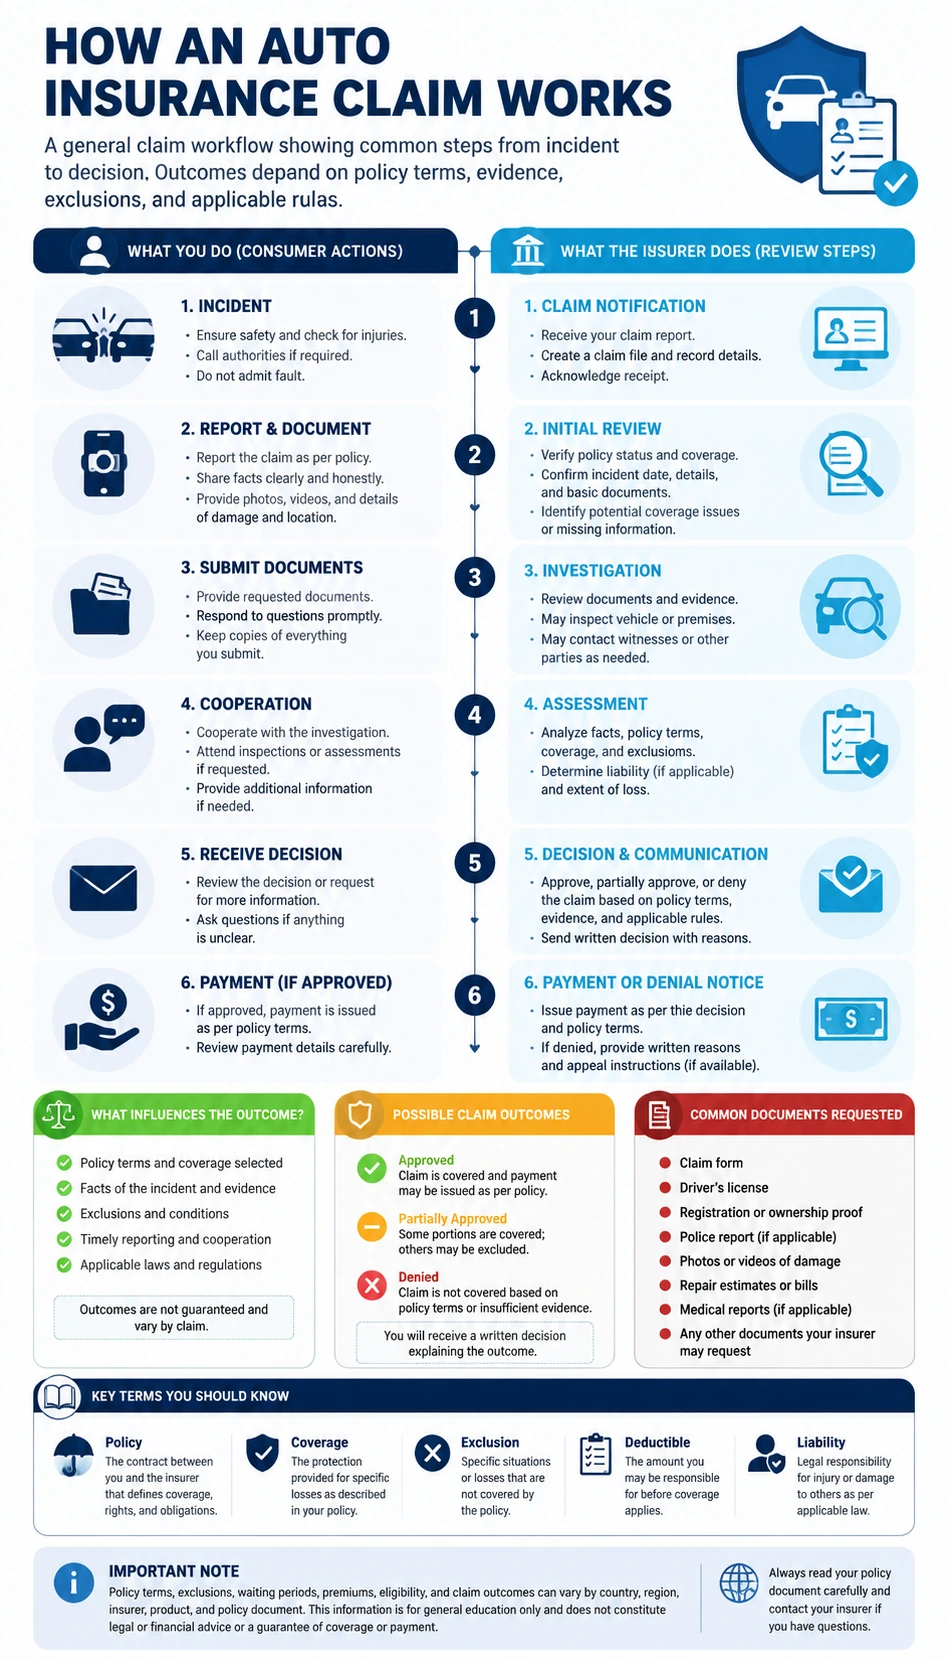
This How an Auto Insurance Claim Works Infographic helps readers understand coverage structure, claim steps, property risks, travel scenarios, or everyday insurance vocabulary through a clear visual layout. The infographic is built for general insurance education, so it explains concepts and terms without recommending a specific insurer, product, coverage amount, or personal decision. It can help consumers, families, founders, educators, and content teams see how the topic fits into policy documents, claims, coverage layers, or risk transfer. As an Insurance Infographic Generator example, it keeps the wording neutral and reminds readers that insurance terms vary by country, region, company, and policy.