About this insurance infographic
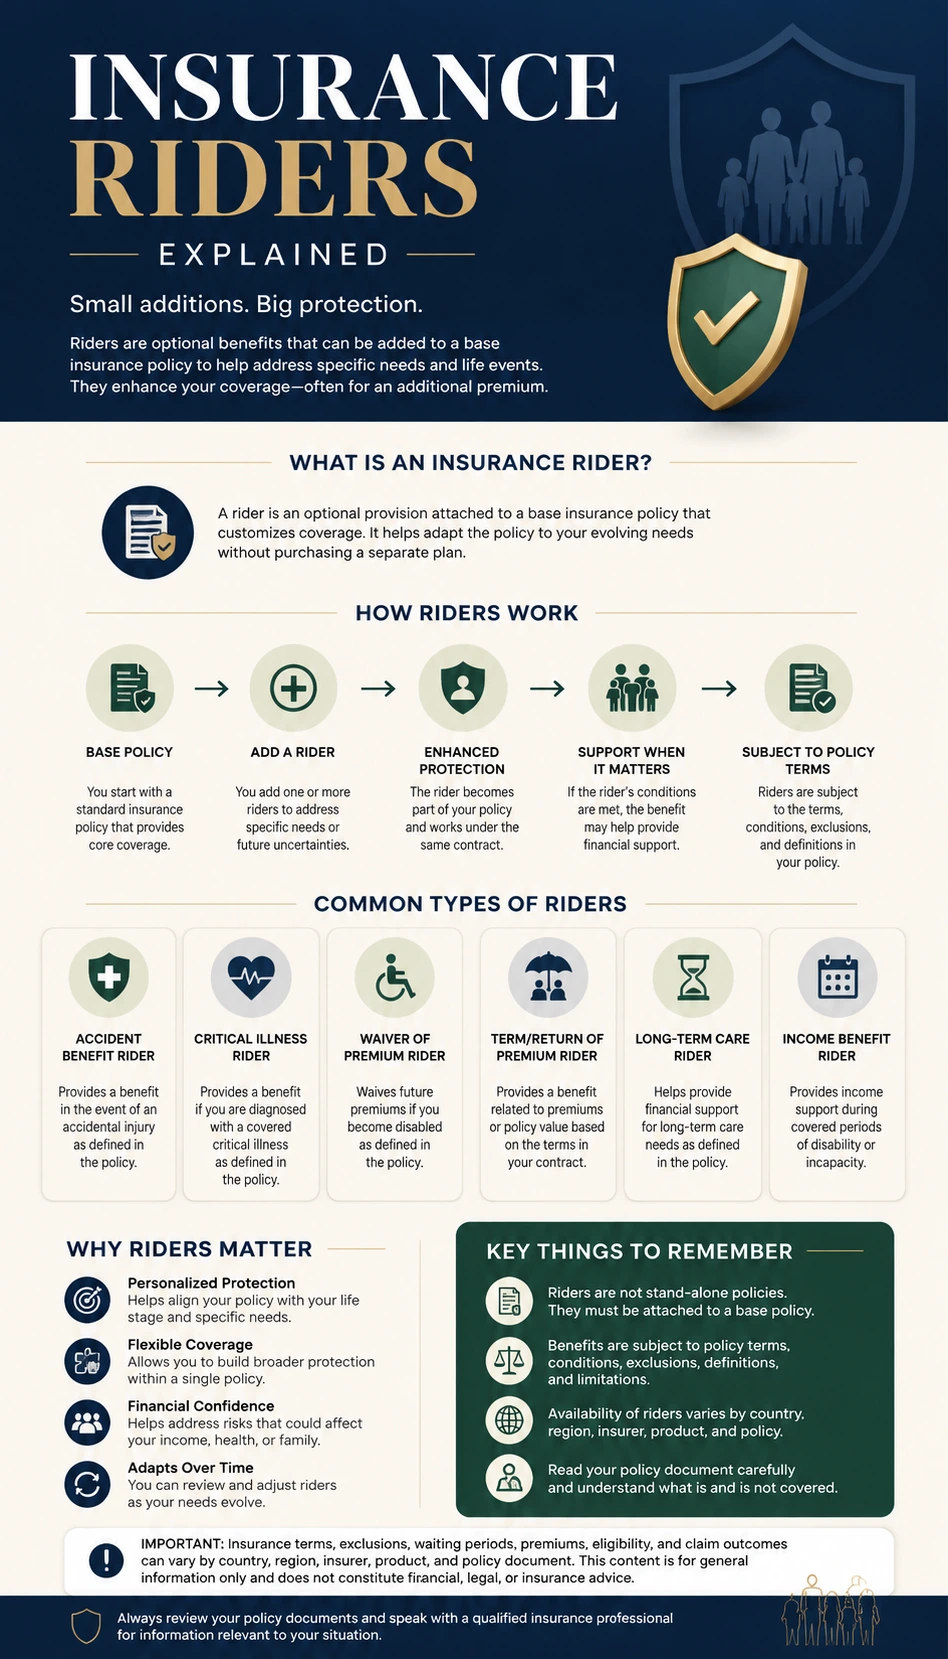
This Insurance Riders Explained Infographic helps readers understand risk protection, beneficiaries, income disruption, long-term care, or layered coverage concepts through a clear visual layout. The infographic is built for general insurance education, so it explains concepts and terms without recommending a specific insurer, product, coverage amount, or personal decision. It can help consumers, families, founders, educators, and content teams see how the topic fits into policy documents, claims, coverage layers, or risk transfer. As an Insurance Infographic Generator example, it keeps the wording neutral and reminds readers that insurance terms vary by country, region, company, and policy.