Roadmap Infographic Template

Cloud Migration Roadmap Infographic Template

A structured cloud migration roadmap infographic template with clear phases, milestones, and mobile-readable action flow.

cloud migration roadmap infographic with clear milestones and stage planning
Cloud Migration Roadmap Infographic created with KnowLens AI as a structured roadmap infographic template.
Aspect 9:16Transformation Program Roadmap StyleDownload disabled

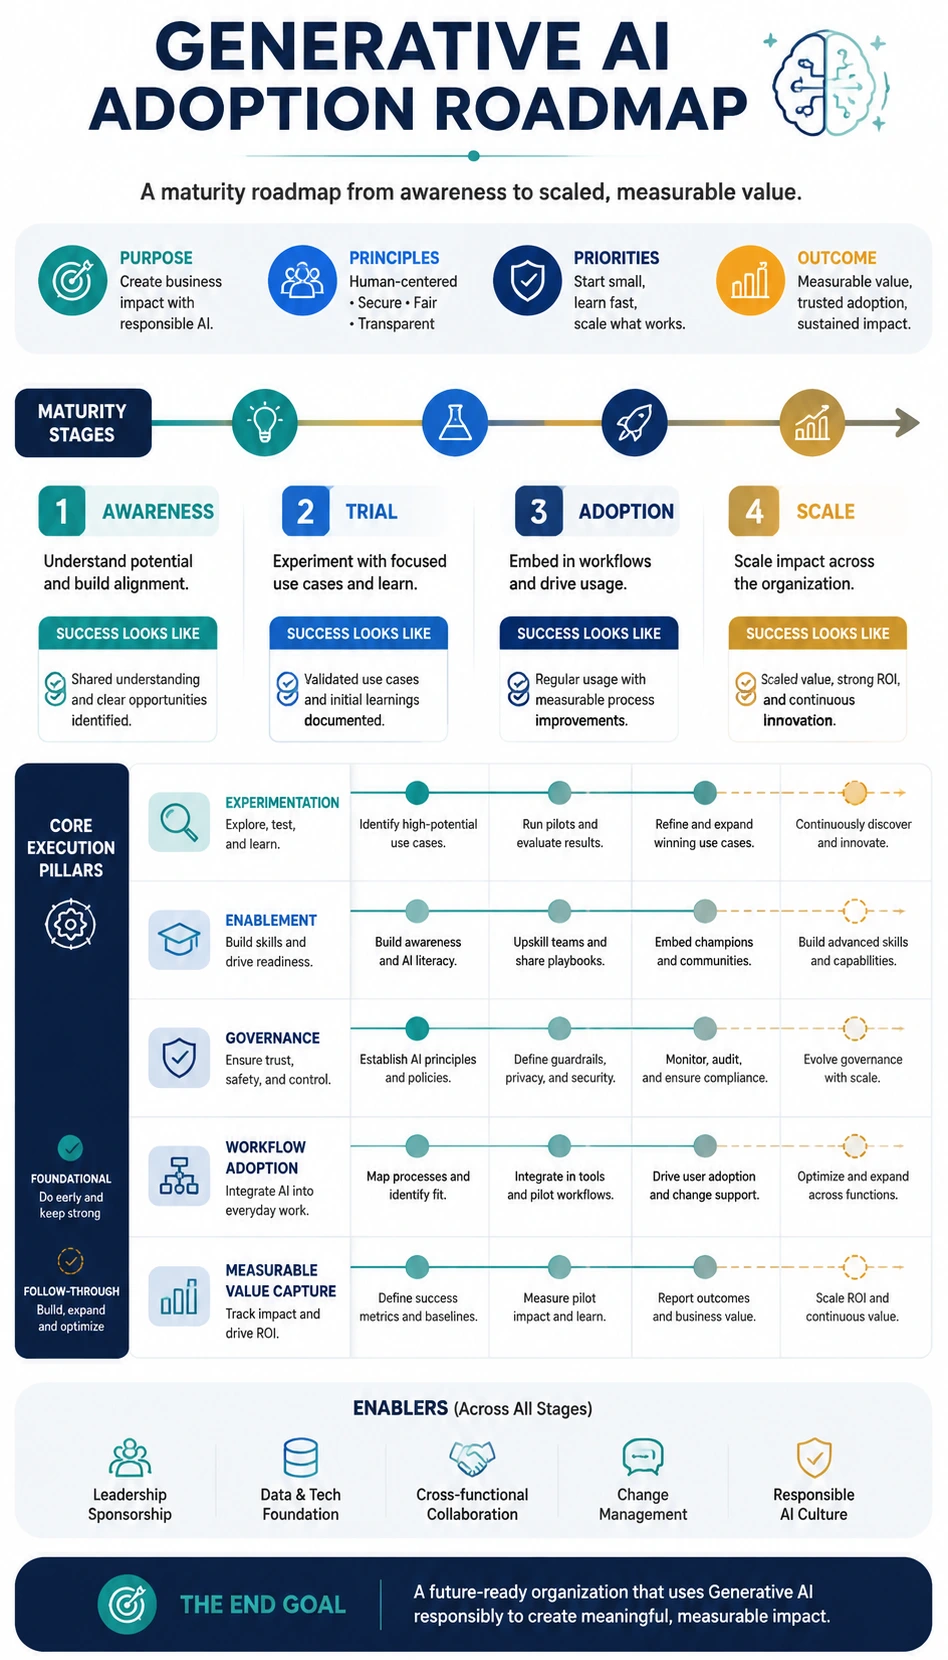
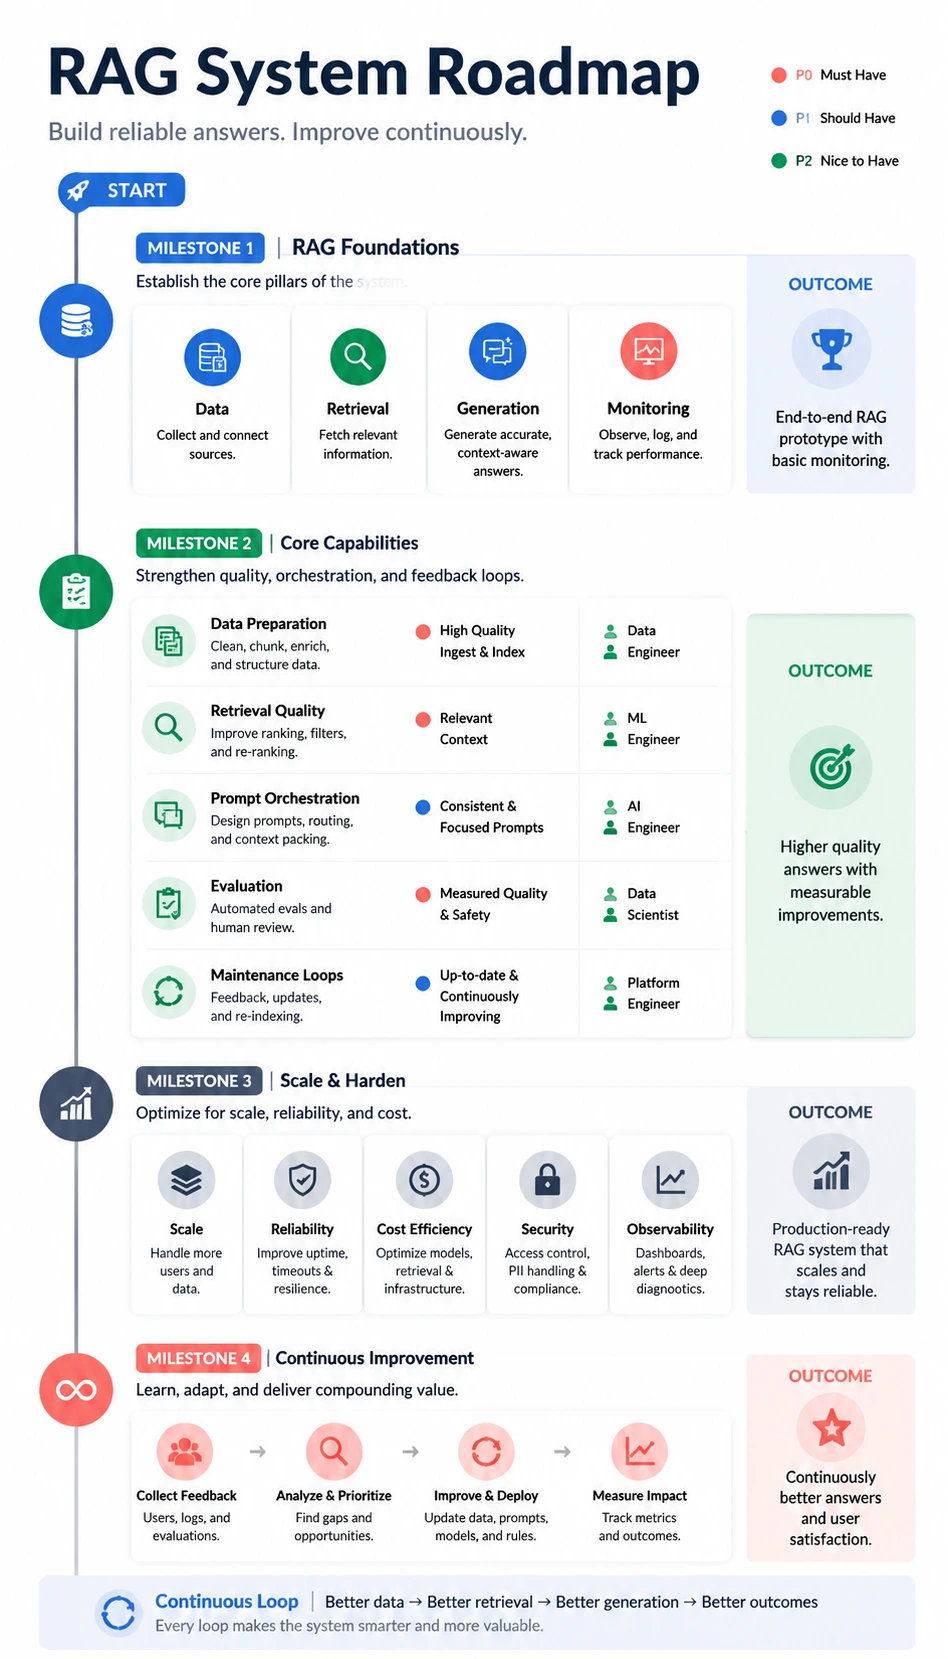
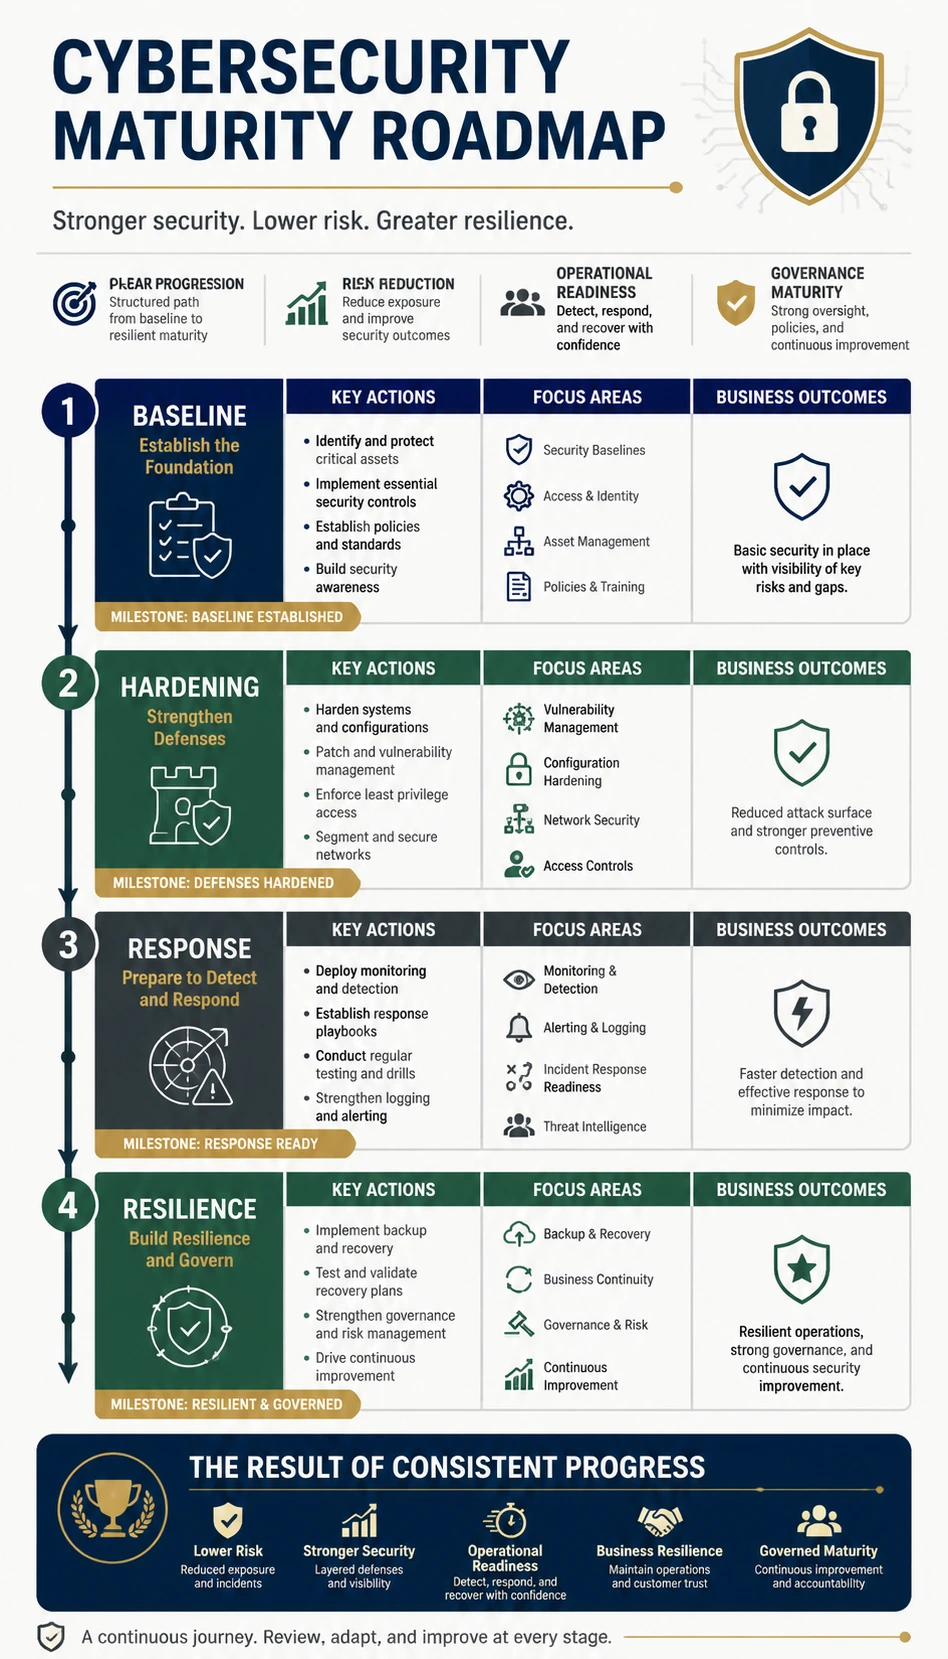
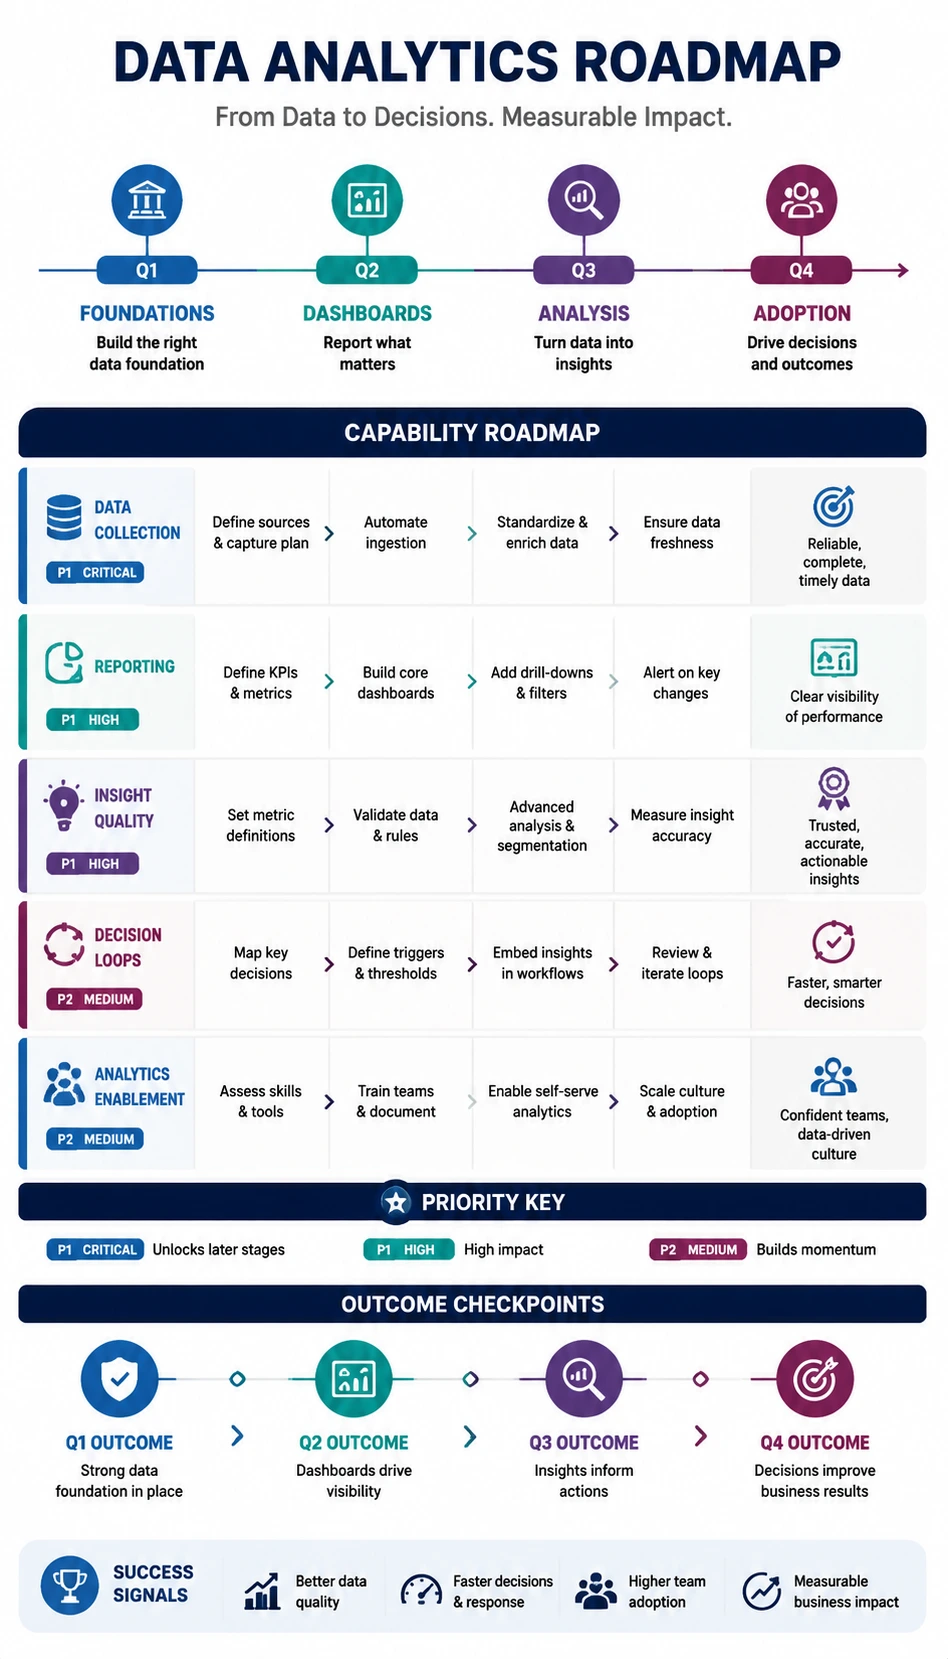
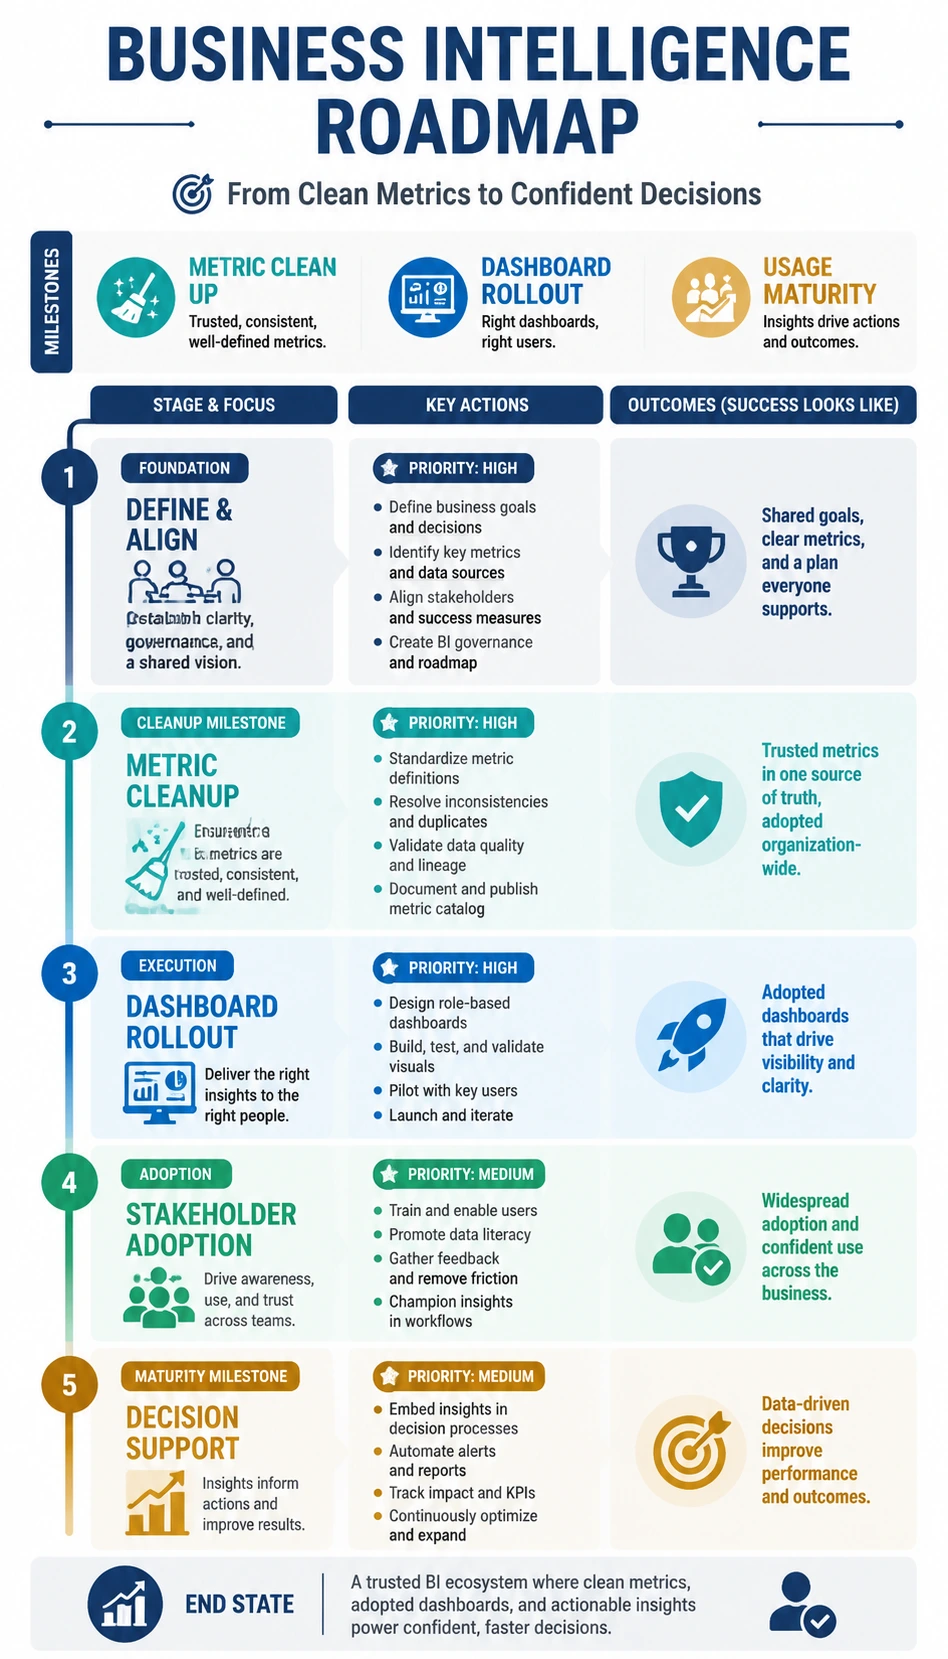
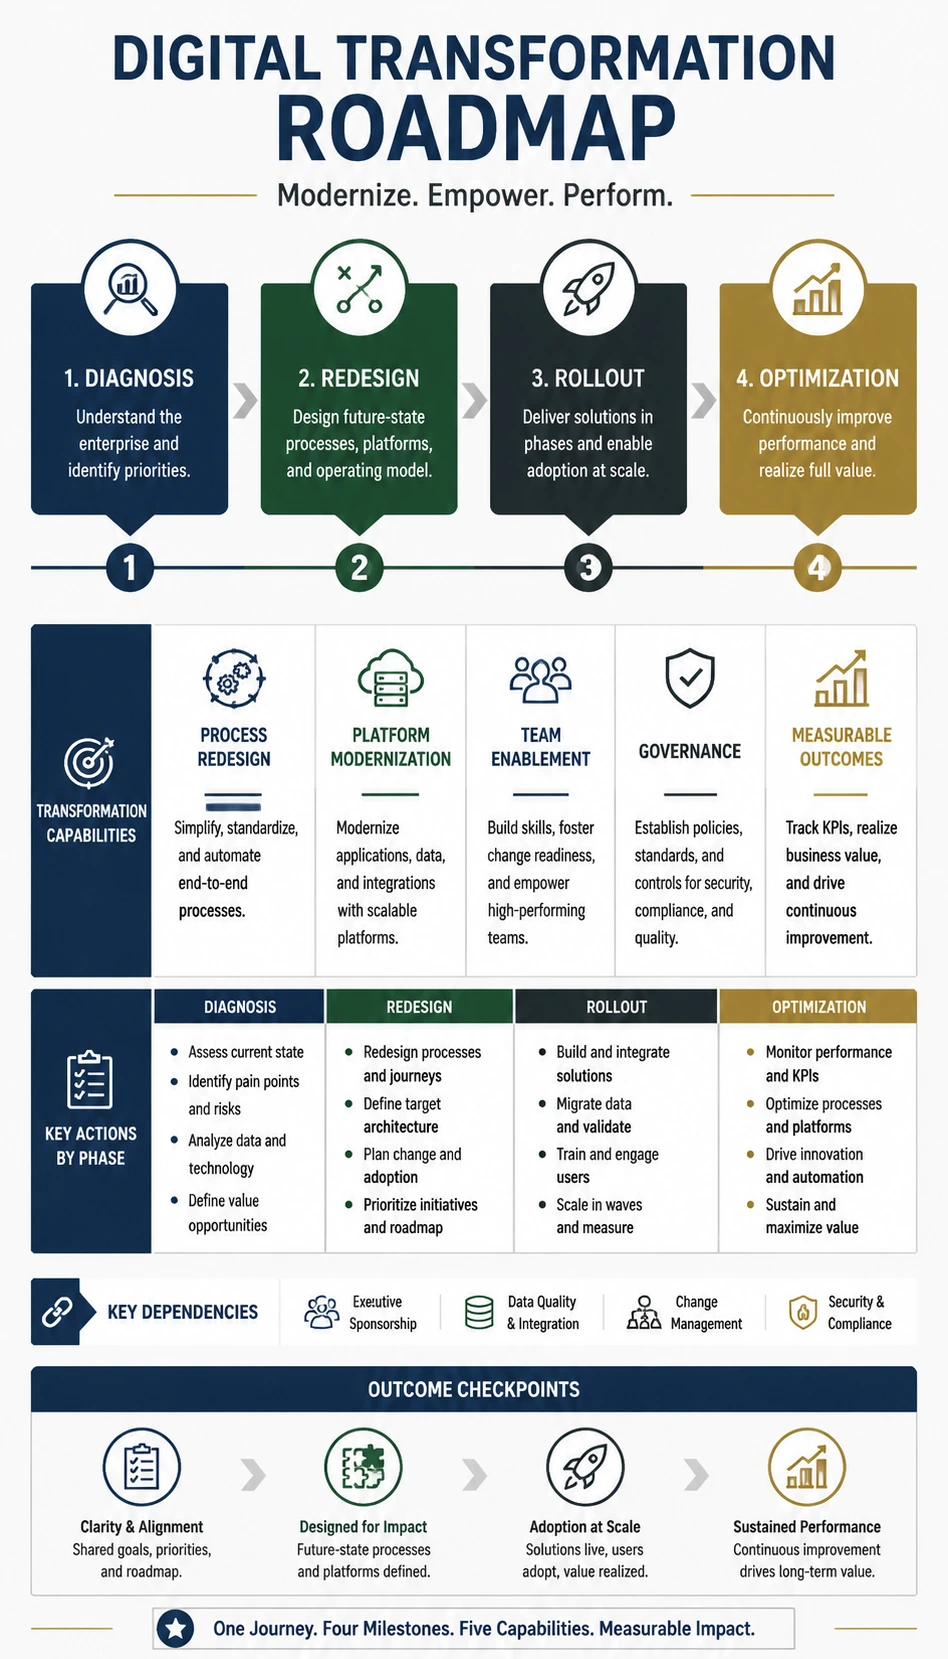
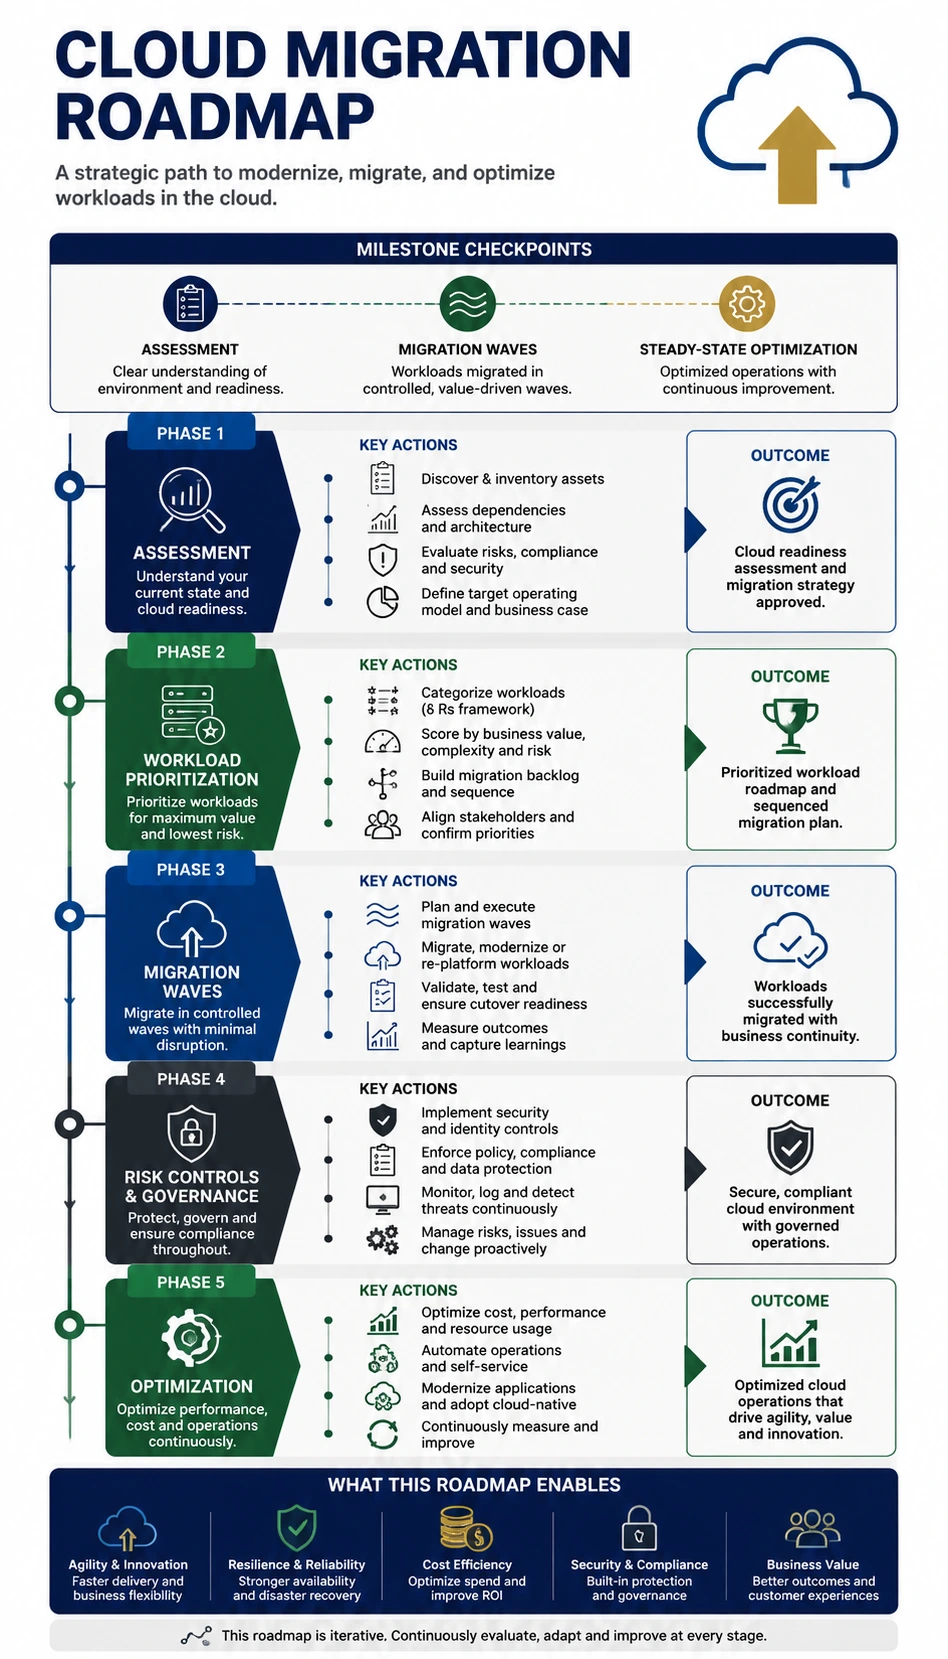
About this roadmap infographic

This Cloud Migration Roadmap Infographic is designed for people who need to explain a roadmap clearly without losing the sequence, milestones, or decision logic behind it. It works especially well for founders, product teams, marketers, learners, operators, and educators who want to turn a messy planning process into a visual that is easy to present, share, and review. The infographic breaks the topic into structured stages so viewers can see where the roadmap begins, what the core priorities are in the middle, and which milestones signal readiness for the next phase. Rather than acting like a decorative poster, it helps readers understand the order of execution, the key actions inside each step, the dependencies between stages, and the outcomes that each checkpoint is meant to unlock. That makes it useful for strategy discussions, onboarding, classroom teaching, internal planning, and social sharing. Because roadmap topics often involve many moving parts, this visual format is especially effective for showing progression, priorities, momentum, and next-step clarity in one mobile-friendly view.

Template details

Topic
Cloud Migration Roadmap Infographic
Aspect ratio
9:16
Structure
transformation roadmap
Style
Transformation Program Roadmap Style
Category
Roadmap
Download
Disabled

Key learning points

  • The opening phase focuses on assessment, migration waves, and steady-state optimization.
  • The central roadmap view should separate assessment, workload prioritization, migration waves, risk controls, and optimization.
  • The roadmap is stronger when dependencies are visible instead of implied.
  • A strong closing phase should show what the roadmap enables after execution.
  • Mobile-friendly layouts work best when each stage has one clear action focus and one visible checkpoint.

Use cases and audience

Use cases

  • migration planning
  • technology strategy
  • enterprise education
  • stakeholder alignment

Target audience

  • IT leaders
  • architects
  • consultants
  • students

Create a similar roadmap infographic

Use this prepared prompt to create a similar roadmap visual with KnowLens AI. The prompt keeps the phase structure, milestone logic, mobile readability direction, and action hierarchy aligned with this example.

Create similar infographic

Related roadmap infographic templates