Financial Report Infographic Template

Micron DRAM and HBM Demand Infographic Template

A source-backed micron dram and hbm demand infographic template for earnings and market report learning.

Micron DRAM and HBM Demand finance infographic poster
Micron DRAM and HBM Demand infographic - a source-backed finance report insight poster created with KnowLens AI.
Aspect 9:16Dark Premium Finance Insight StyleDownload disabled

About this finance infographic

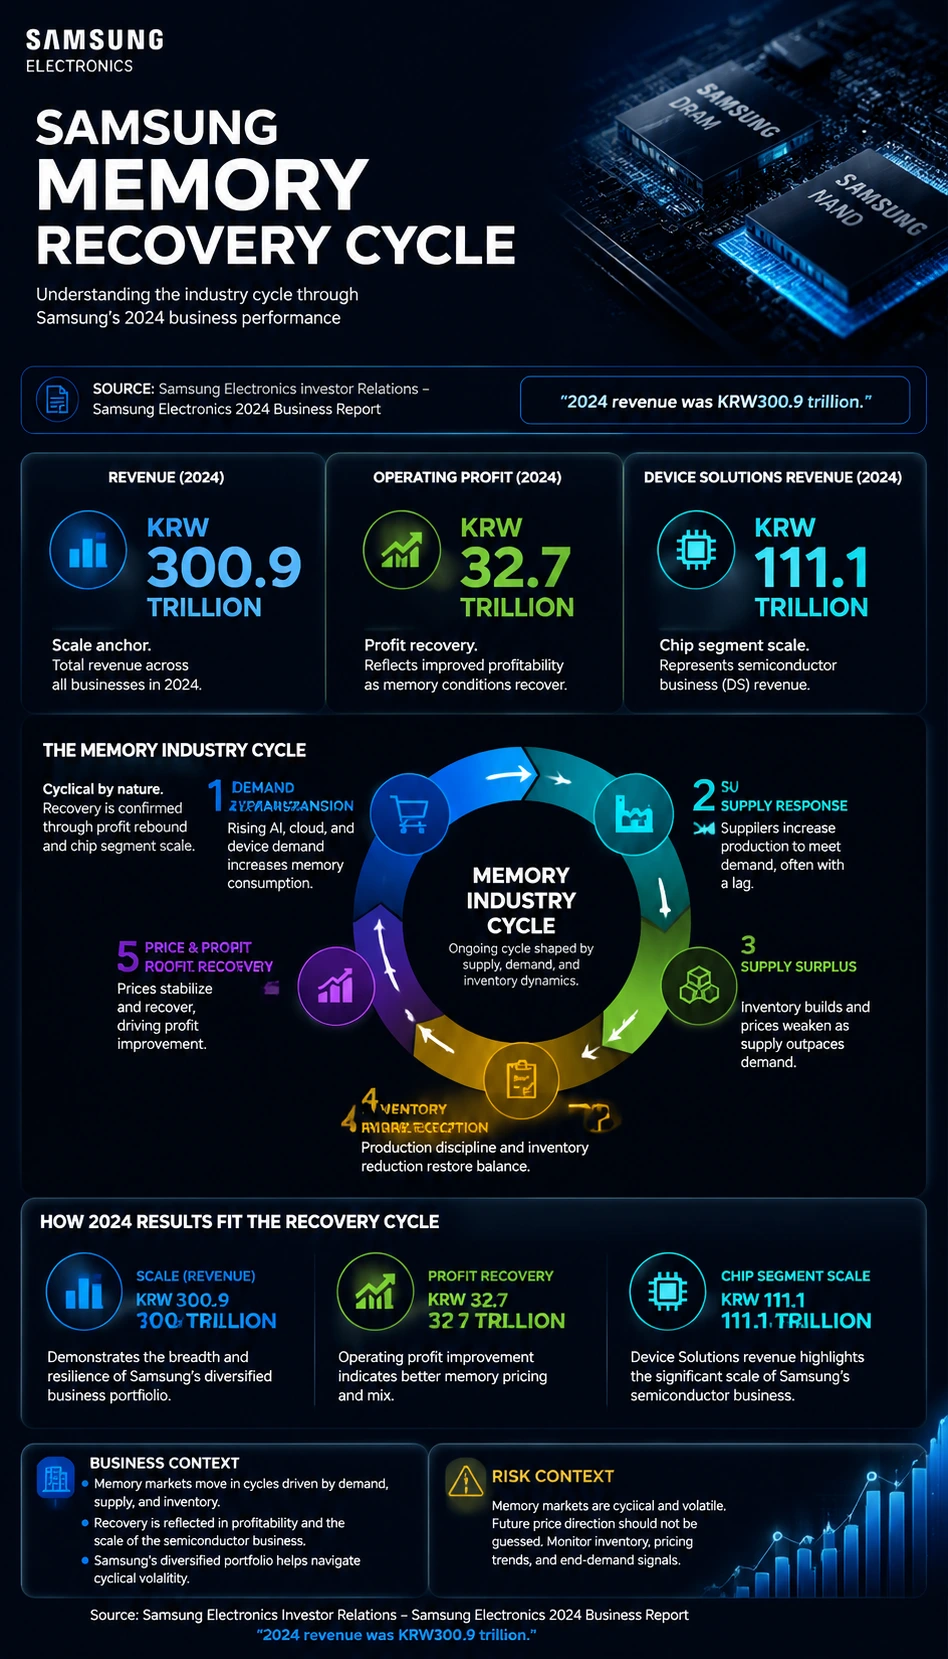
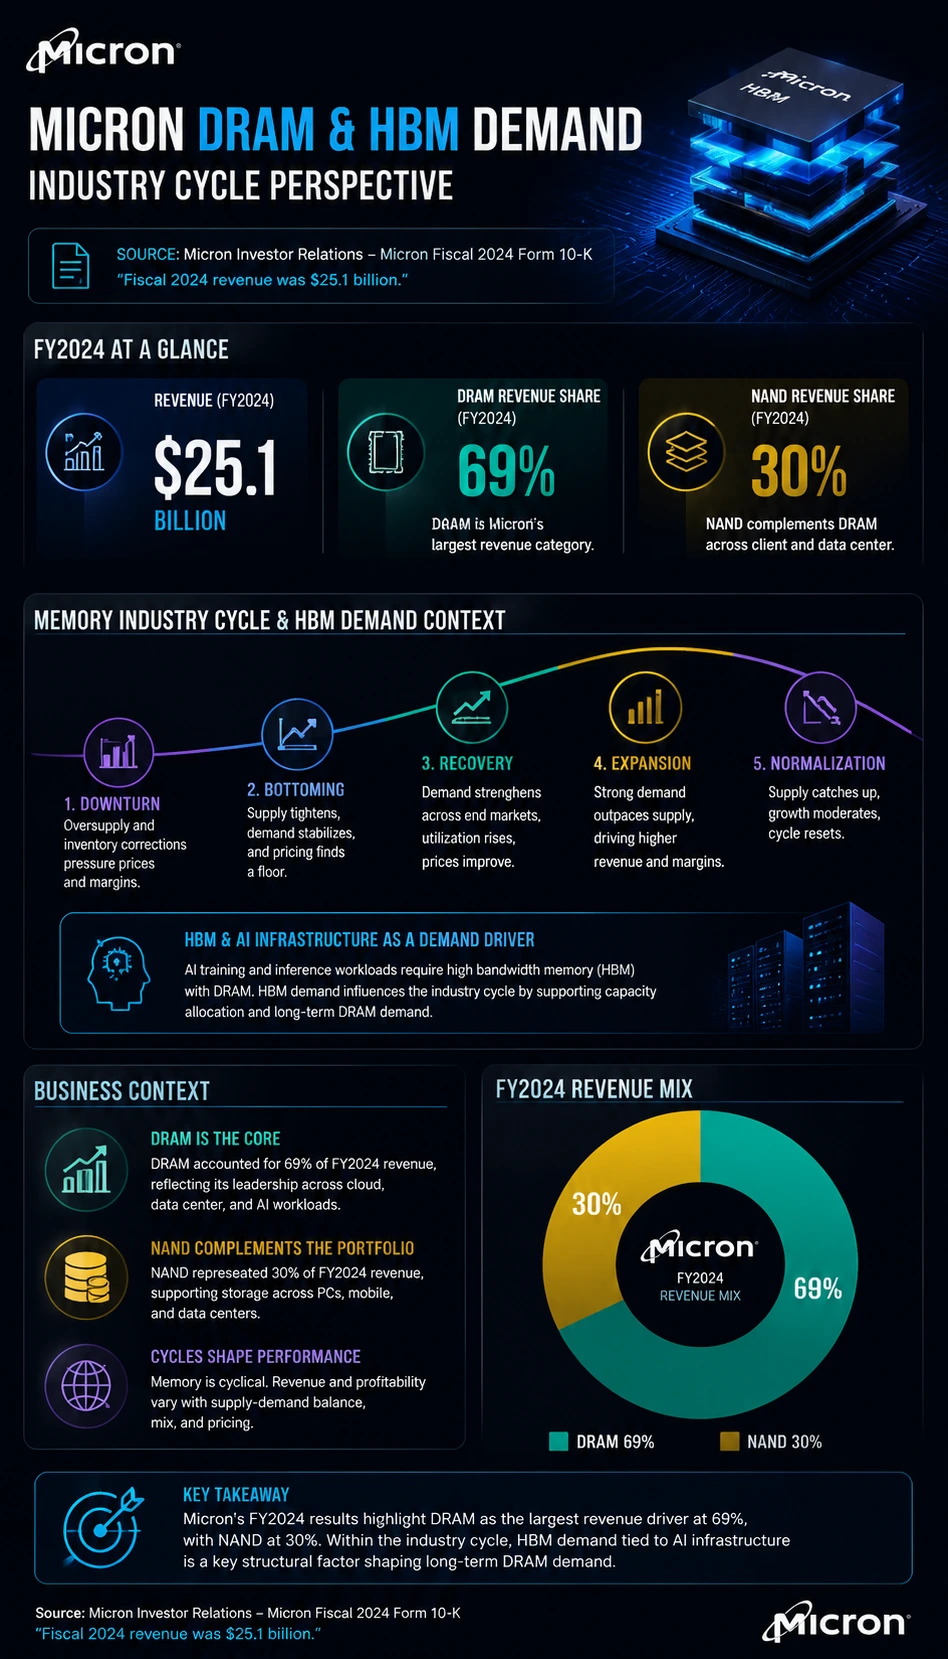
This Micron DRAM and HBM Demand Infographic turns Micron Investor Relations's reported figures into a clear finance visual for earnings, market report, and business model learning. It uses a industry cycle chart layout to connect Revenue, DRAM revenue share, and NAND revenue share with source-aware explanation. Built as a Financial Report Infographic Generator example, it helps readers scan the source, understand the metric relationships, and compare the business context without copying long source text or offering investment advice.

Template details

Topic
Micron DRAM and HBM Demand
Aspect ratio
9:16
Structure
industry cycle chart
Style
Dark Premium Finance Insight Style
Category
Financial Report
Download
Disabled

Key learning points

  • Revenue is the anchor figure for this industry cycle chart view: $25.1 billion in FY2024.
  • DRAM revenue share adds a different lens, helping the poster avoid reducing the topic to one headline metric.
  • NAND revenue share provides the third data layer so the visual can separate scale, mix, margin, or operating pressure.
  • The core interpretation is to show DRAM as the largest revenue category and HBM as AI memory context.
  • The risk context is specific: do not invent HBM capacity or pricing data.

Source and data points

Micron Investor Relations reports micron dram and hbm demand through company-disclosed metrics. The infographic uses the source as a data anchor and turns the figures into original, non-advisory financial explanation.

Source: Micron Investor Relations
Revenue
$25.1 billion
FY2024
DRAM revenue share
69%
FY2024
NAND revenue share
30%
FY2024

Create a similar finance infographic

Use this prepared prompt to create a similar source-backed financial report visual with KnowLens AI. The prompt keeps the source, aspect ratio, style direction, and verified metric structure aligned with this example.

Create similar infographic

Related finance infographic templates